The top window is the daily Gold chart; bottom window is the daily GDX and middle window is the physical premium for gold in the Sprott gold trust. We noted the times when the premium for the Sprott gold trust falls below -2.25% (buying fund at a 2.25% discount compared to price of gold). This is a sentiment indicator. Current discount is 3.12%. This chart goes back to mid 2019. In all cases the $GDX was near a low. The current discount below -2.25 has been going on since April and the last time the discount stayed below -2.25 for over two month was back in late 2022 – early 2023 (noted is shaded green). Sentiment is bullish suggesting a low is not far off.
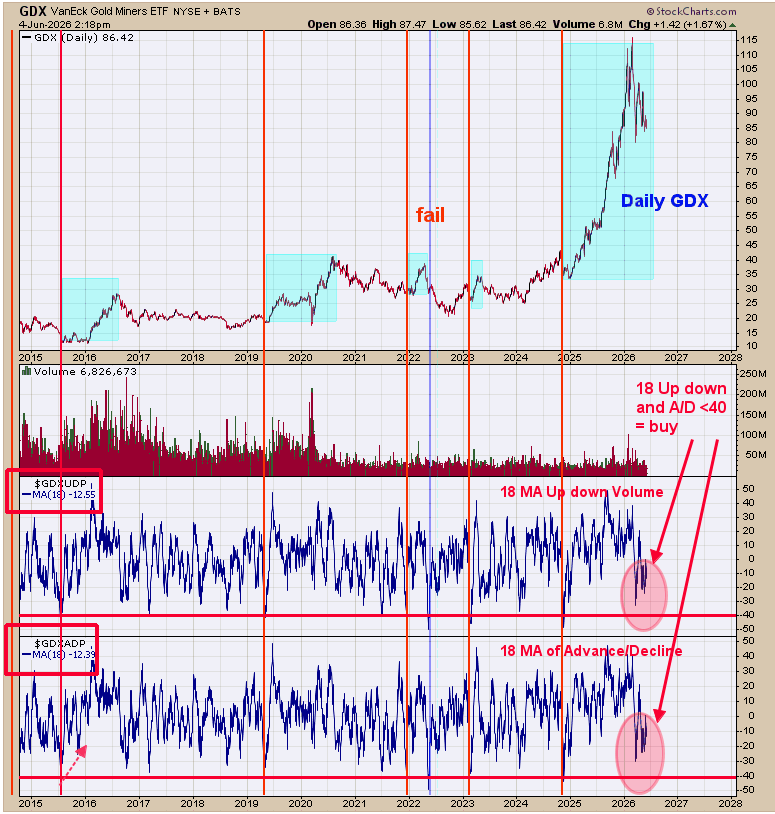
The bottom window is the GDX advance/decline with an 18 day average; next higher window is the GDX up down volume with an 18 day average, top window is the daily GDX. We noted with red lines when both indicators reach below -40 showing panic in the advance/decline and up down volume. The minus 40 levels in both indicators show exhaustion to the downside and in turn where bottoms form. We shaded in light blue on the daily GDX when these exhaustion readings on these indicators occurred. What may transpire in the coming days are for both indicators reach -40 levels and setting up the next rally phase for $GDX. Both indicators are coming in near the -12 range right now and near -30 points away from our target range.
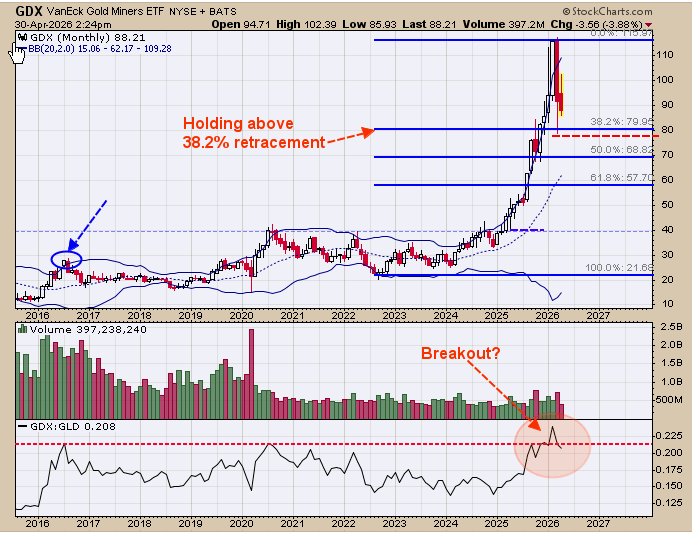
The bottom window is the monthly GDX/GLD ratio and next higher window is the monthly $GDX. In bull market the GDX/GLD ratio rises and in bear market this ratio declines. The GDX/GLD ratio has been in a sideways trading range going back to 2014 (12 years) and is due for a breakout. We circled in pink where we are now. This ratio has traded above the two previous highs of 2020 and 2016 which came in near .21 levels. This ratio has been hovering near .22 since late 2025 and not backing away form the breakout area. If a market holds near the breakout area; it implies the market is eating through the supply and in turn the resistance level. It appears GDX/GLD may be breakout out of the .22 level; next upside resistance is the .40 range. If the .40 range is achieved, than GDX would near double form current prices. We are keeping our eye on the bigger timeframes as a large rally in GDX is not far off.
$GDX is at a low (see previous reports); having said that, a trading range may be starting. The top window is the monthly XAU going back to 1982; middle window is the monthly Silver/Gold ratio; bottom window is the percent Bollinger band (reading of 1 is above the upper Bollinger; 0 reading is below lower Bollinger) and next higher window is the “Rate of Chance” (ROC) for the monthly $Silver/Gold ratio. We noted the times going back to 1982 where the ROC and Percent Bollinger band for the monthly Silver/Gold ratio reached above the upper red dotted lines (note vertical noted red lines). Looking at the monthly XAU we noted those time on the $XAU chart with shaded blue area. Notice in all cases the XAU consolidated for several months. In summery, though GDX (XAU) is at a low a trading range is most likely beginning that can last several months. Once the consolidation is completed new highs is expected.
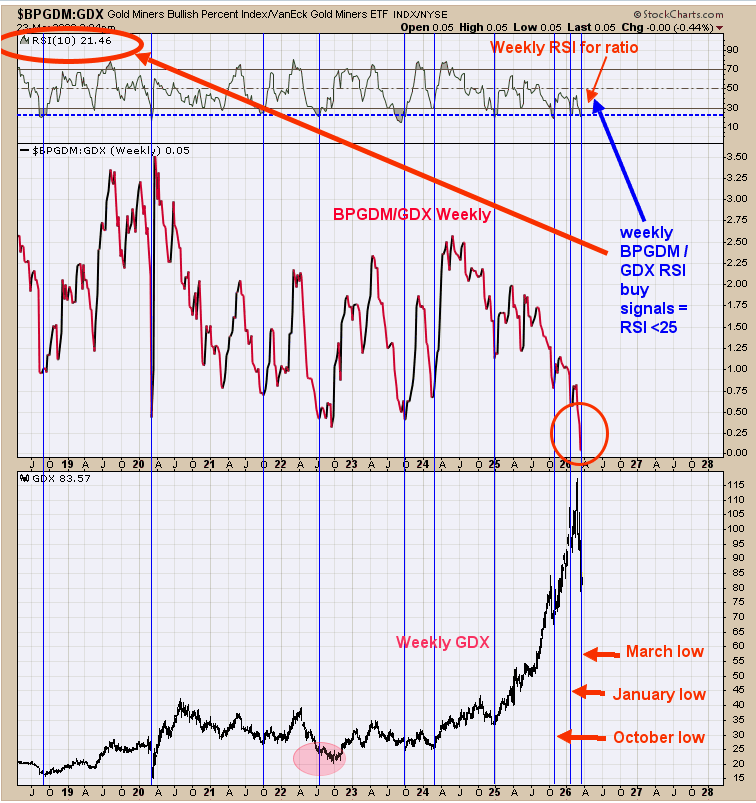
Pull back in $GDX appears complete. Bottom window is the weekly GDX, next higher window is the weekly bullish percent index for the Gold Miners index/GDX ratio and the top window is the 10 period weekly RSI for the ratio. We noted the times with blue lines when the weekly RSI for the weekly Bullish percent index for the Gold Miners index/GDX reached below 25. This chart goes back to mid 2018. Since 2018 until now the RSI reached below .25 nine times (not counting current signal) and eight times the market was at the low and one time is was near the low (back in 2022 pink circle). Over the last five months there have been three signals and the October and January signal worked perfect leaving the current signal to be determined. The odds suggests a low is forming here.
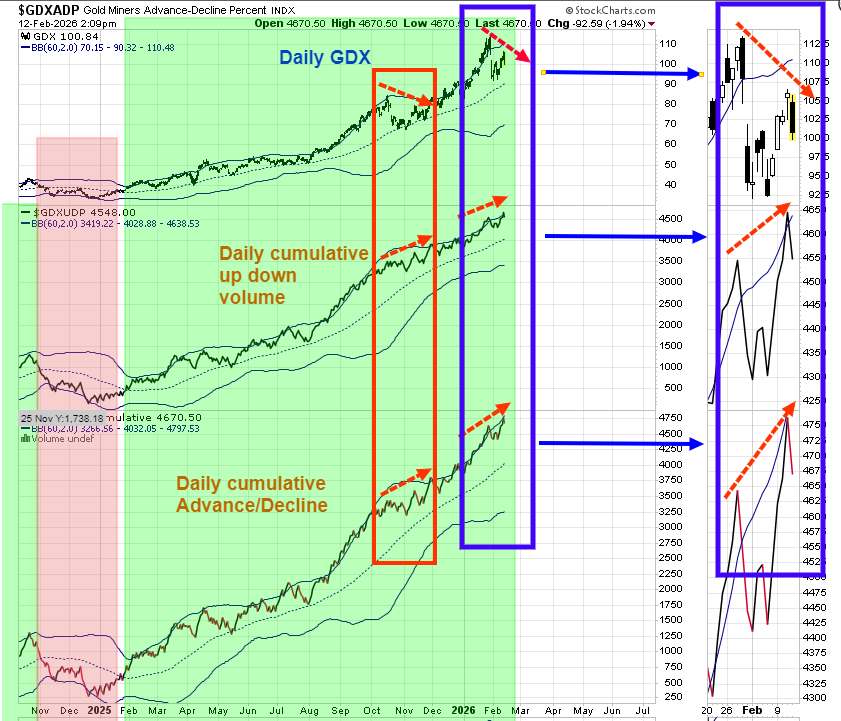
The bottom window is the daily cumulative advance/decline for GDX and next higher window is the daily cumulative up down volume for GDX and top window is the GDX. We noted with a red box the previous time where both daily cumulative up down volume and cumulative advance/decline made higher highs while $GDX made a lower high. This positive divergence was a bullish sign for GDX’s rally to continue; which it did. Looking at the far right window in the blue box we have the same setup where the cumulative advance/decline and cumulative up down volume have made higher highs suggests GDX at a minimum will get back its old high if not higher.
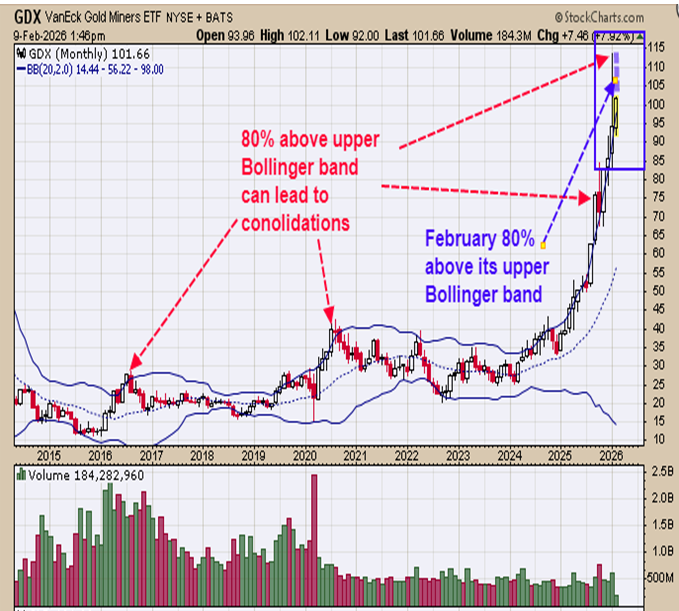
Last Thursday’s commentary we pointed out that the shaded green area on the BPGDM/GDX window show where previous bottoms have formed and we are in that area now (see last Thursday’s report). Having said that. GDX may be due for a consolidation. Above is the monthly GDX with its Bollinger band. We noted with red arrows the times when 80% of GDX trading range was above its upper monthly Bollinger band. Last month $GDX graded above 113 which had it closed there would have seen 80% of January trading above its upper Bollinger band. Since 80% of its January trading range was above its upper Bollinger band the market was stretched and did retrace at the end of the month. There is evidence that the January high may be tested. If indeed January high is tested this month it will have again be 80% of its trading range above it upper Bollinger band. This is one of the reasons that a trading range may be developing. With the BPGDM/GDX ratio in bullish territory no top of any consequence is expected but a sideways pattern is possible. Longer term trend remain bullish.
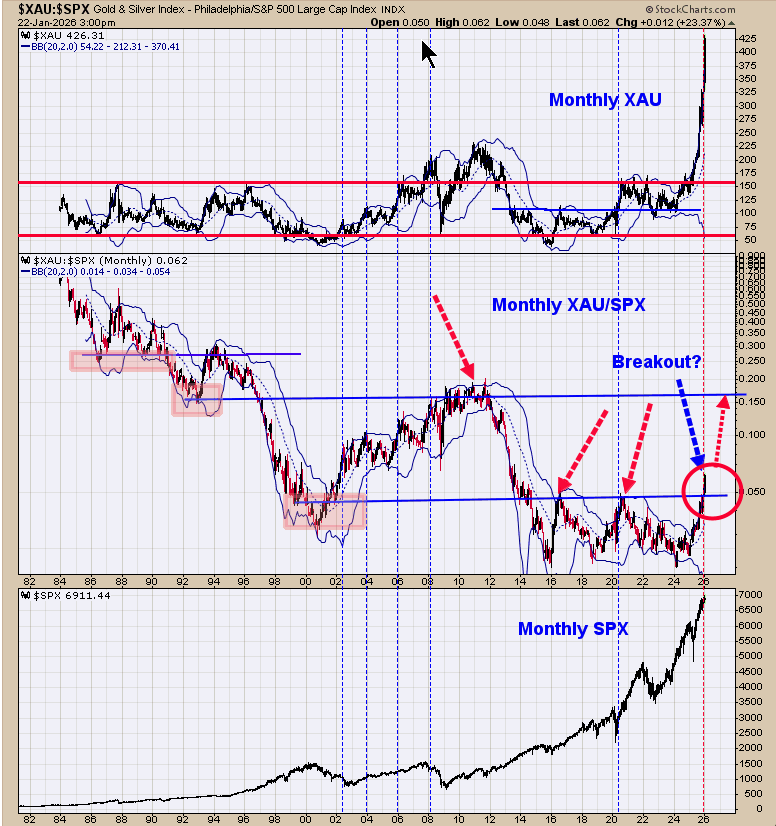
The middle window is the monthly $XAU/SPX. When this ratio is rising than $XAU is outperforming SPX and when this ratio falling than SPX is outperforming the XAU. This ratio has been rising since the start of 2024 (2 years) showing that gold stocks have been outperforming SPX stocks. The red circle on the chart shows a breakout where it closed above its previous highs of 2016 and 2020 highs near .05. This breakout suggests the XAU/SPX ratio will go (at some point) to the next higher resistance which is the 2010 high near .15. So what does that mean? If the .15 level is reached it will mean that gold stocks ($XAU) will outperform the $SPX stocks by 300%. Gold stocks may be the place to be over the next several years.
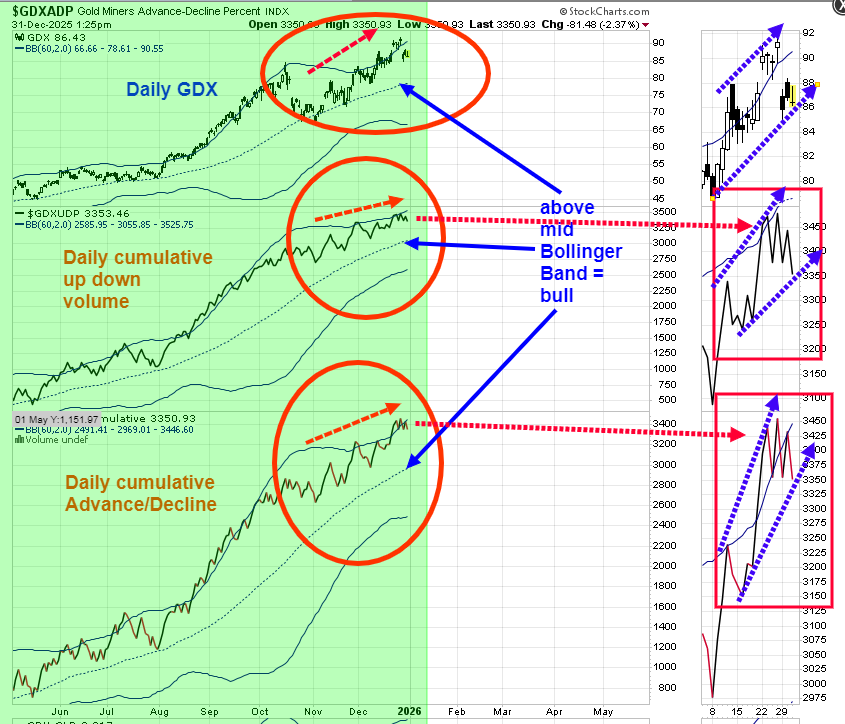
Looking at the chart above to the far right window you will see a blown up window that show the smaller time frame for the daily cumulative advance/decline and cumulative up down volume for GDX along with GDX at the top. Notice that both indicators are making higher highs and higher lows (blue arrows) along with GDX which is the definition of a bullish uptrend. This setup suggests GDX may start to move higher in the coming days. The previous commentary still apples, “Momentum rules all indicators. We are looking at the smaller time frame in search of pending divergences. The bottom window is the daily cumulative advance/decline and next higher window is the daily cumulative up down volume, both for the GDX; the top window is GDX. We shaded in green when both indicators are above their mid Bollinger band showing an uptrend in GDX. GDX did pull back today, but both indicators stayed near there highs, showing strength. Tops forms in markets by making multi tops and so far we have just one top. Seasonality turns bullish for gold again in early January suggesting rally has further to go.
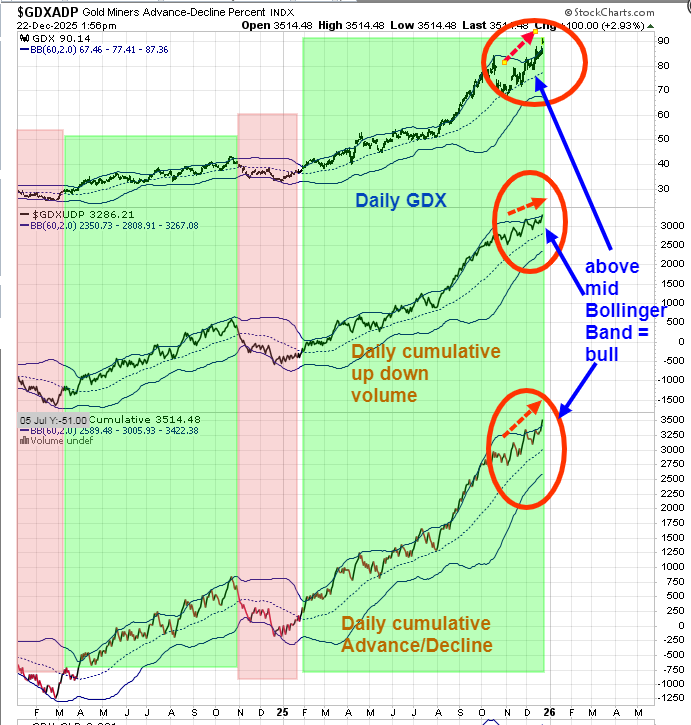
Momentum rules all indicators. Above are two momentum studies; bottom window is the daily cumulative advance/decline and next higher window is the daily cumulative up down volume, both for the GDX; the top window is GDX. We shaded in green when both indicators are above their mid Bollinger band showing an uptrend in GDX and shaded in pink when both indicators are below their mid Bollinger band. Both indicators a well both their mid Bollinger band showing GDX is in an uptrend.
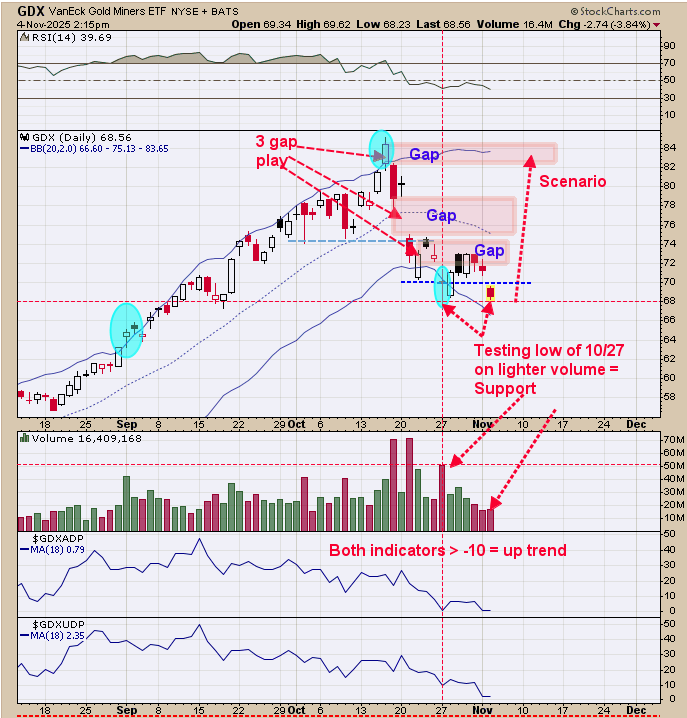
A short term low is near. On October 27, GDX made a low of 68.13 on volume 51 million shares. To have a valid break through the 10/27 low of 38.13, volume should be at least equal to the 10/27 volume of 51 million shares and that appears unlikely. Most likely a low near current level is forming. $GDX also produced a “Three Gap Play” to the downside; this pattern predicts on the third gap down the market will reverse and rally back to the first gap. The first gap came in near the 84.00 range. Long GDX on 9/29/25 at 75.76. find us on Twitter at @OrdOracle.
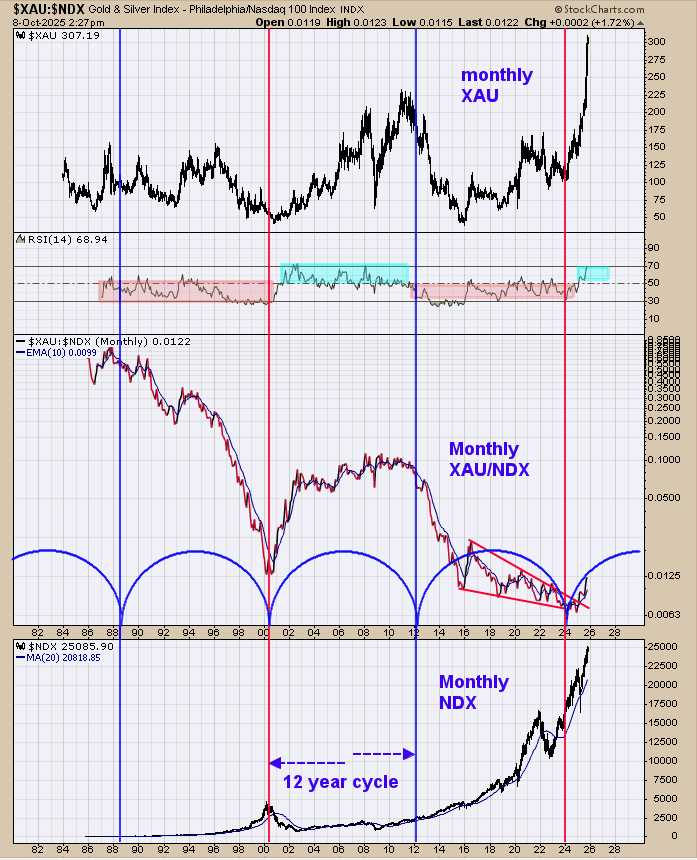
The top window is the monthly $XAU next lower window is the monthly XAU/NDX and bottom window is the monthly NDX. The monthly XAU/NDX has it’s RSI in the next window up. When the XAU/NDX is rising than XAU is out performing the NDX and the RSI will stay above +50. When this ratio is falling than NDX is outperforming the XAU and the monthly RSI stays below +50, We shaded in pink the RSI when it’s below 50 and shaded in light green when above +50. There appears to be a 12 year cycle where XAU outperforms the $NDX and than NDX outperforms the XAU. This ratio turned up in early 2024 and the RSI closed above +50 earlier this year and has hit near +70 recently suggesting a 12 year period where the XAU may outperform the NDX.
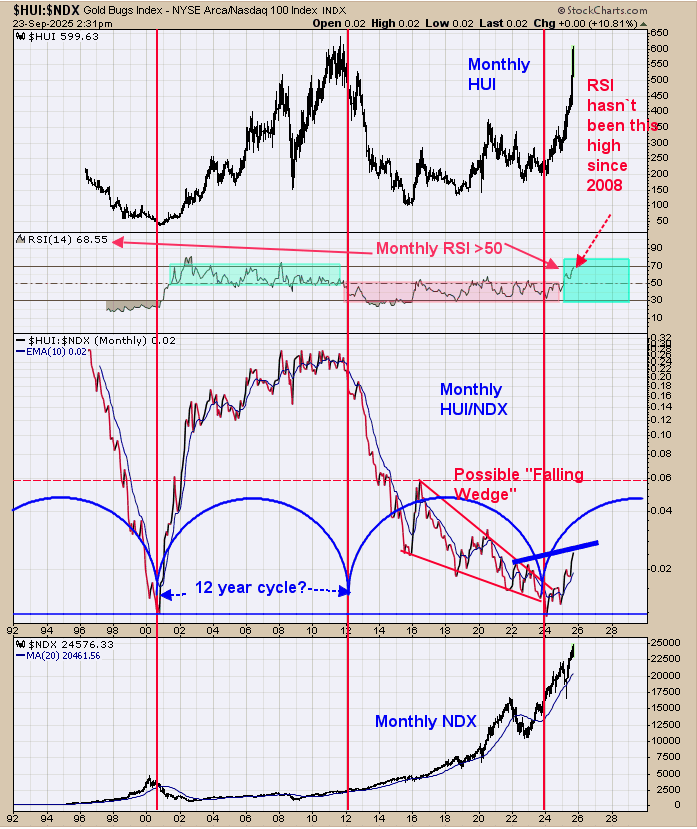
The short term trend remains up for $GDX. Above is a long term view of the gold market. The second window up from the bottom is the month HUI/NDX ratio (dating back to 1996). There appears to be a 12 year cycle where HUI outperforms $NDX (when this ratio is rising) and then 12 years where NDX is outperforming HUI (falling ratio). This ratio has turned back up in early 2024 suggesting a 12 year cycle has started and that the HUI may outperform NDX for the next 12 years and last into 2036. The window above the monthly HUI/NDX is the RSI for this ratio. Recently this RSI has broke above the 50 level reaching to 68 currently, showing that the HUI/NDX is rising; also notice that the HUI/NDX has traded above a previous high (noted with blue line) which is the definition of a rising market. We will keep on eye on this ratio going forward and will notify you if thing change. A lot of gold stock are now penny stocks and if the chart above plays out many of these gold penny stocks could become $1, $10 for more. We don’t have it shown but the XAU/Gold ratio is cheap compared to history.
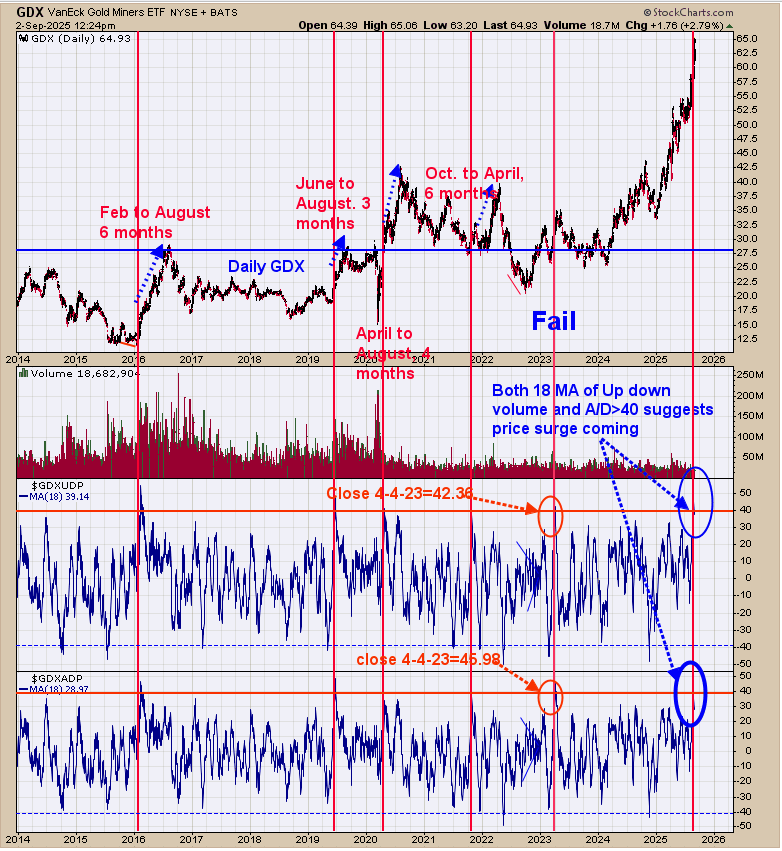
The bottom window is the 18 ma of the Advance/Decline for GDX and next higher window is the 18 ma of the up down volume for GDX. This chart goes back to 2014. We marked the times with red lines when both indicators reached +40 (bottom indicator reached 39.48 yesterday and current reading on other indicator is 44.99). What happens next is sometimes a mild consolidation before another surge higher that cans last 3 to 6 months. This is a rare occurrence as it has happened five times (not counting the current event) since 2014. Of the five times it occurred there was one failure in April 4 2023 (noted on chart); so that works out to be an 80% chance the current market will produce a surge in the coming weeks that may last 3 to 6 months. Want point out that the mild consolidation can last several weeks. We are thinking the senior sector may rest; where the junior sector will perform. This information suggests no top of any significant for GDX.