Quickly create accurate editorial charts and tables using https://t.co/sSKStm0qzP so that you can spend more of your time analyzing the data and discovering journal trends.
With https://t.co/sSKStm0qzP you can create visually pleasing and easy to interpret graphics that are specifically tailored to editorial office reporting.
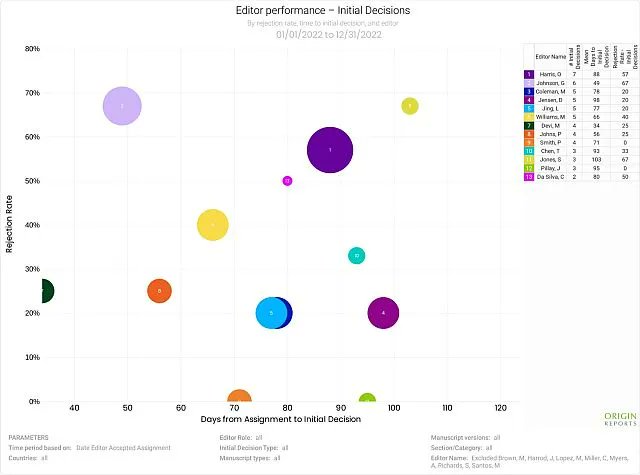
Need to compare how your editors are performing? https://t.co/sSKStm0qzP has the tools you need to make data driven decisions about your editorial staff.
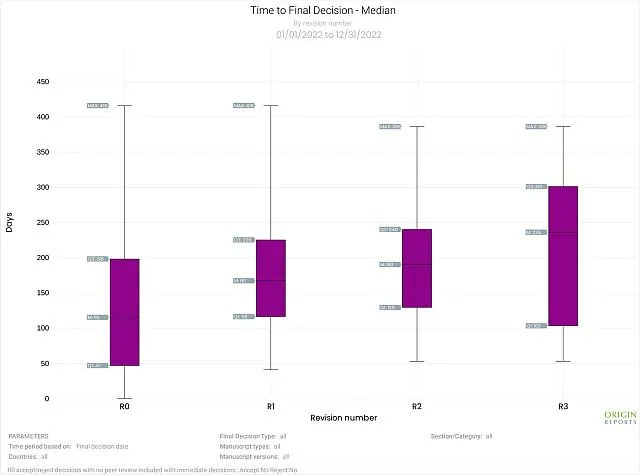
Use https://t.co/sSKStm0qzP to take a closer look at your data. Our easy to use menu allows you to create exactly the charts you need to answer the hard questions.
Let us make you look like a superhero! Answer editorial questions in minutes using https://t.co/sSKStm0qzP expertly designed editorial charts and tables.
Let Origin Reports help your team build your editorial board report in record time. Easy to use interface! Save all your custom charts for future use! https://t.co/sSKStm0qzP
Let Origin Reports help you dive into your journals data. Use our filters to create the custom charts to answer the exact questions you are asked. https://t.co/sSKStm0qzP
How did your journal's initial decisions break down last year? Use https://t.co/sSKStm0qzP to decide if your staff need to be more or less selective in the coming year.
Origin Reports helps you easily design your custom editorial board report. Save your Custom Report for even quicker reporting in the future! https://t.co/sSKStm0qzP