My nightly/premarket stock review process
After market close and prior to open, I tend to follow the process below:
1) Stock Market Dashboard
Firstly, I will review the stock market dashboard paying particular attention to the metrics in the top left corner.
I will also review the charts for $QQQE, $RSP and $IWM
to assess overall trend, risk-on/off, and breadth.
https://t.co/5XdXswzxA5
I will review the Sector SDPR ETF's to determine strong/weak sectors (the data is presented as an 'ATR Matrix' explained in this post:
https://t.co/YXleX6LkXR
I will review the "97 Club" along with the 3 ever excellent @PradeepBonde scans (9 Million Movers, 20% Weekly Movers and 4% Gainers)
2) Themes
After review the dashboard, I tend to review the 'Themes'. There are 36 Themes, represented as a Relative Strength Quadrant diagram. Themes in the top right are the strongest while themes in the bottom left are the weakest. Weekly RS is plotted on the X axis while Monthly RS is plotted on the Y axis. As a result. themes tend to rotate counter clockwise.
https://t.co/Ns0hHp9la9
3) Industry
From Themes, I then drill-down into Industries using the same process (as the design is the same).
Since the 36 Themes are constructed/mapped to 149 Finviz Industries, I tend to review the Finviz Industry RS first:
https://t.co/ehJt06P8t7
In addition, I calculate the industry RS on daily, weekly, monthly, qtr etc. timeframes and show the leading stocks for that industry and timeframe (see pic 1).
Afterwards, I like to perform the same Industry RS exercise using TradingView data as TV map industries to stocks differently (see pic 2).
4) Heatmap
Next, I will review a Darvas-style heatmap for new 20-day highs vs lows, clustering, and rotation. The "heatmap" map actually can display all of the stage analysis assignments using the same colour scheme (see 5) however it is quite jarring (see pic 3) so I typically just display new 20-day highs/lows.
https://t.co/m88pqnVbCx
5) Stage Analysis
Each stock is mapped to a "swing trading stage analysis". I focus on stocks (with above average ATR) in columns 2A-B for long ideas and the over-extended stocks (11x ATR-to-SMA50) in 2C for short ideas.
https://t.co/RM8SY62sOv
6) Relative Trend Strength (RTS)
For every stock, a Relative Trend Strength is calculated from A+ (best) to G (worst). I focus stocks (with above average ATR) in the 'A' columns i.e left 3 columns.
https://t.co/VlEdYHPAOM
7) Liquid Leaders Scan
More recently, I have been focusing on the "Liquid Leader" scan with priority given to scan 1 stocks (dark green color)
https://t.co/q1fkXjAzeR
My preferred setup is "flat base breakouts" near recent pivots. Secondary, I will look for leading stocks in leading groups with growing sales/earnings and above average ATR (ATR RS >= 50) where Price > MA10 > MA20 > MA50 and the weekly/monthly Relative Strength is 80+
I have scans setup to identify and classify these automatically into Excel tables for review.
Each day, I start with the view of "if I was all in cash today, what stocks would I buy and how much? Where would I set the stop-loss?"
Then I overlay the current portfolio to determine the delta (taking into account the prices paid).
Hope this clarifies.
@SteveDJacobs Hello, what are the differences between this watchlist and the watchlist in the Market Dashboard ?
I’m trying to understand their different usage and looking through your doc.
Thank you for your work.
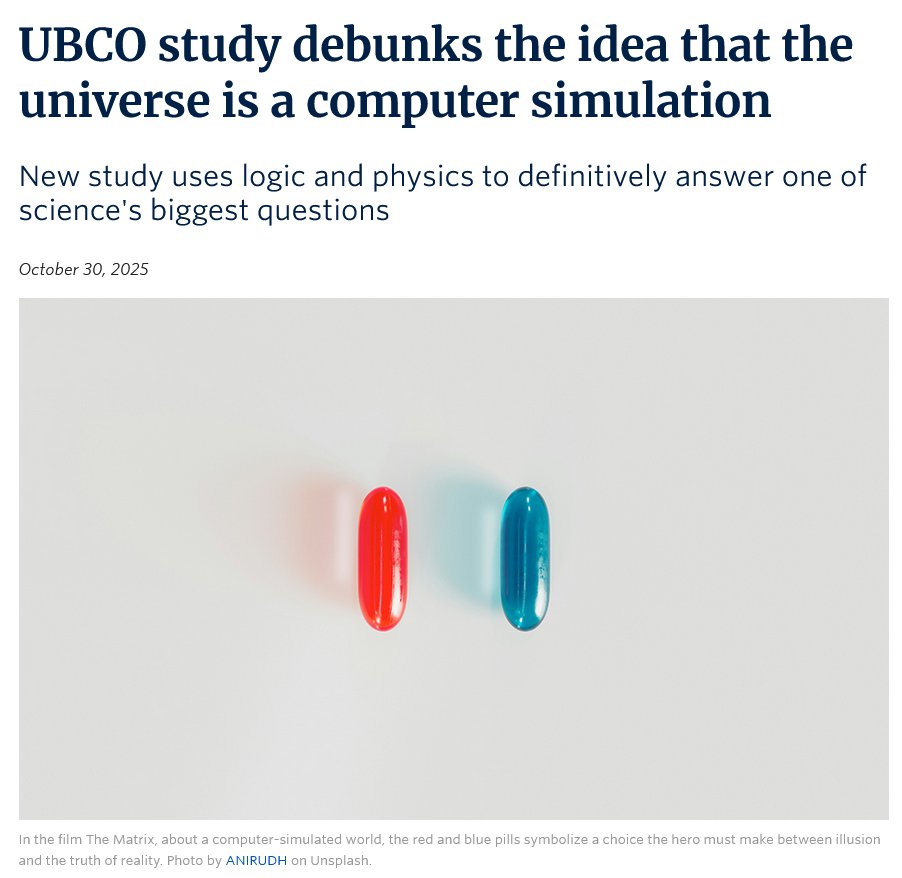
Researchers have mathematically proven that the universe cannot be a computer simulation.
Their paper in the Journal of Holography Applications in Physics shows that reality operates on principles beyond computation.
Using Gödel’s incompleteness theorem, they argue that no algorithmic or computational system can fully describe the universe, because some truths, so called "Gödelian truths" require non algorithmic understanding, a form of reasoning that no computer or simulation can reproduce.
Since all simulations are inherently algorithmic, and the fundamental nature of reality is non algorithmic, the researchers conclude that the universe cannot be, and could never be a simulation.
@Paul_Theway Allô, en parlant de ça et pour allier crypto et gold, j’ai l’impression que j’entends pas mal parler de AU79 ces derniers temps. Un avis là dessus @Paul_Theway ?
Merci !
@SixtUSA Hi, trying to solve the problem with the customers service but they just closed my case « to be fair and consistent » as they said.
I was charged 15$ for a 1.x toll in Colorado while I was in California. Is that fair for me ? Can you help please ?
Merci @AirCanada pour cette expérience de retarder 4 fois un vol pour l’annuler à 00h30 et passer la nuit et la journée dans un aéroport avec 2 enfants. 0 aide et prise en charge. Hôtels complets bien sûr…
@edithlemay Il y a peu de personnes que je suis sur Twitter ou ailleurs qui sont réellement inspirantes. Vous êtes probablement, avec votre famille, une des meilleures avec ce choix. Merci de mettre de la vie dans la vie. Belle aventure à vous !
@francoislegault Où peut-on suivre aussi les actions du gouvernement en faveur du système de santé? Les investissements futurs ? Afin qu’en cas de nouvelle pandémie ça ne se reproduise pas. Merci.
@YoogieW@francoislegault C’est encore mieux, c’est que 99.5% des testés positifs survivent ! Quant aux 95% des vaccins, aucun des design des protocoles de test de phase 3 de Pfizer ou Moderna ou autre n’est capable de répondre aux 2 points d’utilité d’un vaccin !
@Videotron Allô, je souhaite résilier mon internet mais je n’arrive à avoir personne au service client. Avec le rappel automatique, appuyer sur 1 si vous êtes là personne... « Merci. Votre rappel a été annulé. » 🤨