🔎 How Column Cardinality Is Quietly Consuming Your Microsoft Fabric CU
🔗 https://t.co/U9zmvqaFxQ
Get all our tutorials: https://t.co/r60KuwXJBA
#powerbi#datafam#dataviz#dataanalytics
💻 Imputing Nulls With Class wise Median Values in Power Query
🔗 https://t.co/mvkgS17Mye
Get all our tutorials: https://t.co/r60KuwXJBA
#powerbi#datafam#dataviz#dataanalytics
🤑 Power BI Masterclass - Weekend Flash Sale 50% Off
👑 Get lifetime access to all our tutorials
🔗 https://t.co/r60KuwXJBA
#powerbi#datafam#dataviz#dataanalytics
💪 Power BI button slicer as a KPI card on steroids
🔗 https://t.co/HWb5fTANj5
Get all our tutorials: https://t.co/r60KuwXJBA
#PowerBi#DataAnalytics#datafam#dataviz
📊 Building Interactive Flip-Card KPIs in Power BI: The HTML DAX Technique That Makes Static Cards Obsolete
🔗 https://t.co/WqoEZN1DXo
Get all our tutorials: https://t.co/r60KuwXJBA
🔥 Learn how to create Matrix-Chart combinations in Power BI (.pbix included)
🔗 https://t.co/HYPXDHHFG8
Get all our tutorials: https://t.co/r60KuwXJBA
#powerbi#datafam#dataviz
🔎 20 Dashboard KPIs That Leaders Actually Care About
🔗 Friend link: https://t.co/rfHTQCPxdk
Get all our tutorials: https://t.co/r60KuwXJBA
#powerbi#datafam#dataviz
🔥 Power BI June 2026: The Update That Turns Your Semantic Model Into an API for Agents
🔗 LinkedIn: https://t.co/GPZOYQ5cC8
🔗 Medium: https://t.co/pSWhQpBzJf
Get all our Power BI tutorials: https://t.co/r60KuwXJBA
#powerbi#datafam#dataviz#ai
📈 How to Use Predictive Analysis and Modeling in Power BI
🔗 https://t.co/zooO7Orr2w
Get all our tutorials: https://t.co/r60KuwXJBA
#powerbi#datafam#dataviz
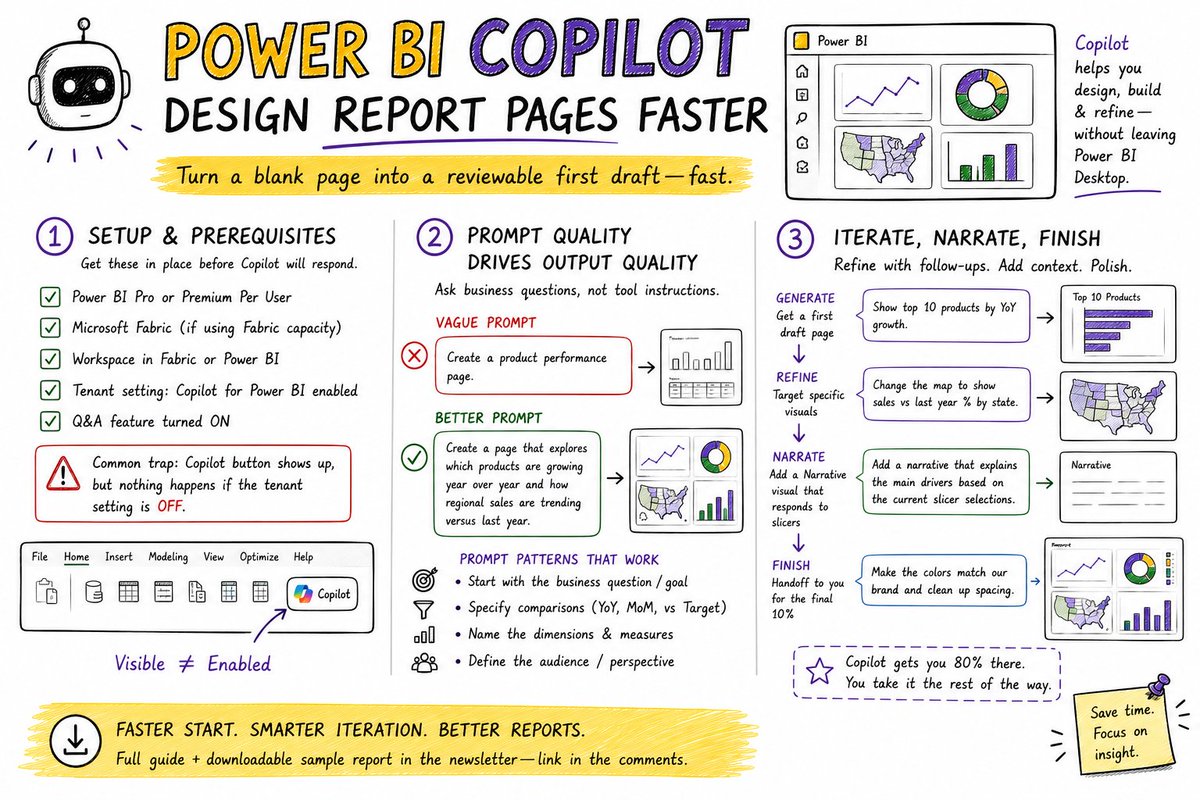
🚀 Power BI AI Toolkit: Build Better Reports Faster with Copilot
🔗 https://t.co/v4Tt7ptTA0
Get all our tutorials: https://t.co/r60KuwXJBA
#powerbi#datafam#dataviz
🔎 Calendar-based time intelligence is powerful — and quietly produces wrong PY numbers in leap years if you're not paying attention.
🔗 https://t.co/YUC3RqMlxe
Get all our tutorials: https://t.co/WvUop0cgpj
#PowerBI#datafam#dataviz
This is one of the best Power BI advanced tutorials I've seen this year!
💪 10 Ways to Instantly Improve Your Power BI Charts with .PBIX included
Get all our tutorials: https://t.co/WvUop0cgpj
#PowerBI#datafam#dataviz
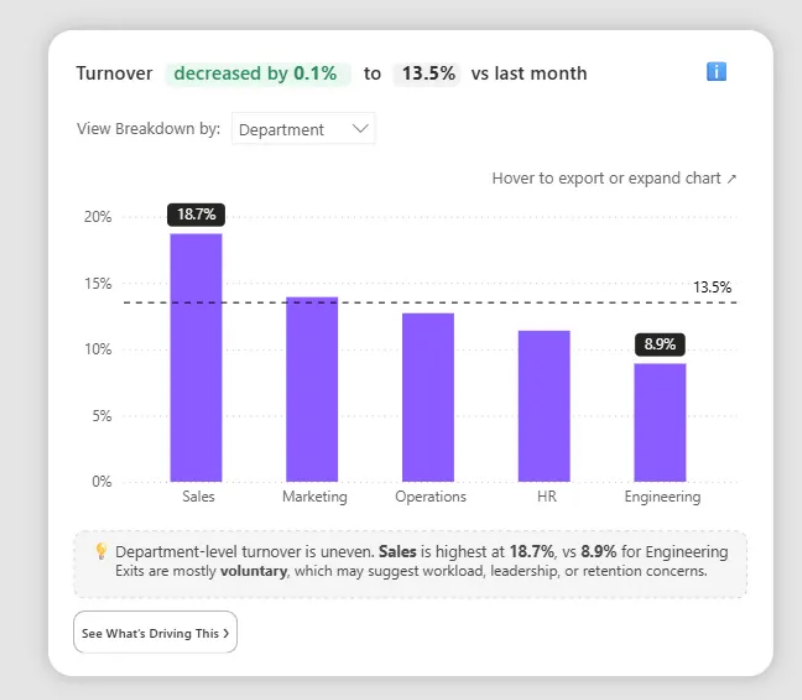
💡 What if your Power BI report behaved like an AI agent — observing context, explaining what matters, and guiding the next click?
🔗 https://t.co/sqvmqDArWh
Get all our tutorials: https://t.co/r60KuwXJBA
@Mboyawor@TechSphereAcad@ezekiel_aleke Nice dashboard, solid foundation.
Drop the all-purple palette. Use color on the graphs to highlight what matters, and keep backgrounds white or light gray. Color should guide the eye, not flood it.
📖 Excel to DAX Translation
Part 1: https://t.co/pJrhtJgATi
Part 2: https://t.co/WdQSLIFI2Q
Part 3: https://t.co/nwJRo7C37F
Part 4: https://t.co/nwJRo7C37F
Get all our Power BI tutorials: https://t.co/WvUop0cgpj
#PowerBI#datafam#dataviz
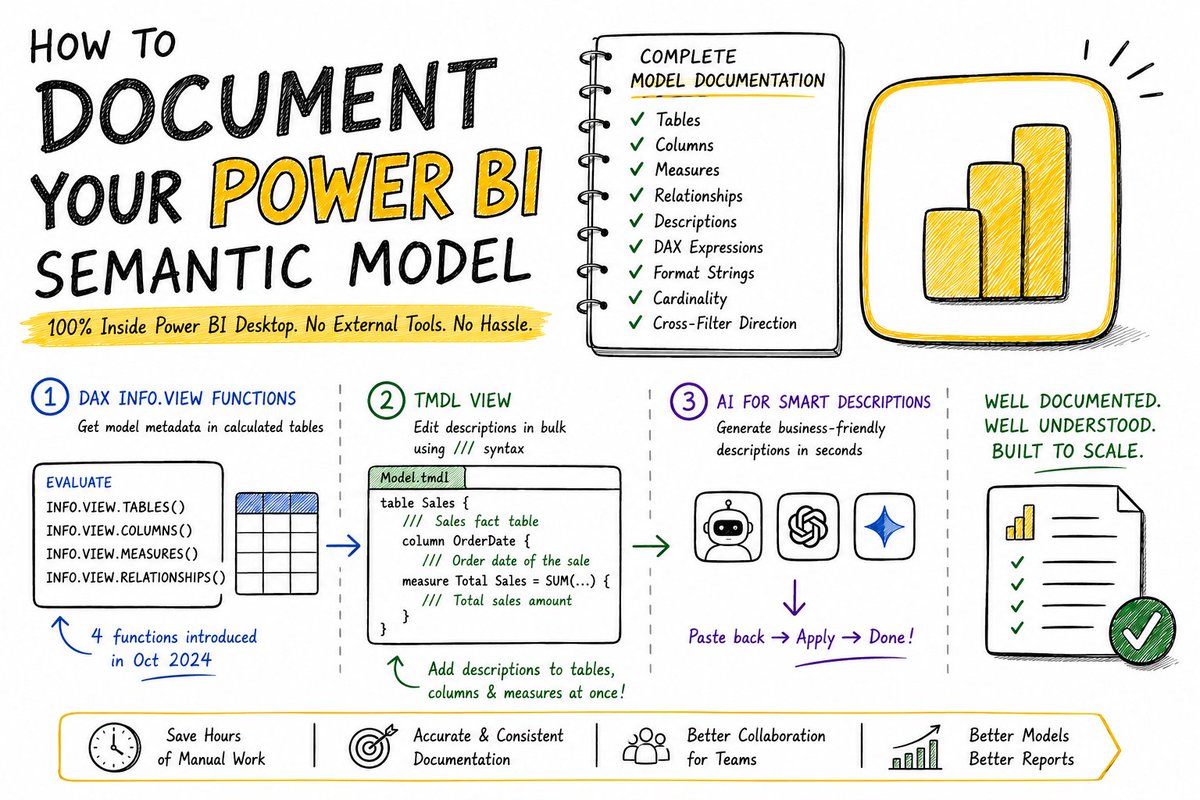
📚 Introduction to data modeling in Power BI by Janvi Gupta
Part 1: https://t.co/rhbd7zc9TJ
Part 2: https://t.co/7xBvVnUTU2
Get all our tutorials: https://t.co/r60KuwXJBA
#powerbi#datafam#dataviz