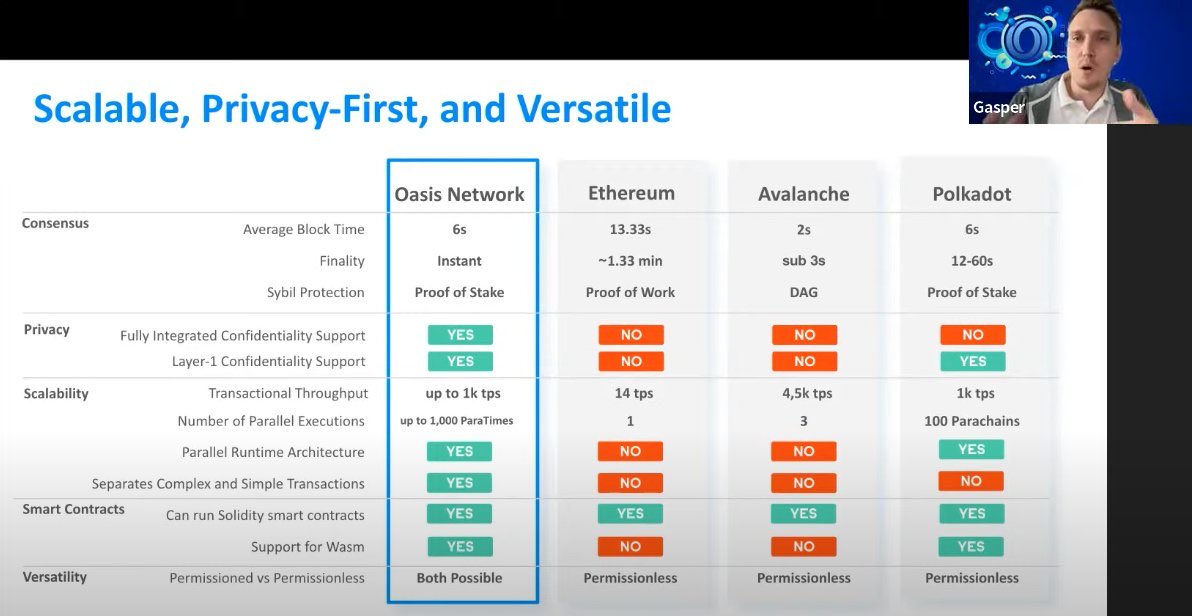
I'm getting asked by a lot of people why I'm betting so much on $ROSE the next run.
Buckle up as we explore why @OasisProtocol isn't just another blockchain, but a game-changer with a bright future ahead! 🧵1/
#Bitcoin - whats next ?
The big Sunday report, all you need to know:
In last weeks sunday report we spoke about the liquidity pool at $29.000 which was perfectly taken out just one day after publishing the Sunday report. We spoke also about the importance of a positive retest at EMA50 daily. However, BTC broke below EMA50 daily and failed to regain since then. Moreover, it got rejected straight 5 days a row trying to regain EMA50 daily, so whats next ?
🚩 TA/ LCA/ Psychological Analysis: Since the beginning of the month, while everyone start to claim and predict wild price predictions I have been telling you that $BTC will instead move into a sideway movement and grab the two liquidity pools in our range. The liquidity pool at $31.700 was perfectly grabbed two weeks ago, the liquidity pool at $29.000 was taken out last week. However, in the big picture there is more liquidity in the downside than in the upside. In addition to that, WMA200 is lost on the daily chart. Closing the weekly chart below WMA200 is a very bad sign for BTC and supports my idea that BTC needs to see a wider correction here. In addition to that BTC lost the key level of EMA50 daily which is currently located at $29.400
For now I have two scenarios in my mind, and both depend on BTC price movement. Let me explain you a bit
Chart 1)
You can clearly see how BTC keeps failing to regain EMA50 daily after breaking below last week. As long there is no daily close above EMA50 you dont even need to watch chart number two, and the price target remains very bearish. Fake pumps that end up with big wicks on daily time frame are possible towards $30.500, grab liquidity and go below. This is scenario is one ouf of two
Chart 2)
Only valid once EMA50 daily is regained on daily chart. To finish the printing of an Head and shoulder pattern and triple top. In addition to that it will grab a mid amount of liquidity in this region before going down
As you can see, we have a total of three different scenarios, while the target remains same. All depends on EMA50 daily for now, as long BTC fails to regain EMA50 daily ($29.400) price action remains very bearish.
I have accumulated a lot of short positions between $31.700 and $30.000 and currently in good profits. If price should really pump as scenario two shows, I will not close my shorts but allow myself to add more into my short position. Prepare yourself for the dump, the big picture points in the downside than in the upside in my opinion.
I will keep my eyes on CZ for the next days and FDUSD stablecoin. I expect a lot of manipulations very soon from the side of CZ and FDUSD stablecoin
🗓️ Important Events Next Week:
Monday: //
Tuesday: ISM Manufacturing PMI
Wednesday: //
Thursday: Unemployment Claims
Friday: Unemployment Rate
End:// thx for reading
I higly recommend you to join the premium membership to have full clarity for all the trades Iam executing. The exact timing, order placing, profit taking etc. is always mentioned in the premium. Remember that one out of 10 trades is shared for free only. The OG content is mostly shared in the premium. Indeed, its the mother of all paid groups with +5800 members
Premium membership: https://t.co/tPUIwfoBxA
Use OBV mainly on DAILY TMF, it is very reliable.
do not use it on the lower TMFs which have many false signals, in fact very many!
and use it mainly with assets that have high volumes, in those with low volumes it gives false signals
that is all there is to know about OBV
hope it is useful to you
this is the reason that made me weak on btc and eth in the last few days
The recession will come & many bears will tell you "I told you so" but not before #SPX makes new ATHs and they've been completely wrong. Not before people start to believe in the "soft landing"
The combination of PA - Run the highs & then run the lows + The 10Y-03MY bond indicator is still the best predictor
When the 10Y-03MY crosses above the 0 line that's when we get the recession and not before
There will not be a soft landing. The difference has never been higher. There will hard landing. Just artificially (centrally) postponed for now
Till then there is a time to make big bucks when the rotation from major stocks begins & #crypto catches up
Then sell, wait for recession, buyback super cheap, and enjoy the next decade of a bull market
It's these three super dumb easy steps to follow that will bring you the riches. Not trading a crab range
1) Hold now till the combination of 10Y-03MY crosses 0 line and stocks make new ATH
2) Sell and be patient till the recession plays off and stocks make new lows
3) Buy & Hold for the next 5-10 years
The Oasis Privacy Layer is live!
Add ✨ Smart Privacy ✨ to any dApp on any EVM chain — dynamic and adjustable for every user’s needs
~ From fully public to fully confidential
~ While preserving the entire UX
~ No cross-chain swaps needed
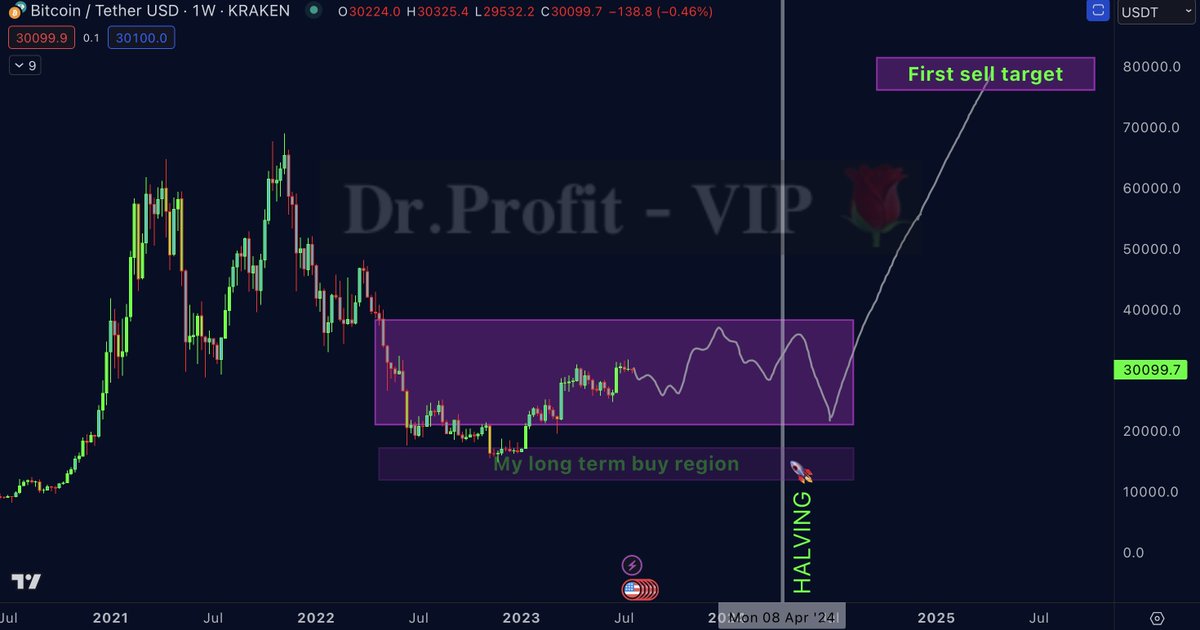
The bullrun comes with halving
Disagree with the idea that a bull run started
For now market is in a huge sideway movement with possible targets between $21.000 - $38.000
Bull run starts three months after halving, my first minimum target is $80.000