No Fedspeak. No CPI. No NFP.
The market heads into the Oct 28 FOMC on data alone, with the 10Y above 5% and Nasdaq already under pressure.
Here's what matters this week and how each asset could react 👇
#Macro#USD#FOMC#Gold#Nasdaq https://t.co/OgxoFe8hka
🇨🇦 Canada CPI (Sep): SOFT across the board
Headline 3.1% vs 3.2% exp
MoM 0.1% vs 0.2%
Trimmed-Mean 1.8% vs 1.9% 🔻 below target
Median 1.9% vs 1.9%
Common 2.4% vs 2.6%
CPIX 2.2% vs 2.4%
5 of 6 measures missed. The only thing lifting the headline is gasoline.
Trimmed-Mean slipping under 2% plus two months of job losses = an Oct 28 BoC hike is now close to off the table. Hold at 2.25% is the base case.
The reaction so far is muted because CAD was already bid into the print:
USDCAD 1.4102 | EURCAD 1.5817 | AUDCAD 0.9847
Correction levels from my preview:
USDCAD 1.4115–1.4125 → 1.4134–1.4139 gap fill
EURCAD 1.5862 → 1.5880–1.5890
CADJPY below 111.88–111.98 → 111.70
Next test: BoC Business Outlook Survey at 11:30 AM ET. Higher inflation expectations there could offset part of the miss.
Not financial advice.
#CAD #CPI #BoC #USDCAD
Canada CPI at 8:30 AM ET 🇨🇦 Headline is expected at 3.2%, but Trimmed-Mean & Median decide if an Oct 28 BoC hike stays alive. CAD is already bid. Hot, in-line & soft scenarios + levels for 5 pairs 👇
#CAD#CPI#BoC#USDCAD#CADJPY#Forex https://t.co/aJWJPnrzzh
Canada CPI at 8:30 AM ET 🇨🇦 Headline is expected at 3.2%, but Trimmed-Mean & Median decide if an Oct 28 BoC hike stays alive. CAD is already bid. Hot, in-line & soft scenarios + levels for 5 pairs 👇
#CAD#CPI#BoC#USDCAD#CADJPY#Forex https://t.co/aJWJPnrzzh
🇨🇦 Canada CPI (Sep) | Today 8:30 AM ET
The last inflation print before the Oct 28 BoC decision.
📊 Expectations
Headline YoY: 3.2% (prior 3.0%)
MoM: 0.2% (prior -0.1%)
Trimmed-Mean: 1.9% (prior 1.9%)
Median: 2.0% (prior 2.0%)
Core YoY: 2.4% (prior 2.4%)
🧭 Context
The BoC has held at 2.25% for seven straight meetings. Canada lost 68K jobs in September, and unemployment rose to 6.5%, the second month of losses in a row. The expected jump in headline inflation comes mostly from energy, with WTI near $97.7.
🔍 The key: the BoC follows Trimmed-Mean and Median, not the headline. Both sit right at the 2% target.
🎯 Scenarios
🟢 Core 2.1%+: underlying inflation is speeding up despite a weak labor market. The odds of a cut fall, and CAD gets support. USDCAD and EURCAD are lower, and CADJPY is higher.
⚪ Core in line: little reaction. The labor market stays the focus, and the BoC most likely holds on Oct 28.
🔴 Core 1.8% or below: disinflation while jobs are being lost. The odds of a cut rise, and CAD weakens. USDCAD and EURCAD are higher, and CADJPY is lower.
⚠️ A hot headline (3.3%+) with in-line core can spark a fast move that reverses. The market reacts to the headline first and to core second.
🛢️ Oil cuts both ways in USDCAD: it supports CAD but also lifts US yields. EURCAD and CADJPY give a cleaner read.
Not financial advice.
#CAD #CPI #BoC #USDCAD #Forex
@FirstSquawk 1.4100 is the line in the sand for USDCAD today.
Hot CPI core (Trimmed/Median 2.1%+) = clean break lower.
Soft core = back to 1.4133.
The headline won't matter. Core is what the BoC reads. Full preview on my profile 👀
@Barchart Yields up + banks down 6 weeks straight.That's the opposite of the textbook. The market isn't pricing better margins, it's pricing losses on bond books.
We've seen this movie before. March 2023.
@unusual_whales Small caps have nowhere to hide: 2Y 4.73%, 30Y 5.41%. No cheap part of the curve to refinance.
If the long end breaks higher, IWM cracks before SPX.
Anyone still long small caps here?
@elerianm@TheEconomist The market treated AI as rate-proof. Last week's ~4.5% Nasdaq drop says otherwise.
This week's mega-cap earnings with the 10Y above 5% is the real stress test.
Do earnings beats still matter if the discount rate keeps rising?
@Barchart Gold at $4,175 with Treasuries paying 5%+.
That shouldn't happen. Unless central banks care more about who holds their reserves than what they yield.
This isn't a trade anymore. It's a regime change.
@zerohedge The scary part isn't the 10Y. It's the 30Y at 5.41% leading the curve.
That's not the Fed. That's the market demanding more to hold US debt, and AI capex runs on debt.
5.5% on the 30Y is where this gets ugly.
@KobeissiLetter Everyone called Black Monday. NQ answered with +1.4%.
But the 10Y is still above 5%. Equities can bounce all they want; bonds haven't agreed yet.
Real bounce or bull trap? I'm watching 29,226.
Meta, Tesla, TXN, Lam, IBM and SAP all report Wednesday after the close.
Full Q3 earnings week breakdown 👇
#Earnings#Nasdaq#META#TSLA#NFLX https://t.co/K2CjeijOC8
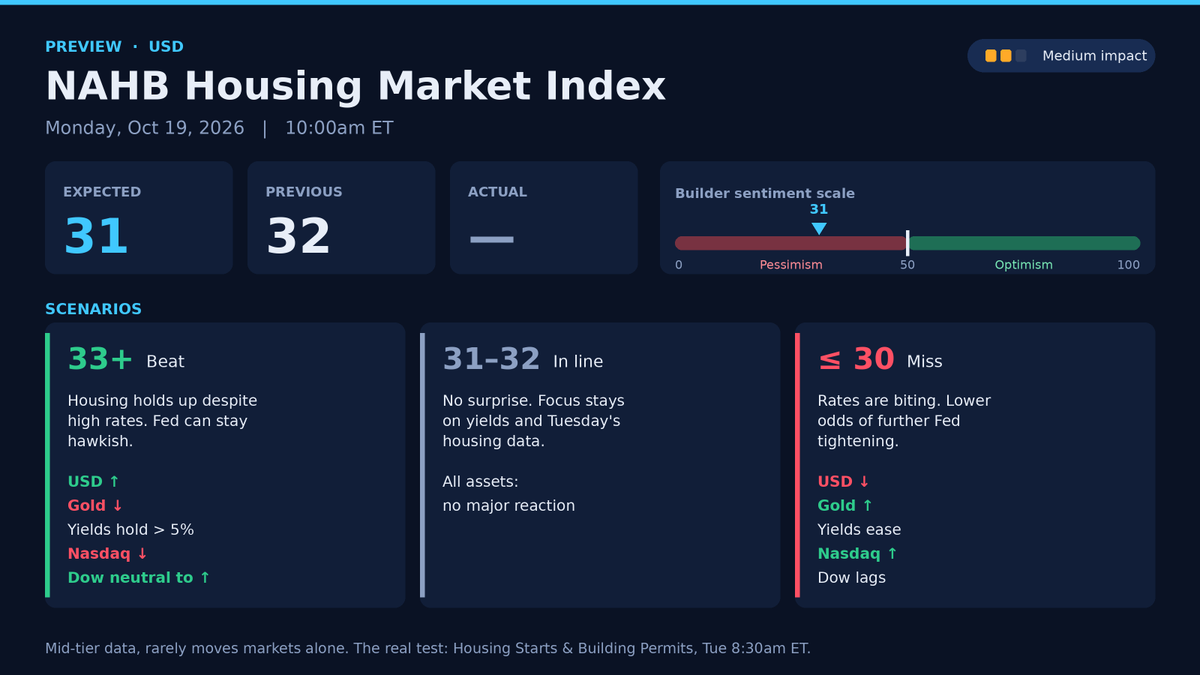
🇺🇸 NAHB Housing Market Index | Preview
📅 Mon, Oct 19 | ⏰ 10:00am ET
Expected: 31 | Previous: 32
🔍 What it measures
Homebuilder sentiment on current sales, the 6-month outlook and buyer traffic. Above 50 = optimism, below 50 = pessimism.
A reading near 31–32 is deeply weak. With the 10Y above 5% and mortgage rates near 7.5%, affordability is crushing buyers.
🎯 Scenarios
33+ (beat)
Housing is holding up despite high rates. Supports the view that the economy is resilient and the Fed can stay hawkish.
USD ↑ | Gold ↓ | Yields hold above 5% | Nasdaq ↓ | Dow neutral to ↑
31–32 (in line)
No surprise. Focus stays on yields and Tuesday's data.
30 or below (miss)
Builders get even more pessimistic. A sign high rates are biting, and it lowers the odds of further Fed tightening.
USD ↓ | Gold ↑ | Yields ease | Nasdaq ↑ | Dow lags on growth fears
📌 Bottom line
NAHB is mid-tier data and rarely moves markets alone. Only a big surprise gets a real reaction. The real housing test comes Tuesday with Housing Starts and Building Permits at 8:30am ET.
#USD #NAHB #Housing #Macro #Trading
Still watching this BTC downside scenario on the weekly chart 📉
Posted this idea 4 days ago on TradingView: Rising Wedge breakdown + potential drop toward ~46k target if it plays out. Current price action around ~83k (down hard lately) keeps the bear case in focus for me.
What do you think—more downside coming or bounce soon? Sharing my rookie observations only! Not financial advice, DYOR
Link to the full chart: [paste your TradingView idea URL here]
#DayTrading #BTC #Crypto #Bitcoin #Stocks"BTC Downside Scenario Still Deserves Attention - #BTCUSDT.P TradingView https://t.co/Z3ae2NQZT0
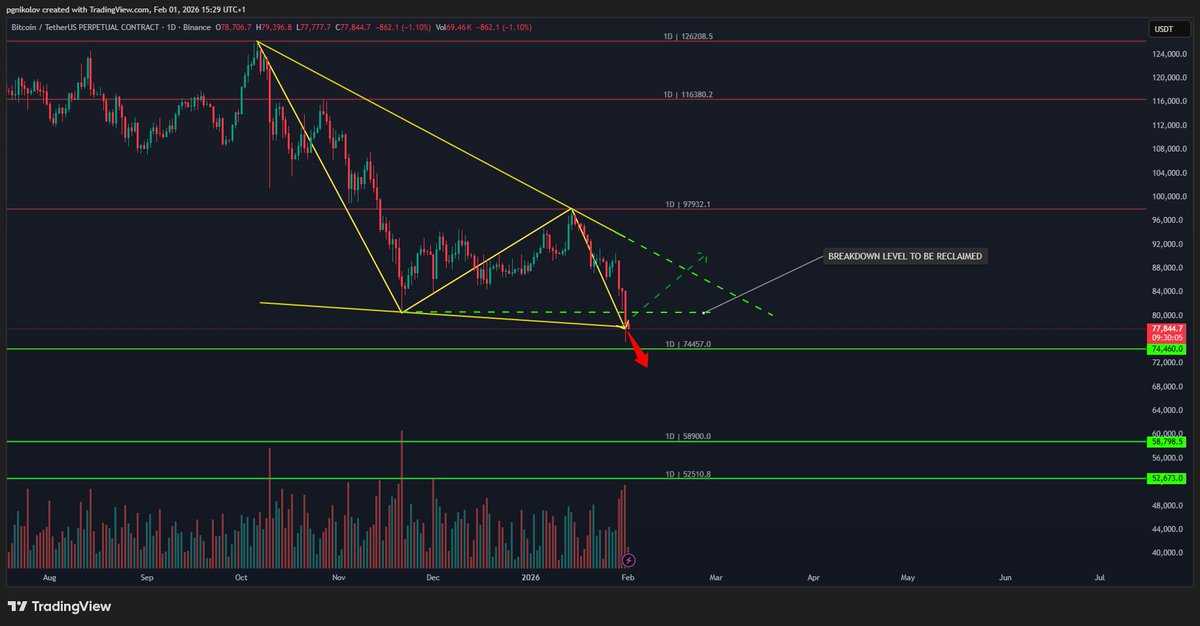
BTC (~78k) at a critical decision point. ⚖️
Price is sitting right on the key breakdown zone (78–79k) after the sharp drop from 84–88k.
Structure still favors continuation lower, but this level matters.
Bearish path (currently favored): 📉
– Daily acceptance below 78–78.5k
– Momentum remains heavy
→ Next supports: 74.4k, then 58.8k (major HTF zone)
Bullish alternative (conditional):📈
– Strong reclaim & hold above 79.5–80k
– Follow-through volume + higher low
→ Opens room for a relief move toward 84–88k
Bottom line: 🔴
78–79k is the line in the sand.
Below = continuation risk.
Above = short-term relief possible.
#Bitcoin #BTC #TechnicalAnalysis #ChartAnalysis #Crypto #SupportAndResistance #KeyLevels #Trading #BTC78K #HigherTimeframe
🔥 US PPI JUST CAME IN HOTTER THAN EXPECTED – December 2025 data dropped!
- Headline MoM: +0.5% (vs +0.2% forecast) 📈
- Core MoM: +0.7% (vs +0.2% est) 🚀
- Core YoY: +3.3% (vs +2.9% est)
Biggest driver? Services prices jumped +0.7%
– stickiest part of inflation refusing to cool.
This kills near-term Fed rate-cut hopes. Yields spiking (2y → ~3.56%), USD stronger, tech futures dipping, financials looking resilient. Buckle up for more volatility into 2026. What do you think – does this push the next cut to Q2 or later? #PPI #Inflation #Fed #Markets #Economy