✨JUST RELEASED✨ 🆕 #PPICsurvey: With the California #election entering its final stretch, we take a look at a number of election-related topics, from the governor's race (@XavierBecerra leads) to views on the state #propositions + more.
Full report ⬇️ https://t.co/xDMIBP6GbC
PPIC's researcher Julien LaFortune spoke with @CapRadioNews to help voters understand what a school bond is, who pays for it, and how the money will be used. He explains how, “a lot of districts have aging facilities.”
Full article 👇 https://t.co/biRB5G8xV4
What do the Californians who are tuned into public discourse and likely to return their ballot want from this Nov. election? In our most recent blog, we sort through recent PPIC surveys to learn which issues matter most to CA's likely voters.
Dive in 👇 https://t.co/Il4gqYjEho
🆕 Is the expansion of transitional kindergarten impacting enrollment in subsidized care? Our findings show a modest impact, though the mix has shifted toward younger children. Learn more ⬇️ https://t.co/re1HByzPqe
🆕 As access to subsidized child care has more than doubled, income levels among participating families have remained low. The majority of families had incomes under 50% of the state median.
Dive into the data in our latest report 👉 https://t.co/re1HByzPqe
🆕 What types of subsidized care are children using? Licensed centers and homes each served over 50K children a month in 2024, while family, friend, and neighbors served ~27K—the largest growth (117%) in avg. monthly enrollment from 2019 to 2024.
More ⬇️ https://t.co/re1HByzPqe
🆕 Did you know that subsidized care programs account for about 40% of CA state child care spending? Between the 2019–20 and 2026–27 state budgets, the capacity of subsidized care increased by 68%.
More on CA early care and education investments ⬇️ https://t.co/re1HByzPqe
🆕 Between 2015 and 2025—while the population of young children declined by 17% in CA—the number of young children enrolled in subsidized child care more than doubled, increasing from approximately 60,000 to 150,000 young children.
Dive into the data 👉 https://t.co/re1HByzPqe
🆕 Are investments in California early care and education reaching the low- and moderate-income families who need it? Our latest report provides new information about families and young children (up to age 5) accessing subsidized care.
Full report 👇 https://t.co/re1HByzPqe
The share of younger voters—age 18 to 34—that say voting is more important for them in this midterm vs past midterms rose to 44% from 32% in Sept. 2022. What's driving younger voters' sense of urgency around voting? Our blog breaks down their priorities 👇 https://t.co/sHT8KtuRMs
🔸ICYMI🔸 Last week's analyses: @PPICWater unpacks the latest developments on Colorado River water agreements, PPIC researcher Iwunze Ugo discusses disparities in math achievements for CA students, plus a breakdown of SoCal's political geography.
More: https://t.co/YrufQBILrG
#FactFriday: Despite a decline in the uninsured rate in CA over the past decade as subsidized healthcare options expanded, about 2.3 million Californians were still uninsured in spring 2025.
Learn more in our health care safety net fact sheet ➡️ https://t.co/5tohGjhiOZ
In a recent @educationweek article, PPIC's Sarah Novicoff discussed a shift in identifying English learners in CA's TK classrooms—from formal assessments to age-appropriate screenings 👇 https://t.co/HJT4fFQ07P
📝 More on English learners in classrooms: https://t.co/nET1K9XES4
🆕 How can California prisons raise participation in available programs? Our new report examines the gaps in assessment, data, and program design that keep people from services and offers solutions to close them.
Full report 👇 https://t.co/EkAelVCfAe
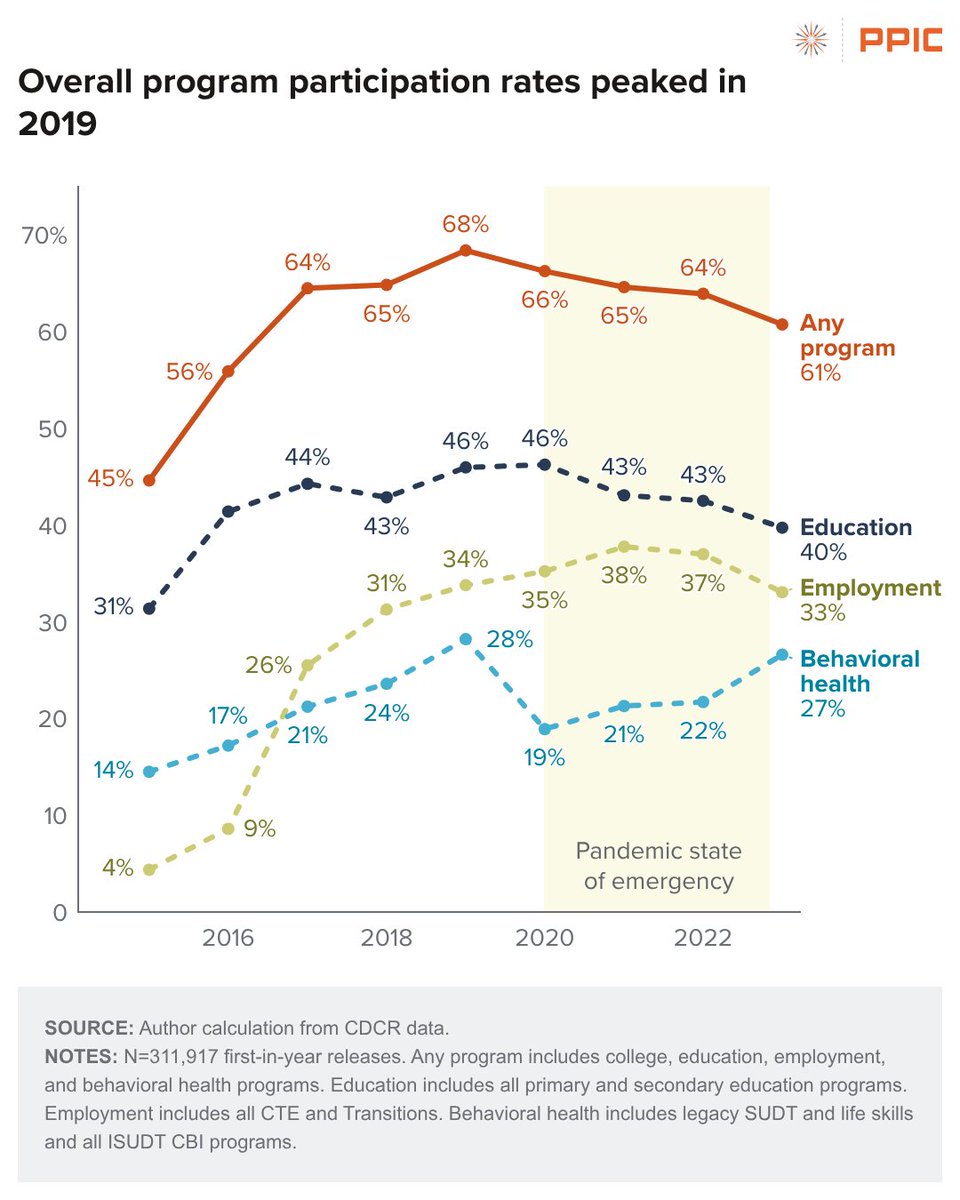
🆕 Why did participation in CA prison programs slump? Longstanding issues, not pandemic adaptations, mattered most. More people served a year or less, lowering rates. Among short stays, those in one facility for 3-9 months participated more.
Full report👇 https://t.co/EkAelVCfAe
🌧️ A potentially record-breaking El Niño is on the way. Are #California’s dams ready? Get the facts on the state’s dams in this @PPICwater fact sheet 👇 #CAwater https://t.co/kcWuoUO63a
🆕 Did participation in CA prison programs recover after COVID? Of people released in 2023, 61% joined at least one education, employment, or behavioral health program, versus 68% in 2019.
Full report 👉 https://t.co/EkAelVCfAe
🆕 How did the pandemic change CA prison programs? 2️⃣ forces reshaped them in 2020: CDCR’s planned changes to rehab programs, especially behavioral health, and #COVID19 outbreaks that forced adaptations. Many of these changes persist today.
Full report👇 https://t.co/EkAelVCfAe
🆕 California’s #prison programs for #education, #employment, and #behavioral#health have been reshaped by the #pandemic. Our new report explains what changed, why participation remains low, and suggests strategies for improving rates.
Full report 👇 https://t.co/EkAelVCfAe
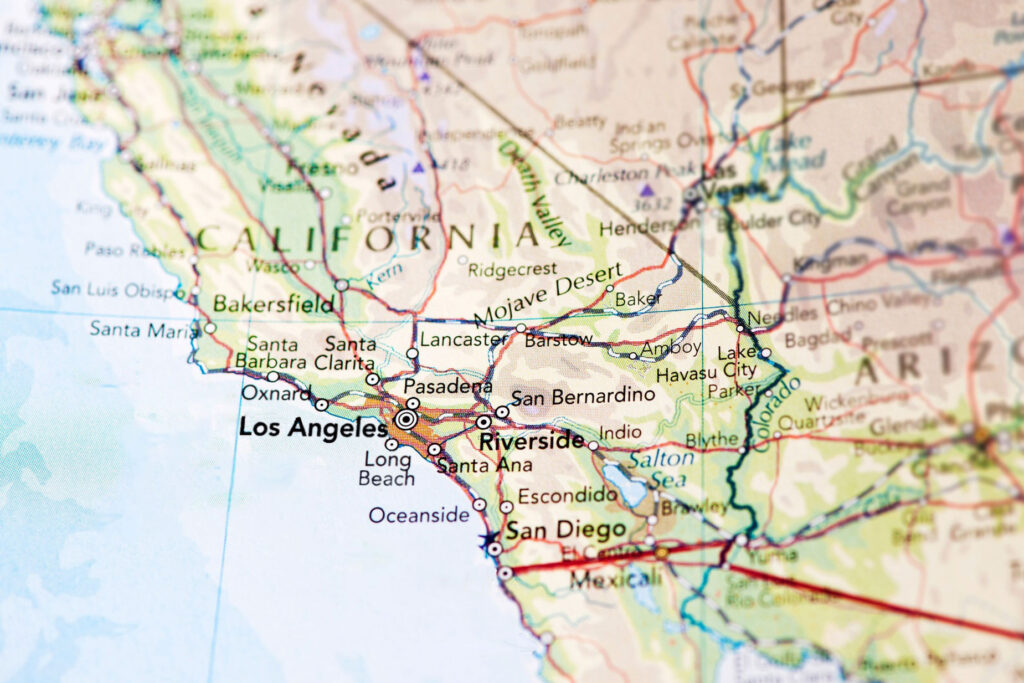
6️⃣ in 🔟 CA’s population are SoCal residents—where does this share of the state stand politically? Today's blog explores this distribution on a range of important topics ahead of the Nov election.
The blog ➡️ https://t.co/R2aXiwMcG7
Full report ➡️ https://t.co/heR3fjiR01
🆕 How has policy supported older workers? Our report examines trends in older Californians' workforce participation, what policies have been implemented so far, and what California can do next to support a growing 65+ workforce 👇 https://t.co/PznvUAQTsO