🚨 #KSE100 Warning Played Out! 📉
Our macro breakdown called this move step-by-step:
• Elliot Waves & demand zones.
• Bearish H&S pattern validated.
Watch the full KSE-100 analysis starting at 01:12 below!
(Link in comment 👇🏻)
#PSX#StockMarketPakistan#DYOR
#MRNS (Weekly Chart)📊
Price is approaching the lower boundary of a multi-year ascending channel near Elliott Wave (E), backed by the 200W SMA (~54.3). Holding this confluence could fuel a move up—otherwise, eyes on the Demand Zone (~46–50) just below.
#PSX#KSE100
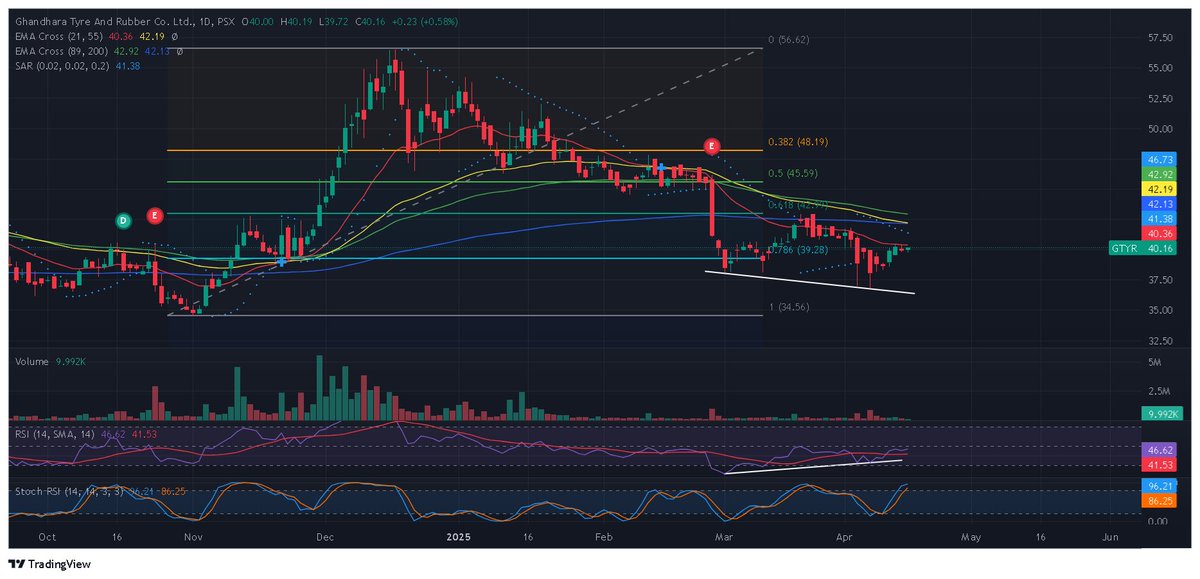
#GTYR Update 🔄
Previous RSI view failed owing to solely relying on RSI, but price just tapped daily bullish OB (~22.2–23.0) & is bouncing.
Another slight dip could print bullish EFI divergence near unmitigated Weekly OB (~20.3–21.5). First upside hurdle: 50 SMA.
#PSX
#SIBL Update 🔄
The retest held & gold cross worked out as well! Price now pushing up, probably towards the Supply Zone first (~12-15), where it's may see rejection, though the long-term ascending channel still calls for much further upside.
#PSX#DYOR#KSE100
#SIBL golden ratio formed on weekly already while its in consolidation for now, once it breakout from that range, it can go for its potential supply zone. #PSX
#SIBL update: Golden cross remains intact. Seems like a probable retest after BO of long-term descending trendline.
Still watching if this retest holds for an upward move towards the upper supply zones.
#PSX#KSE100#DYOR
#SITC (Daily Chart) 📊
Price in downtrend just above a strong Weekly FVG (~520–555).
Early bullish divergences are starting to form on RSI & EFI as selling pressure slows down.
Upside soon or a dip into the FVG first?
#PSX#KSE100#DYOR
#WAHN Update (Weekly):📊
Previously notified to watch for cup & handle retest but it didn't hold, leading to deeper pullback. Now price is lil below 200 SMA with a bullish RSI divergence and Golden Cross still intact. Watch for trendline BO for further upside
#PSX#KSE100#DYOR
#WAHN weekly chart shaping up well — cup & handle breakout followed by a clean retest of the pattern. Watching if it can hold and push higher. #PSX
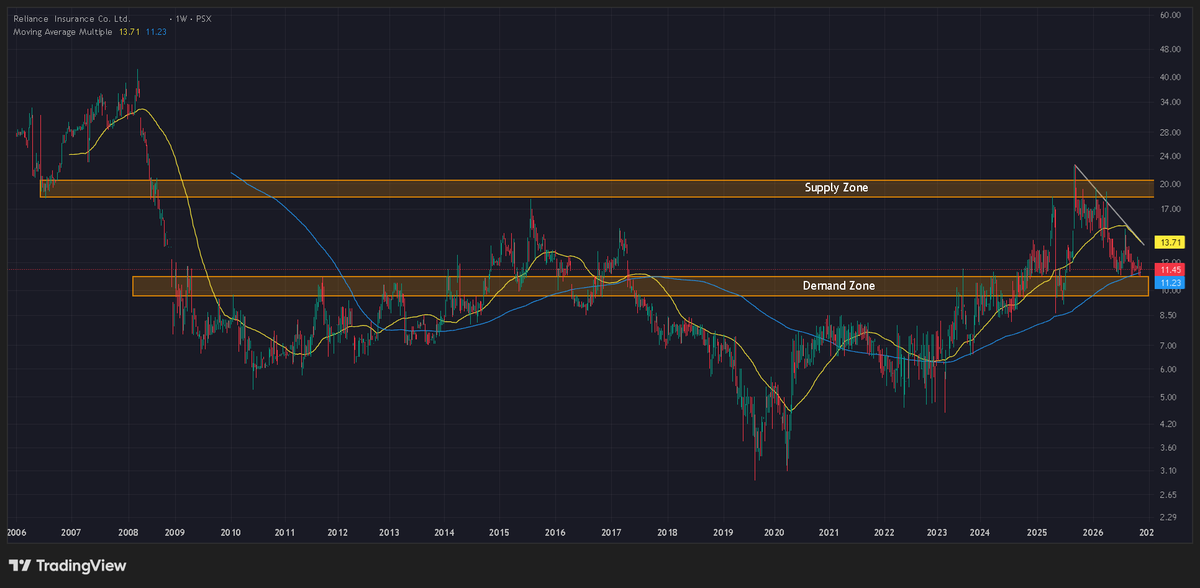
#RICL (Weekly Chart) 📊
Price is pulling back toward strong historical Demand Zone (~09.60-10.90) around 200 SMA after facing rejection at Supply Zone (18.35–20.45) + gold cross intact.
Holding this support could set up next bounce. Watch closely for confirmation.
#PSX#KSE100
🚨 17-STOCK PSX MASTER AUDIT!
We did an honest post-mortem on all 17 mapped scrips:
🔹 Hits & Misses - What worked vs. hit stops
🔹 Structural Invalidation - Risk management in action
🔹 Updated Plans - Forward-looking targets
Full review live!
👇 Link in comments
#PSX#KSE100
📊 PSX Technical Chart Setup
⚙️ #LOADS Top-Down Setup!
• Channel compression & key moving average test.
• EFI divergence forming.
• Two-way play: MA reclaim vs channel base test.
Watch the short for exact price levels & the full plan! 👇
(Link in comments)
#PSX#KSE100#DYOR
#MFL Update:
Bounce played out perfectly to test 200 SMA. Price now pulling back to FVG (39.5-42).
📈 Bulls: Holding FVG can fuel another leg up to trendline/box resistance.
📉 Bears: Losing FVG reopens lower targets.
RSI cooling without any divergence.
#PSX#DYOR
#MFL Daily
Bounce from the lower channel with RSI & MACD turning up. Price holding above the 55 SMA.
Still below the 200 SMA and the falling trendline. Short-term constructive, larger resistance still overhead.
Watching if this bounce can push higher.
#PSX#KSE100#DYOR
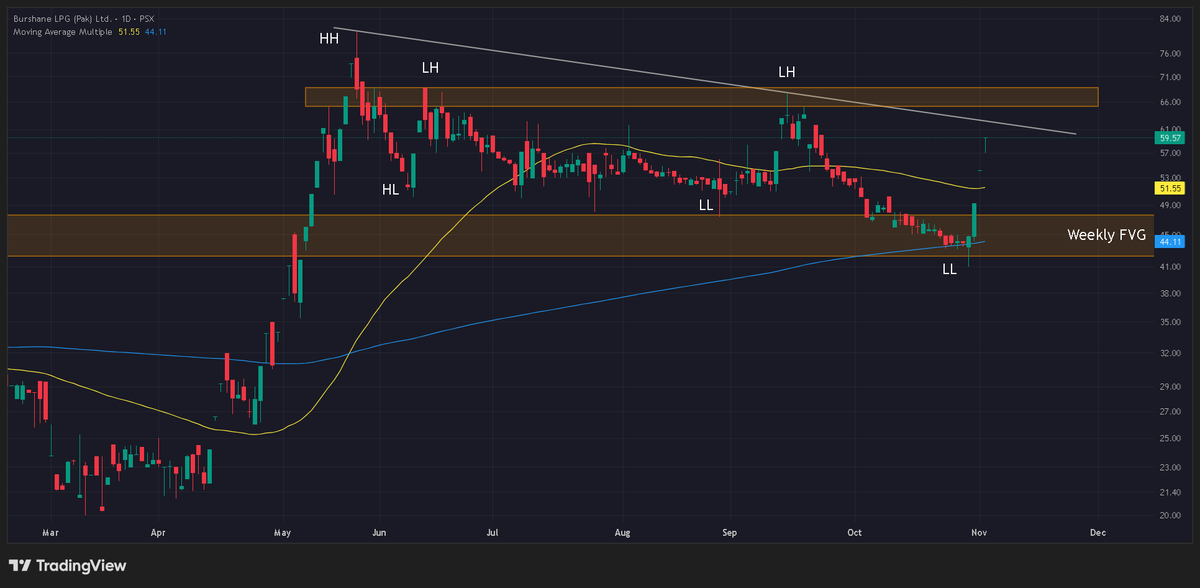
#BPL Update:
Previous HL failed, changing structure with new LL. However, price found support at Weekly FVG & reclaimed 50 SMA.
RSI & EFI show healthy momentum; no divergence. Structure shifting neutral/bullish, making new HH possible. Eyeing marked zones for resistance.
#PSX
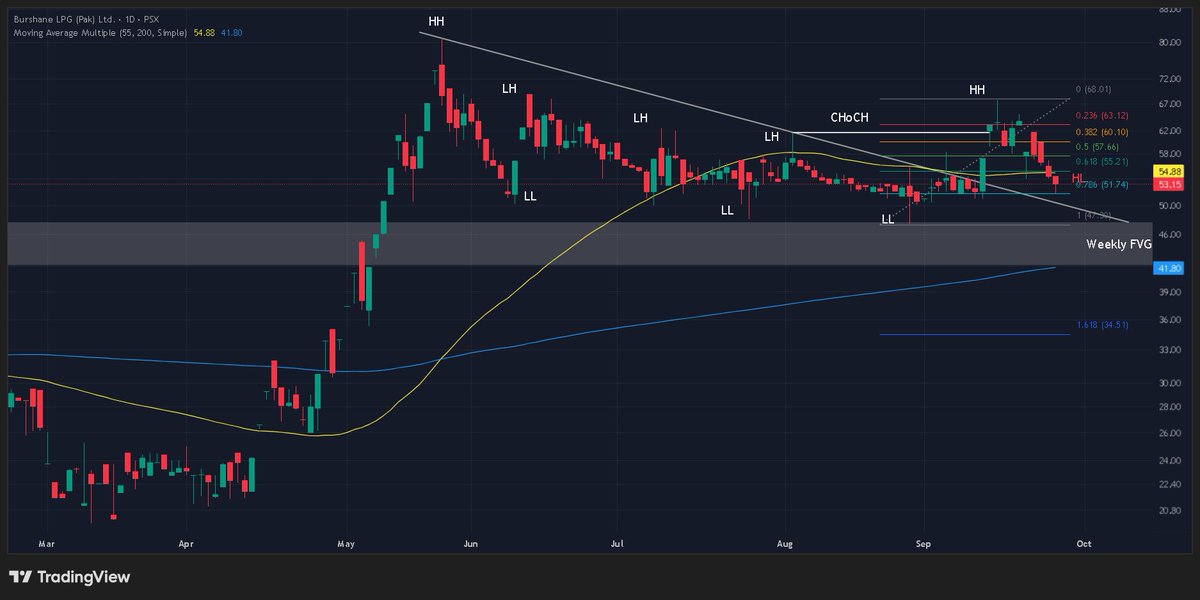
#BPL Daily
Broke descending trendline & made new HH. Now in a pullback.
HL not confirmed yet. Fib levels map current pullback; broken trendline is still the key level to watch for retest.
If the HL holds, CHOCH stays valid but if lose recent lows, the idea weakens.
#PSX#KSE100
#SPSL Update:
After lil upside from previous divergences, price has blown past 4.618 Fib extension level, freely falling. Now, 1H TF shows another clear bullish divergence on both RSI & EFI.
Caution: 1H indicators can be noisy. Reclaiming EMAs is needed for real structure.
#PSX
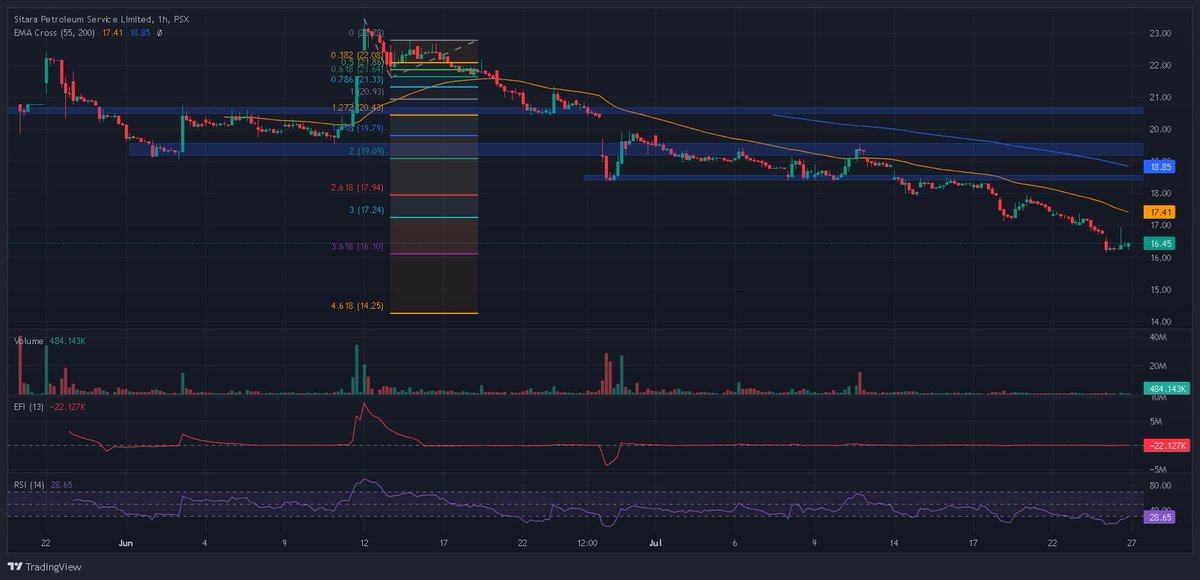
#SPSL 1H: Strong downtrend. Price has extended past the 2.618 Fib and is now near 3.618 zone.
RSI deeply oversold. Volume is drying up. EFI divergence can form if another shakeout low happens.
Possible short-term bounce, but structure remains bearish unless EMAs are reclaimed.