$BTC Cycle’s is broken:
As many of you have noticed, Bitcoin’s returns have been decreasing with each cycle. The first major expansion delivered extraordinary gains, then the next cycle produced roughly half of that, and the pattern has continued.
But few people ask the obvious question: if this trend continues indefinitely, where does it lead?
Following the same rate of decline, cycle returns would eventually shrink from 7x to 3.5x, then 1.7x, then 0.85x, ultimately reaching a point where Bitcoin can no longer produce meaningful expansion. The cycle would effectively be exhausted.
This is why I believe a major reset is necessary.
A deep correction into the $10,500–$6,700 re-accumulation zone would allow the market to rebuild its foundation, reset expectations, remove excess leverage, and create the conditions for a new growth cycle.
Throughout Bitcoin’s history, there has only been one crash of approximately 95%, and I believe a similar reset could be required here. Only after such a reset can Bitcoin potentially repeat the type of explosive move seen during the first major zigzag, which delivered gains of roughly 4,400%. Since being listed on exchanges.
My thesis is simple: without a reset, each cycle continues to weaken. With a reset, Bitcoin has the opportunity to restart the cycle and generate another powerful impulsive expansion.
sui:native
SUI remains under downside pressure, with the market likely still working on a fifth wave lower. The higher timeframe structure continues to allow both a bullish and bearish interpretation.
Leading Scenario: The key support region remains between $0.65 and $0.49. This is the area where the yellow scenario could complete wave B and potentially form a meaningful low. Until then, the trend remains down.
Risk Scenario: The white count remains the more bearish alternative and would become increasingly likely if the market breaks below the support cluster between $0.65 and $0.49. In that case, the correction would likely extend further.
Key Support Levels: $0.65 / $0.49
Bottom Line: SUI is approaching a major support area between $0.65 and $0.49. This remains the key zone to watch, but any bullish case still requires a clear 5-wave advance from support.
Crude Oil 4Hrs looks good so far with RSI bullish divergence and holding the channel bottom, so hoping the expanding diagonal ended. Based on that assumption FIB extension for Y and C of Y projected here. Anyways this is my last hope for oil, lose this then it must have a 5th truncated already.
Bitcoin has likely completed the typical Bear Market B-Wave rally.
In many bear markets, the B-Wave is the phase that convinces people the worst is over. It often produces a strong recovery, improving sentiment, bullish headlines, and renewed confidence. Many participants start believing a new bull market has already begun.
The problem?
B-Waves are usually corrective in nature. They can be powerful, but they often lack the impulsive structure seen at the start of sustainable bull markets.
If the recent rally was indeed a B-Wave, then Bitcoin may now be entering the C-Wave lower. That would represent the final phase of the bear market, a stage often associated with disappointment, fading optimism, and widespread capitulation.
What should traders watch?
- A failure to reclaim key resistance levels
- Corrective rallies rather than clear 5-wave advances
- Increasing bearish momentum after each bounce
- Sentiment shifting from "buy the dip" to frustration and apathy
Ironically, the C-Wave is often where the best long-term opportunities are created.
The crowd tends to be most optimistic near B-Wave highs and most pessimistic near C-Wave lows.
That's why understanding market structure matters more than following sentiment.
$BTC
16 Mayıs 2026'daki Bitcoin Teknik/Zamansal Değerlendirme: https://t.co/eXm7dNvy6O
Platform'da şu an Bitcoin analizlerini sadece üye olarak ücretsiz olarak görebilirsiniz.
Zamansal Değerlendirme;
A dalgası ile C dalgasının hem süre hem de fiyat açısından birbirine oldukça yakın ölçülerde gelişmesi,
ayrıca hareketin yükselen kanal yapısı içerisinde kalmaya devam etmesi; mevcut yükselişin itkisel yükselen bir trendden ziyade düzeltici karakter taşıdığına işaret etmektedir.
Beklenti;
Fiyatın mevcut geçersizlik seviyesinin (82.832$) altında kalmaya devam etmesi halinde, aşağı yönlü baskının derinleşmesi ve aşağı yönlü yeni bir itkisel faz ile birlikte yeni dip (60.000$ altı) riskinin ön planda kalmayı sürdürdüğü değerlendirilmektedir.
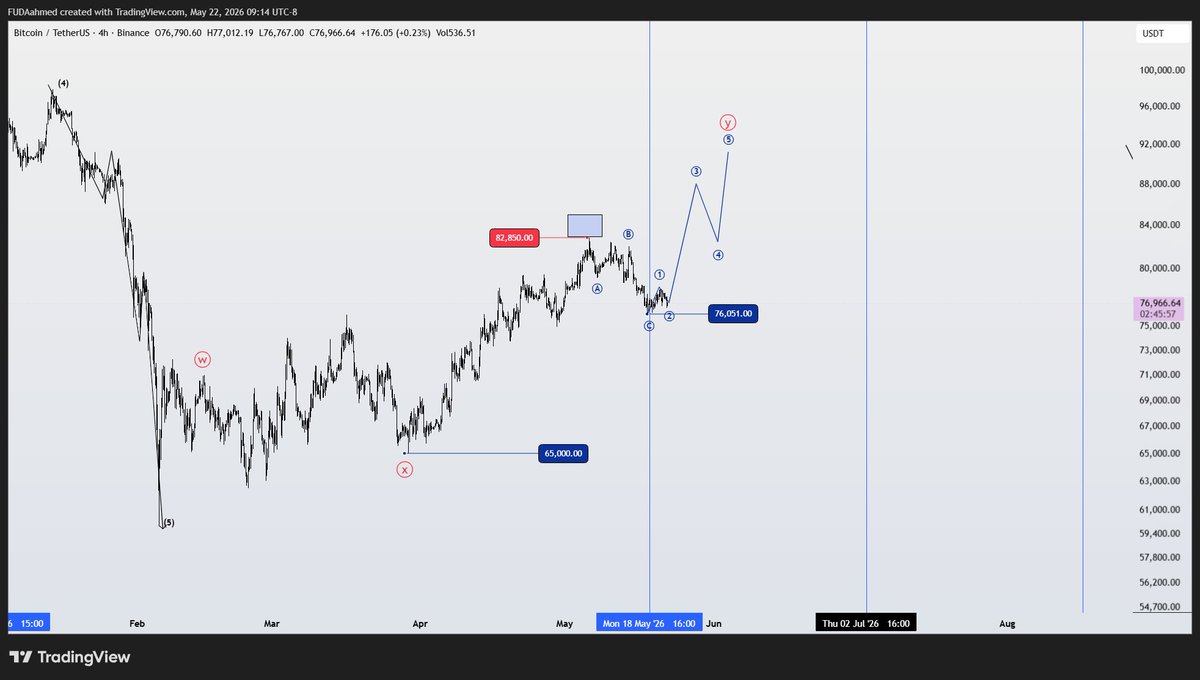
البيتكوين علي فريمات صغيرة لما يخطط؟
تحليل سريع علي فريم صغير مثل ما طلبتم .. كما توقعت تاريخ الانعكاس يوم 18 و سعر 77k يحدث عنده تماسك
لا يوجد سلبية ابدا طالما لم نكسر 65K و نغلق
اما الان لو حدث تماسك اعلي76k اتوقع صعود خماسي هكذا و هيكون الاخير من نوعه ثم كراش عنيف
#btc
While most await #Altseason ,we are printing multiples week after week with one simple strategy: “Good entry+patience=💰”
• $BULLA 1800% (18x)
• $AGT 1000% (10x)
• $HANA 450% (5x)
• $TAKE 270%
• $D , $KOMA , $DAM 250%
• $CLO 165%
• $CGPT , $PORTAL , $BLUAI 100%
• $RAVE 70%
All fully documented on my profile with exact dates & percentage. I do all the work for you, you just need patience & trust.
$BTC Look for these to set up.
LOIs
77608
79559
If the bulls can push us over 77.6 impulsively, completing the impulse down.
I will be looking for a C/3.
#Elliottwave#Crypto
A fresh whale bought 11,000$ worth of $ETHY.
AVG : 2.5M FDV.
The same whale aped $Gitlawb at 5M mcap ( worth of 2600$ and now up to 11,000$ and haven’t sold any token. )
Smart money bidding on $Ethy after announcement about upcoming V2 release.
@AltcoinSensei#gitlawb
First of all, the decline I was expecting didn't happen; wave C didn't form. Wave B formed during the decline, and this rise is forming wave C of the expanded bullish flat. The blue ABC wave count is a expanded bullish flat.
If this rise ends in the red box I'm expecting and a decline begins, another flat might be forming here. The current red box is wave B of the flat; the upcoming decline will be an impulse wave.
#gitlawb
First of all, the decline I was expecting didn't happen; wave C didn't form. Wave B formed during the decline, and this rise is forming wave C of the expanded bullish flat. The blue ABC wave count is a expanded bullish flat.
@TheCryptoKazi If this rise ends in the red box I'm expecting and a decline begins, another flat might be forming here. The current red box is wave B of the flat; the upcoming decline will be an impulse wave.
@TheCryptoKazi#gitlawb
First of all, the decline I was expecting didn't happen; wave C didn't form. Wave B formed during the decline, and this rise is forming wave C of the expanded bullish flat. The blue ABC wave count is a expanded bullish flat.