Different Lenses
Connecting dots across AI, Crypto, Business & Life
Thinking in Public
🚀 Building in Public
💡 Information is abundant. Perspective is scarce.
🚨 PI Network: The Market Is at a Decision Point. Are You Ready?
Not financial advice. Just a data-driven observation. DYOR.
Over the latest higher timeframes, the technical picture looks like this:
📉 Daily trend: Strong Sell
📉 4H trend: Sell
📊 Most major moving averages still point downward.
Yet the story doesn’t end there.
While the broader trend remains bearish, momentum indicators are beginning to hint at the possibility of a short-term relief bounce. That’s exactly what makes this an interesting market to watch.
Key levels many traders are monitoring:
🟢 Support:
• 0.0745
• 0.0732
🔴 Resistance:
• 0.0770
The next move could be decided by how price reacts around these zones.
A rejection at resistance may strengthen the bearish case.
A convincing breakout with volume could shift short-term sentiment and force many traders to rethink their bias.
The biggest mistake isn’t being bullish or bearish.
It’s trading without a plan.
✅ Know your entry.
✅ Know your exit.
✅ Respect your stop-loss.
✅ Manage your risk.
Whether you’re a bull or a bear, remember:
The market doesn’t pay for opinions.
It pays for discipline.
DYOR. Manage risk. Stay objective. The chart decides—not emotions.
Join me:/ Pi is a new digital currency developed by Stanford PhDs, with over 55 million members worldwide. To claim your Pi, follow this link https://t.co/mK1gLUrNQw and use my username (dbazzaz) as your invitation code.
#PiNetwork #PI #Crypto #Trading #TechnicalAnalysis #RiskManagement #DYOR
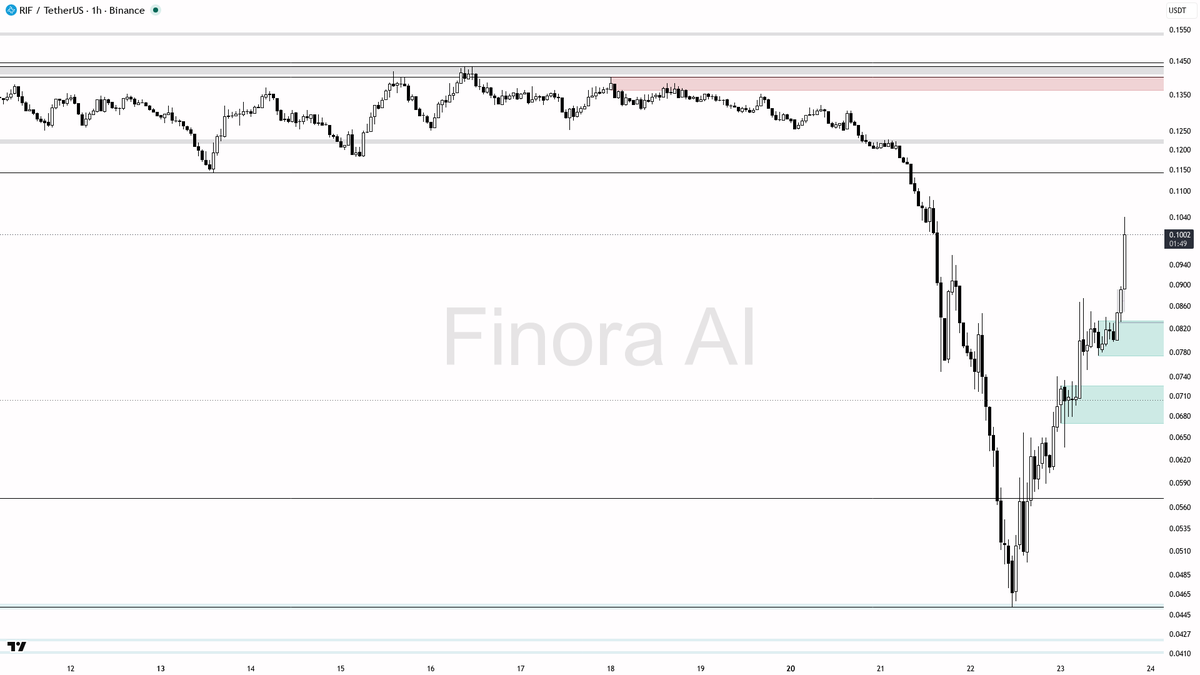
RIF Price Analysis: Can Bulls Extend the Rally or Is a Pullback Due? RIFUSDT #RIF#Rifusdt $rif $rifusdt
Rootstock Infrastructure Framework (RIF) has entered a technically important zone after delivering a strong recovery from its recent lows. While bullish momentum remains intact on higher timeframes, traders should avoid assuming that every green candle guarantees continuation. The next move will largely depend on whether buyers can defend key support levels during any short-term correction.
Market Structure
The current market structure remains bullish as long as RIF continues printing higher highs and higher lows.
The immediate resistance zone lies around $0.1144, which represents the first major profit-taking area. If buying pressure remains strong and volume expands, price could attempt to reach $0.1182, followed by the psychologically important $0.1320 region. A sustained breakout above that level could expose $0.1435, where sellers are likely to become significantly more active.
However, every strong trend eventually experiences retracements. Healthy pullbacks are often necessary before the next impulsive move.
Optimal Long Strategy
Instead of chasing green candles, professional traders generally wait for price to revisit support.
The preferred accumulation zones remain:
$0.0915 – Primary support
$0.0875 – Stronger structural support
Long entries become significantly more attractive only if these levels produce clear bullish confirmation such as:
Bullish engulfing candle
Hammer or pin bar rejection
Strong buying volume
Lower-timeframe higher-low formation
Buying into resistance without confirmation increases the probability of being caught in a liquidity sweep.
Profit-Taking Strategy
Rather than exiting the full position at one price, scaling out reduces emotional decision-making.
Suggested approach:
First partial profit near $0.1144
Second partial near $0.1182
Hold a runner toward $0.1320
Final target around $0.1435 if momentum accelerates
This approach locks in gains while allowing participation if the trend extends further.
Risk Management
The bullish outlook remains valid only while the market structure is preserved.
A decisive close below $0.0875 would invalidate the current bullish thesis and indicate weakening demand.
If that occurs, downside targets may shift toward:
$0.0851
$0.0747
Stops should generally be placed below the most recent swing low or below the structural support zone—not directly at the entry price—to reduce the likelihood of being stopped out by normal volatility.
Technical Outlook
Several factors currently support the broader bullish case:
Higher-high, higher-low market structure
Strong trend characteristics on higher timeframes
Momentum remains constructive while key support holds
However, traders should also monitor:
Volume confirmation during breakouts
Bitcoin’s overall market direction
Rejection candles near resistance
Failure to hold above previous breakout levels
Without increased volume, breakouts above resistance carry a higher risk of becoming false breakouts. Recent technical summaries also show that lower timeframes can diverge from the stronger daily trend, reinforcing the importance of waiting for confirmation rather than assuming continuation.
Final Assessment
The overall bias remains cautiously bullish, provided RIF holds above $0.0875. The upside roadmap toward $0.1144, $0.1182, $0.1320, and potentially $0.1435 is technically plausible, but these should be viewed as potential targets rather than guarantees. The highest-probability trades are likely to come from disciplined entries on pullbacks with confirmed buying interest, rather than buying after an extended rally.
This analysis is for educational purposes only and should not be considered financial or investment advice.
hey! let me break down $RIF #RIFUSDT on the 1h for you real quick 🚀
- price will likely RISE in the short term, long bias remains strong as momentum and all indicators are bullish
- expecting price to target 0.1144 first, then 0.1182, 0.1320, and potentially 0.1435 if momentum continues
- ideal long entries are on a retest of 0.0915 or 0.0875 with bullish reversal confirmation (like a pin bar, bullish engulfing, or strong LTF bounce)
- take profit levels: partial at 0.1144, more at 0.1182, and final at 0.1320 or 0.1435
- place stops below the most recent swing low for safety (not at entry)
- bias flips to short only if price breaks and closes below 0.0875 and loses bullish structure—then expect a move toward 0.0851 or even 0.0747
- not investment advice, educational report only
📊 Need more detailed analysis, trade signals?
Try Finora AI Telegram Bot for free - https://t.co/mrBf74bAVC
@guldefteri These cables are connections for anti-static wristbands. They protect electronic circuits by transferring static electricity to the ground; they are not for performance measurement.
🚀 Pi Network: Testnet 1 đã chạy Protocol V26!
✳️Mặc dù Pi Core Team chưa công bố lịch triển khai chính thức cho V26 trên Mainnet, nhưng Testnet 1 hiện đã hoạt động với Protocol Version 26, cho thấy quá trình thử nghiệm đang diễn ra.
📌 Điều này phản ánh quy trình nâng cấp quen thuộc của Pi Network:
✅ Testnet 1 thử nghiệm trước.
➡️ Sau khi quá trình kiểm thử ổn định và hoàn tất, phiên bản mới sẽ được triển khai sang Testnet 2.
➡️ Cuối cùng mới xem xét áp dụng cho Mainnet khi đáp ứng các yêu cầu về ổn định và bảo mật.
🆘Việc triển khai theo từng giai đoạn giúp Pi Core Team phát hiện và xử lý lỗi trước khi nâng cấp trên toàn mạng, giảm thiểu rủi ro đối với các Node và hệ sinh thái.
⚠️ Hiện tại, chưa có thông báo chính thức về thời điểm Testnet 2 hoặc Mainnet sẽ chuyển sang V26, vì vậy cộng đồng nên theo dõi các kênh chính thức của Pi Network và tránh coi đây là lịch nâng cấp đã được xác nhận.
👉Rất có thể sau V26 ,có nhiều tin vui cho các Pioneer
📌Hashtag
#PiNetwork #PiNode #ProtocolV26 #Testnet #Blockchain #Mainnet #PiCoreTeam #CryptoInvesting
The Trade Wasn’t the Sign. The Numbers Were.
I don’t make financial decisions based on numerology.
But sometimes a sequence of events makes you stop and ask a question.
This was one of those moments.
I recently decided to buy TUFT Token. Before placing the order, I asked for a numerology-based amount instead of choosing a random figure.
The answer came back:
$92.
Not $90.
Not $95.
Exactly $92.
So I executed the plan.
To do that, I withdrew $100, intentionally leaving $8 idle. My only objective was simple:
Withdraw: $100
Keep aside: $8
Buy TUFT: $92
The trade was completed.
Then came something I wasn’t expecting.
The Part That Made Me Curious
After selling the position, I checked my Pi Wallet.
My available balance showed:
2,091.54 Pi
Out of curiosity, I reduced the digits numerologically.
2 + 0 + 9 + 1 + 5 + 4 = 21
2 + 1 = 3
Then I calculated my own Life Path Number from my DOB:
02 August 1991
0 + 2 + 0 + 8 + 1 + 9 + 9 + 1 = 30
3 + 0 = 3
My Life Path Number was 3.
My available Pi balance also reduced to 3.
That alignment wasn’t planned.
Then I Looked Back at the Trade
The recommendation was $92.
Numerologically:
9 + 2 = 11
1 + 1 = 2
In many numerology traditions, 11 is considered a Master Number representing intuition, while the reduced 2 is often associated with balance, partnership, and thoughtful decisions.
Interestingly, the recommendation wasn’t asking me to go “all in.”
It naturally created a balanced allocation:
$92 invested
$8 intentionally left untouched
Not maximum exposure.
Not emotional trading.
Just measured participation.
What About the Sell?
This was the question that fascinated me.
If numerology supposedly guided the buy…
…what happens when you sell?
The sell wasn’t the opposite of the buy.
It was the completion of the cycle.
The numbers didn’t disappear because the position closed.
Instead, after the transaction was complete, my wallet displayed a balance that reduced to my own Life Path Number:
3.
Almost as if the cycle had returned to where it belonged.
Whether that’s coincidence or something deeper is for each person to decide.
My Takeaway
I’m not claiming numerology predicts markets.
Markets move because of liquidity, supply, demand, news, and human psychology.
But sometimes numbers create moments that make you pause.
This wasn’t about making money.
It wasn’t about proving a theory.
It was about observing a pattern.
A recommendation of $92.
A deliberate $100 withdrawal.
An intentional $8 left idle.
A completed trade.
And finally…
A Pi wallet balance reducing perfectly to my Life Path Number:
3.
Maybe it means nothing.
Maybe it’s just probability.
Or maybe, every once in a while, numbers have a way of reminding us that not every decision is purely mathematical.
Sometimes, they’re simply… beautifully aligned.
What would you call it—coincidence, psychology, or synchronicity?
🚀 Mainnet Protocol Successfully Upgraded to V25 ✅
A good step forward for #PiNetwork . 👏
However, the blockchain world doesn't wait. Stellar is already advancing toward V27 while Pi has just reached V25.
@PiCoreTeam should accelerate protocol upgrade deployments, ecosystem development, and the launch of full-fledged products to stay competitive.
Faster execution = Stronger network. ⚡
#PiNetwork $PI
Pi is a new digital currency developed by Stanford PhDs, with over 55 million members worldwide. To claim your Pi, follow this link https://t.co/2rN09ZERDA and use my username (dbazzaz) as your invitation code.
Pi Network’s Biggest Upgrade of 2026 Is Here — Will Protocol v25 Finally Push Pi Above $0.10?
The Pi Network ecosystem has reached another important milestone.
On July 22, 2026, Protocol v25 officially went live, introducing what many consider the network’s most significant technical upgrade of the year. While price action remains cautious, the technology continues moving forward—something long-term supporters have been waiting to see.
What Protocol v25 Brings
The latest upgrade isn’t just another routine update. It focuses on strengthening the foundation of the Pi ecosystem by introducing:
Faster and more stable network performance
Improved transaction processing
Privacy-preserving smart contract infrastructure
Better developer tools
A foundation for future decentralized exchange (DEX) functionality
Expanded open-source development capabilities
These improvements are designed to make Pi Network more scalable and attractive for developers building real-world applications.
Technology alone doesn’t guarantee higher prices, but strong infrastructure is often a prerequisite for long-term ecosystem growth.
Price Action: Signs of Recovery
Pi has quietly staged an impressive recovery after falling to an all-time low near $0.0707 on July 14.
Since then:
Pi has recovered nearly 29% from its low.
It has gained more than 7% over the past week.
The price is currently holding above the crucial $0.09 support zone.
This suggests buyers are gradually returning after weeks of heavy selling pressure.
Technical Outlook
On the 4-hour timeframe:
RSI around 51 indicates a neutral market with no clear dominance from buyers or sellers.
MACD remains bearish, suggesting short-term momentum has weakened after rejection near $0.10.
The $0.09 level has become the most important support.
Bullish Scenario
If Pi continues defending $0.09, buyers may attempt another move toward:
$0.10 (psychological resistance)
$0.12 if the breakout gains momentum
Bearish Scenario
If Pi loses $0.09, the next major support sits around:
$0.08
That level will likely determine whether the recent recovery continues or pauses.
Growing Ecosystem Recognition
Another encouraging development is Pi Network’s appearance in the OSL Stablecoin Partner Ecosystem, where it was listed alongside established blockchain ecosystems such as Solana, Polygon, Stellar, Tron, TON, and Avalanche.
While this doesn’t confirm immediate integrations, it highlights that Pi is increasingly being recognized within broader blockchain infrastructure discussions.
The Macro Environment Matters
Pi isn’t moving in isolation.
The broader cryptocurrency market has also shown signs of recovery, supported by improving investor sentiment and ongoing discussions around U.S. crypto regulation, particularly the proposed CLARITY Act.
Positive regulatory developments often improve confidence across the entire crypto market, benefiting emerging ecosystems like Pi as well.
Perspective
One thing remains clear:
Price creates headlines. Technology builds ecosystems.
Protocol v25 demonstrates that Pi Network continues investing in its infrastructure even while prices remain far below previous highs. Whether this upgrade translates into sustained adoption, stronger liquidity, and future demand will depend on developer activity, ecosystem growth, and continued execution—not just market speculation.
For now, $0.09 remains the battlefield.
Hold above it, and $0.10–$0.12 becomes a realistic short-term target.
Lose it, and the market could revisit $0.08 before finding stronger support.
As always, the market rewards patience more often than emotion. Watch the charts, follow the ecosystem’s progress, and remember to DYOR (Do Your Own Research) before making any investment decisions.
🚨 JUST IN: Pi Network has staged a splendid recovery!
1 $PI is now trading above $0.10, reclaiming this key psychological level after a strong rebound.
#PiNetwork#USA#crypto