Trading expansions is the simplest play in this market. And almost nobody trades it properly.
I've been running the exact same model on Gold and NQ for the past 5 years with more than 90% hit rate.
Here's a Full breakdown 🧵👇
1/7
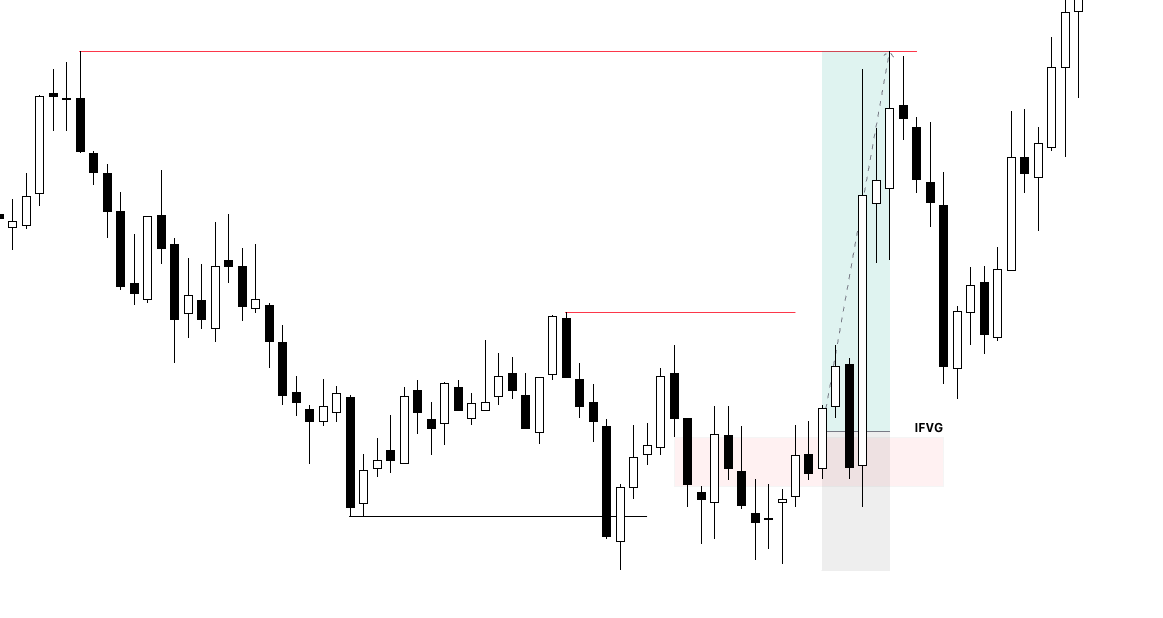
My secret trick on how to choose the perfect IFVG to enter from.
One of the most detailed and time put educational pieces I've ever made.
Must read thread 🧵👇
Up to 80% win rate when you read this correctly.
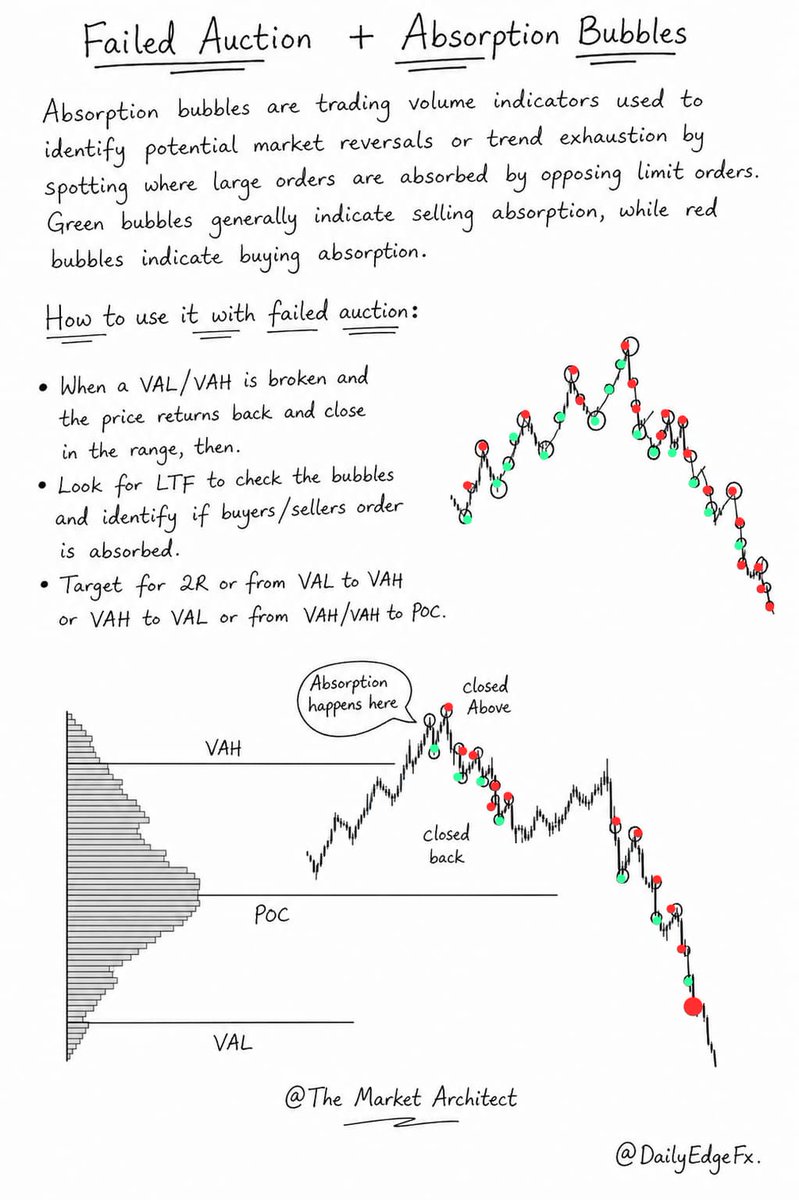
Most traders see rejection, few understand failed auction.
And even fewer combine it with volume absorption bubbles.
This chart shows how: Failed Auction + Volume Absorption = High-reward entries
You’ll learn to spot:
• Where price fails to continue higher/lower
• Where aggressive orders get absorbed
• The exact point momentum shifts
• Why this often leads to sharp reversals
This is not a random setup.
It’s reading exhaustion and participation together.
Study this image closely. A video will follow.
My most basic yet most effective discovery in these markets.
Using Support and Resistance to spot exactly where retail places their SLs. Pinpointing real liquidity points.
Here's the logic.
Retail sells the resistance. Retail buys the support.
Then they look for a place to put their SL.
The zone they pick has to feel two things: Safe and rewarding.
Rewarding - low risk, high profit. Classic human behavior.
Safe - a zone that "should" hold price. Swing points feel safe. They're also shiny, so the brain picks them automatically.
So we know retail wants the closest safe zone with the most reward.
That gives us:
First swing low below support = SSL.
First swing high above resistance = BSL.
First = rewarding. Swing = safe.
Try it.
You'll never look at a chart the same way.
Many traders have been asking me to explain Auction Market Theory and how Volume Profile actually works in practical trading.
Instead of giving a rushed explanation in tweets, I decided to post a proper 15-minute video where Cammy break it down clearly both the theory and how to apply it on your charts.
In this video, you’ll understand what value really means, how price seeks acceptance, why rejection happens, and how Volume Profile helps you see where real business is taking place.
If you’ve been confused about VAH, VAL, POC, or how to use them for entries and targets, this will make it much clearer.
I also recommend you watch more videos from Cammy Capital’s channel if you truly want to go deeper into this concept, because understanding this changes how you read the market completely.
🎥 Full video attached.
Time vs Volume
Time shows where markets were most comfortable but volume shows where committed participation occurred (actual size stepping in and real quantity of orders transacted).
By comparing TPO and Volume profile, whenever a divergence occurs, it's a strong confluence for one-sided price action.
Single prints & Inefficiencies
These are areas where the market moved too fast and leaves behind thin structure with little to no two-sided trade.
The lack of agreement creates a single print on a TPO profile. As the market favours efficient movement, you can anticipate this inefficiency to get filled in the future.
Two POCs. One chart. One trade.
TPO POC tells you where the market spent the most time.
Volume POC tells you where the most contracts actually traded.
Most of the time they sit close together. Balance found. No edge.
But when they diverge, when time and volume disagree on where value is price has a job to do.
It moves toward the untested POC until the discrepancy is resolved.
Free TPO is live on SP500 inside MMT.
Find those discrepancies.
I wrote a 214 page guide on my Reversal Trading Strategy
Then I recorded a 10min video to explain it
02:45 - Good/Bad Conditions for Trading Reversals
04:34 - Entry/Stop/Target rules
05:36 - 25 Good/Bad Trade Examples
If you want it, click the link in my bio
(yes, it's free)
You've been picking PD arrays wrong your entire trading career.
I didn't realize it either until I found this one rule. It completely changed how I execute.
Part 2 of the road to a mechanical model is out.
Watch Here: https://t.co/aW3nnVlnmc
Execution = Footprint
There were a couple of signals that hinted reversal but usually a close below heavy bid/ask cluster that initiated the drive is a good mechanical strategy.
I could run charts for hours showing how this game is played.
Mark a support zone and the swing low below it. Wait for it to be taken. Make it your target.
Mark a resistance zone and the swing high above it. Wait for it to be taken. Make it your next target.
HOURS. DAYS. WEEKS. MONTHS. YEARS.
It happens every single time. And you still ignore it.
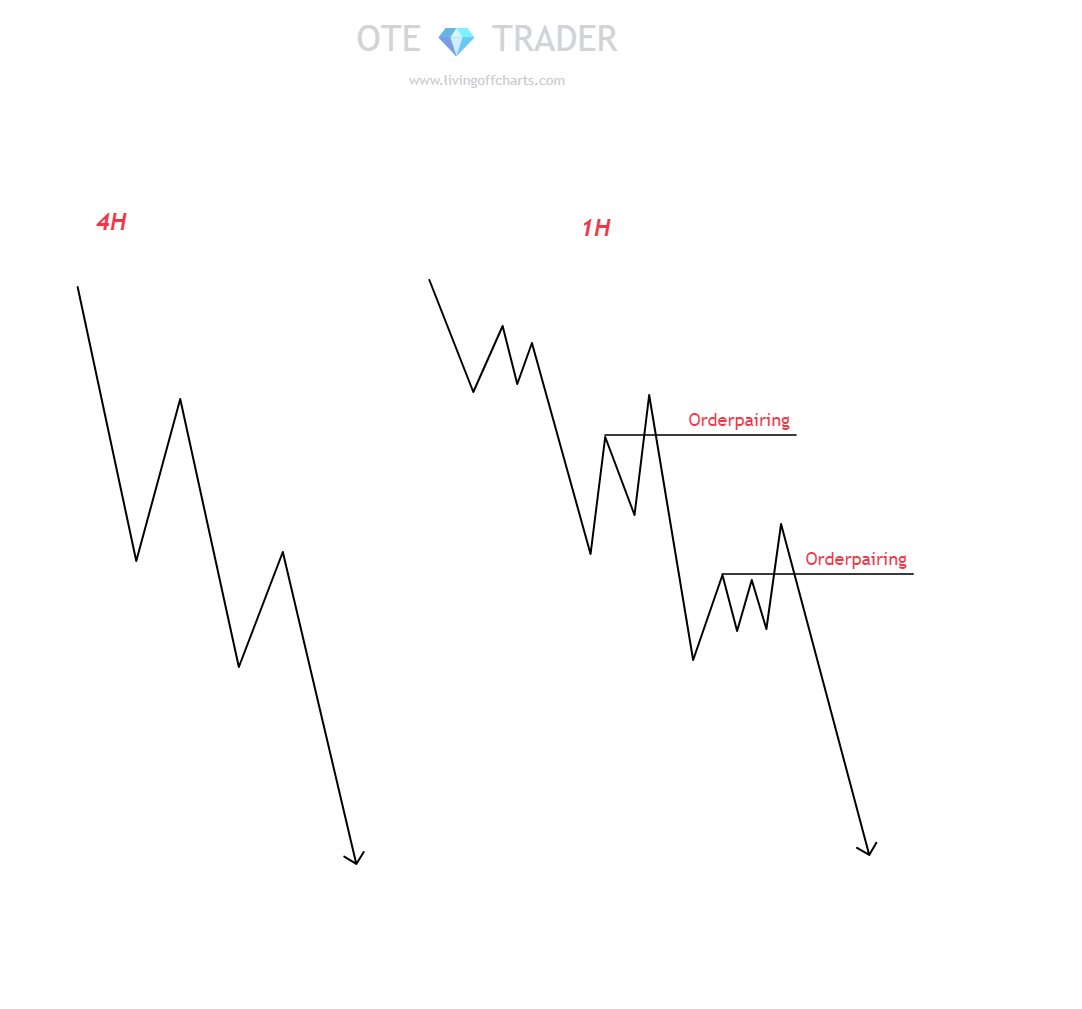
Why would you want to trade without Orderpairing?
The best buys happen below lows and the best sells above highs.
Understanding hierarchy of the Timeframes is where you know you can Orderpair.
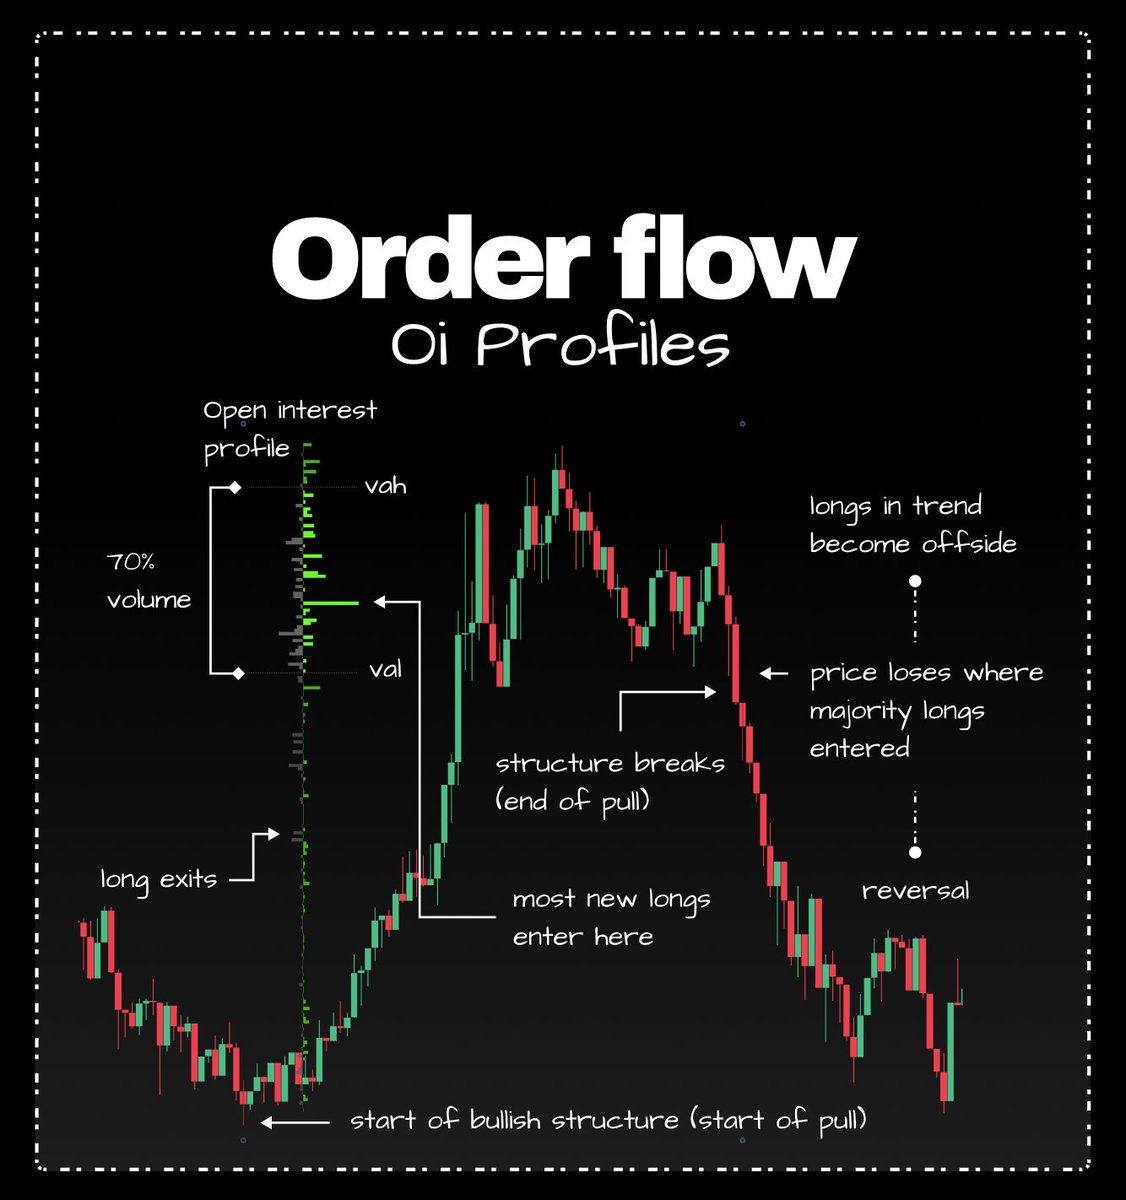
Oi profiles
Helps to expose vulnerability in trending moves.
Using an OI profile to highlight an uptrends distribution of new long positions, we can find weakness when they become offside by the market.
Good when new orders congregate near highs.
...in-depth example ↓