ICICI Bk was following a downtrend and the stk has bottomed out let's understnd how
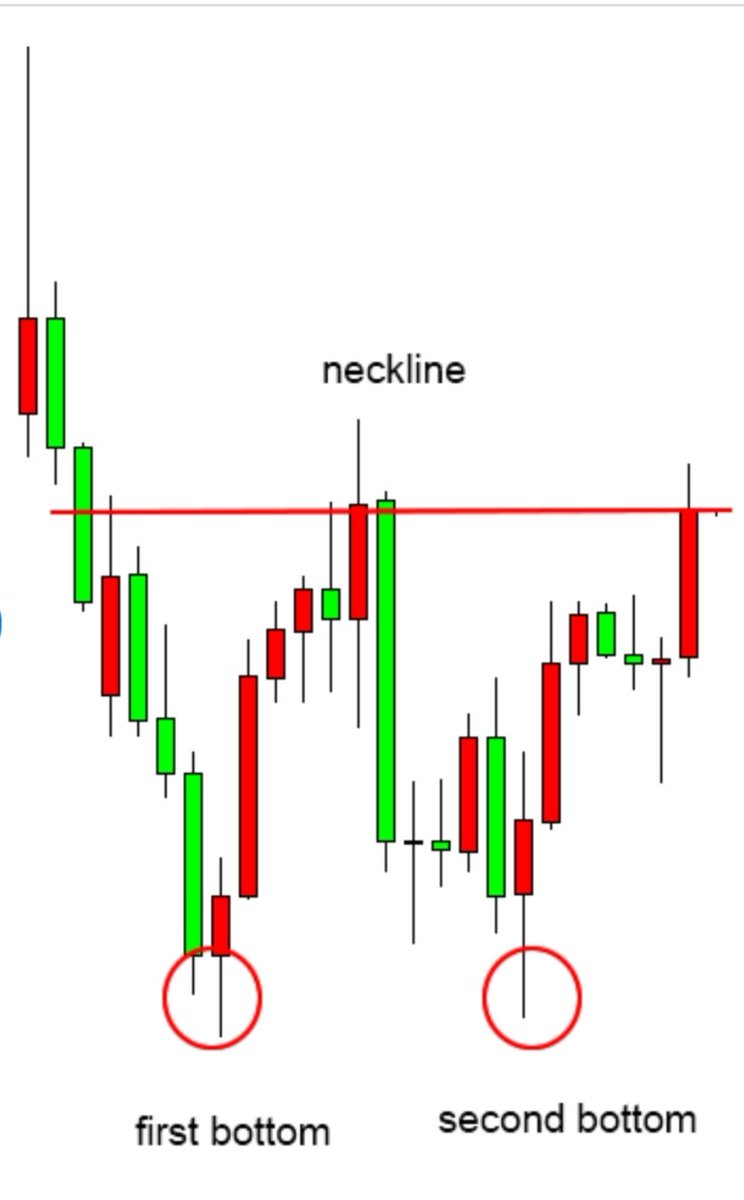
Wherever the price action has formed a double after a downtrend,it is an indication that the trend has reversed, rfr 2nd img
We keep the Tgt as 1030 SL 1000
Stock is trading at 1009
Risk:reward1:3
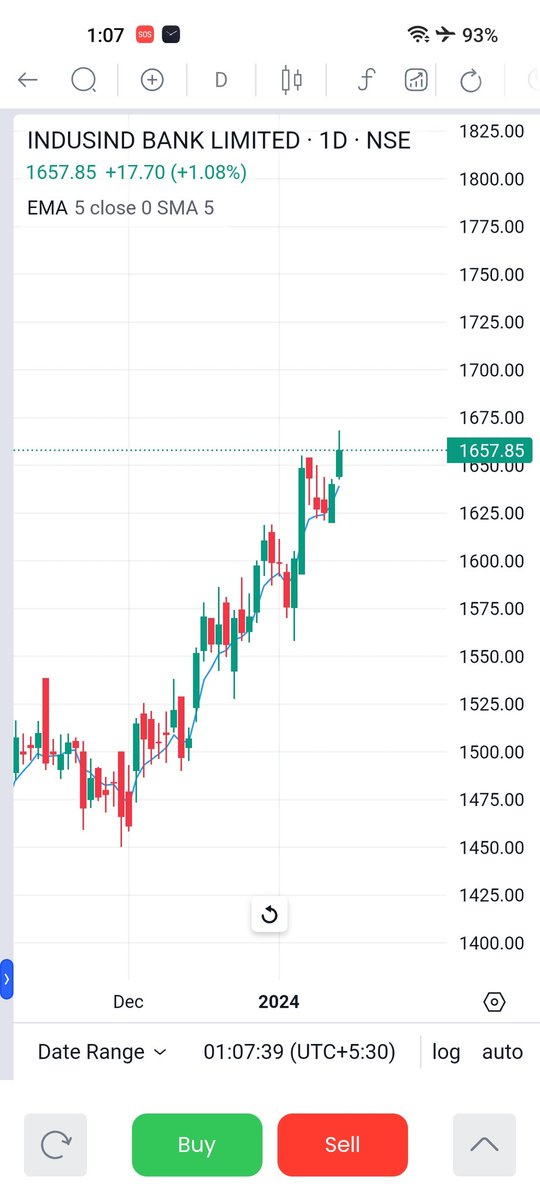
Let's do the technical analysis on Indusind bank
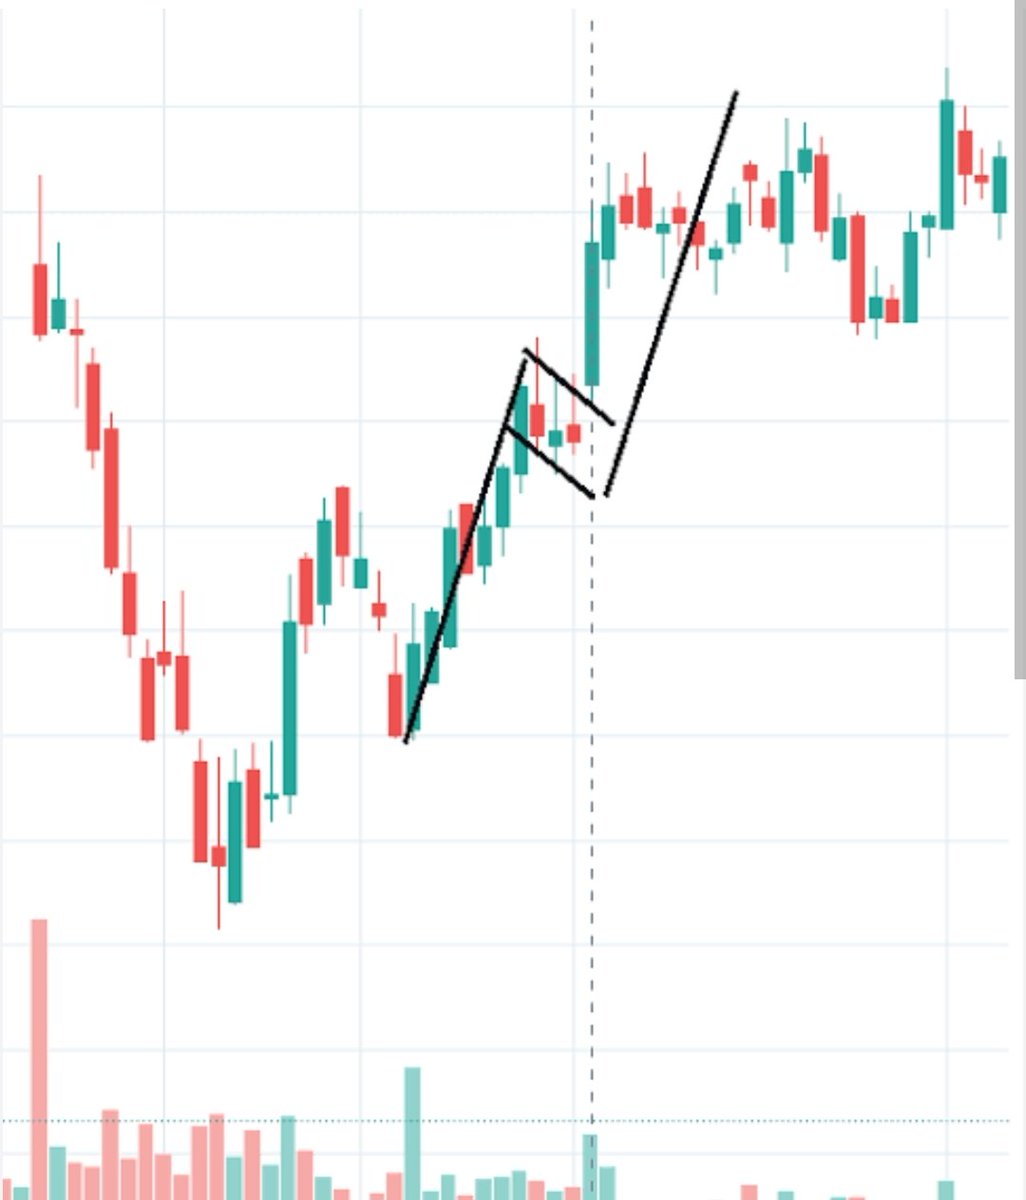
We can observe a flag pattern here
Typically, Targets are set as the length of the pole (74 points in this case) and StopLoss at 1648 (point where pole ends) (Refer 2nd image)
Stock is currently trading at 1657
Risk:Reward 1:8
We can expect this to reach 250 in coming days ( Q: how did you calculated the target, A: Targets are generally the hight of the bull rally which was seen at 120 ) (4/4)
The supply line is the lower line of the triangle and represents the oversold side of the market when investors are going out taking profit and when this price is broken, we can confirm that the index is in a downtrend (5/5)
Think of the upper line of the triangle, or upper trendline, as the demand line, which represents resistance on the chart. At this point, the sellers of the issue outpace the buyers, and the index's price begins to fall (4/n)
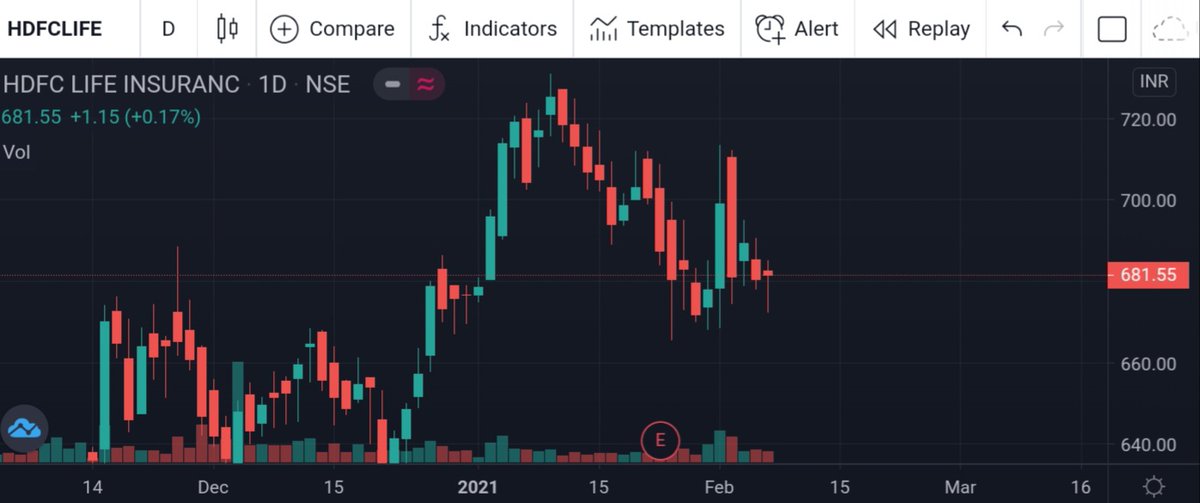
Lets us do the technical analysis of BIOCON LTD by logic
I have drawn an horizantal line ( which is in blue color ) which acts as support and resistance of the stock ( 1/n)
Again in feb, 401 is acting as its strong support,and it has bounced from 401 levels, so we can be bullish for this stock https://t.co/SD0YBbhl4W,according to our analysis,it can reach 442 again in coming days (4/n)
After reaching its previous support i.e 766, it bounced back 710, and now it managed to close above its previous support, so it has the potential to move upside till 730 again (3/n)