In 1982, Robin Williams did a routine as the American Flag for the Norman Lear produced tv special "I Love Liberty" created to bridge political divides - and it's one of the greatest pieces you'll see 🇺🇸
I have read approximately 3,000 10-Ks in my life. I have read my wife’s emotional state correctly maybe 11 times. This is troubling because the skills should transfer. Both require you to look past the headline. Both require you to read the footnotes. Both require you to notice what was said last quarter that is not being said this quarter.
I can spot a goodwill impairment from 40 pages away. I cannot spot that my wife has been quietly furious since Tuesday. In a 10-K I notice when management changes the word “challenging” to “dynamic” and I correctly interpret this as a warning. In my marriage my wife changed the word “fine” to “fine.” and I did not notice the period. The period was the entire disclosure.
I missed it. I read a footnote last week in a packaging company’s annual report that disclosed a related-party transaction worth $400,000 and I caught it in 90 seconds. My wife told me three times this month that she was tired and I interpreted this as “tired” when in fact it was a Level 3 disclosure requiring immediate management response. I have a system for 10-Ks. I read the MD&A first, then the risk factors, then the cash flow statement, then the notes. I have no system for my wife. She is a company that does not file. She reports continuously and without warning and the format changes every quarter. Her risk factors are not enumerated.
Her MD&A is delivered through sighs of varying length and I have not yet developed the ear. Last week she said “do whatever you want” and I did whatever I wanted and it turns out the correct interpretation of “do whatever you want” was “do not do that specific thing” and I have no idea how I was supposed to know that, and yet, looking back, the signals were all there. The signals are always there. I have been trained to find signals. I find them in companies I will never meet. I miss them in the person I have lived with for nine years. My wife has started saying things like “you would notice this if I were a stock” and she is correct. She is correct. If she had a ticker I would have already built a 6,000-word model on her. I would know her seasonality.
I would know her capex cycle. I would know which quarters historically run hot. Instead I treat her like a private company and I am surprised every time the auditors arrive. I am going to bed now. She said good night in a tone. I do not know what the tone meant. I will find out in the morning. Or I will not. The 10-K of my marriage is filed in real time and I am, as always, three quarters behind.
Been living in New York City for around five years now.
Yes, it’s expensive, taxes are high, and there are some interesting characters walking around. Those are some of the costs.
Here’s what we get:
Access to the best restaurants in America, no matter what type of food you’re in the mood for.
Everything our family needs is just a short walk away.
You constantly get to see friends in person, as they’re always passing through.
Some of the best public and private schools in America.
The network you build here, just by going about your day-to-day life, is incredible. You run into some of the most interesting people doing the most amazing things at the highest level.
Access to the best doctors in the world.
The career opportunities here are immense, no matter what you do.
Central Park – my go-to spot – never gets old.
If you’re a shopper, there’s nowhere better in America.
If you’re an entrepreneur, this city forces you to think bigger on a daily basis.
Broadway, sports, concerts, comedy – the highest level of entertainment, right in your backyard.
The subway. Yes, the subway – and yes, millions of normal people take it every day – gets you around this place like a time machine.
It’s a wonderful place to raise kids. Every kids' activity you can think of is just blocks away. Our son loves the Natural History Museum, and endless playdates are available either in our building or within a three-minute walk.
Maybe all those folks who can afford to live anywhere in the world but choose to raise their families here aren’t so crazy after all.
NYC weekends really do feel rainier... I ran more data and built a full data investigation to see if the pattern is real.
Across 2,192 days (6yrs now!) of weather data, NYC rain rates by day of week look like this:
Mon: 27.8%
Tue: 32.9%
Wed: 31.8%
Thu: 34.5%
Fri: 38.0%
Sat: 35.8%
Sun: 32.3%
Friday is the rainiest day of the week.
You are not imagining it.
The interesting part is the possible chain reaction behind it.
NYC’s PM2.5 air pollution appears to peak midweek, with Wednesday averaging 8.5 µg/m³, roughly 23% higher than Sunday’s 6.9.
Those particles can act as cloud condensation nuclei, which may help clouds form and intensify under the right atmospheric conditions.
With a 2–3 day lag, that points to a plausible pattern:
Midweek pollution buildup → late-week cloud formation → Friday/Saturday rain risk.
But the weather does not start in NYC.
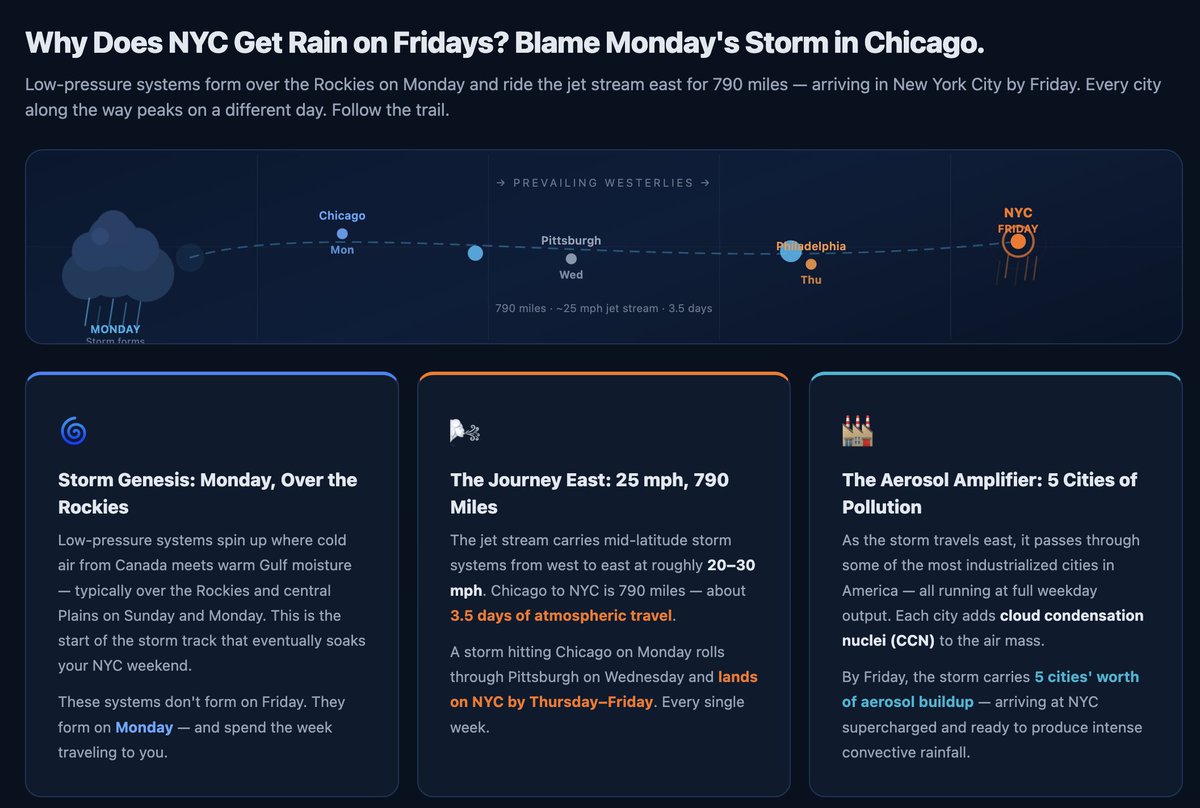
Storm systems often form or organize farther west, then move east with the prevailing flow. In the data, the rain pattern appears to travel city by city:
Chicago: Mon, 33.2%
Pittsburgh: Wed, 34.1%
Philadelphia: Thu, 35.2%
NYC: Fri, 38.0%
The storm track takes roughly 3.5 days to travel about 790 miles.
Which means it can arrive in New York right as the weekend begins.
NYC also is not only dealing with its own emissions. A meaningful share of its PM2.5 can come from upwind sources.
The I-95 corridor, including Philly, Trenton, Newark, and surrounding metro areas, sits directly southwest of NYC, which matters because prevailing winds often move pollution northeast.
In other words, NYC may be the end of the pipeline.
One of the most interesting signals came from COVID.
During lockdowns, the weekly pollution rhythm weakened sharply as traffic collapsed. With far fewer vehicle crossings and less commuter activity, the normal 7-day aerosol cycle became much less pronounced.
When traffic came back, the pattern returned.
That does not prove tailpipes alone are making it rain every weekend. Weather is complicated. But the data suggests a real and testable relationship between traffic, pollution, atmospheric particles, storm timing, and late-week rainfall.
The thesis:
Our weekly human activity cycle may be helping shape NYC’s weekly rain cycle.
Full interactive dashboard with 2,192 days of data, animated storm tracks, and live charts:
https://t.co/m4dpRvXoXo
Nolan McLean, 84mph Sweeper (22" of break) and 97mph Two Seamer (18" of run), Individual Pitches + Overlay.
40 inches of horizontal movement difference.
If Twitter existed in 1986:
Mets now 2-3 after a brutal home opener. Going nowhere. Strawberry hitting .190. Should be benched.
Hojo with a brutal error. Send him to Tidewater.
Why the heck is Kevin Mitchell even on the team?
Davey should be fired. No feel for team.
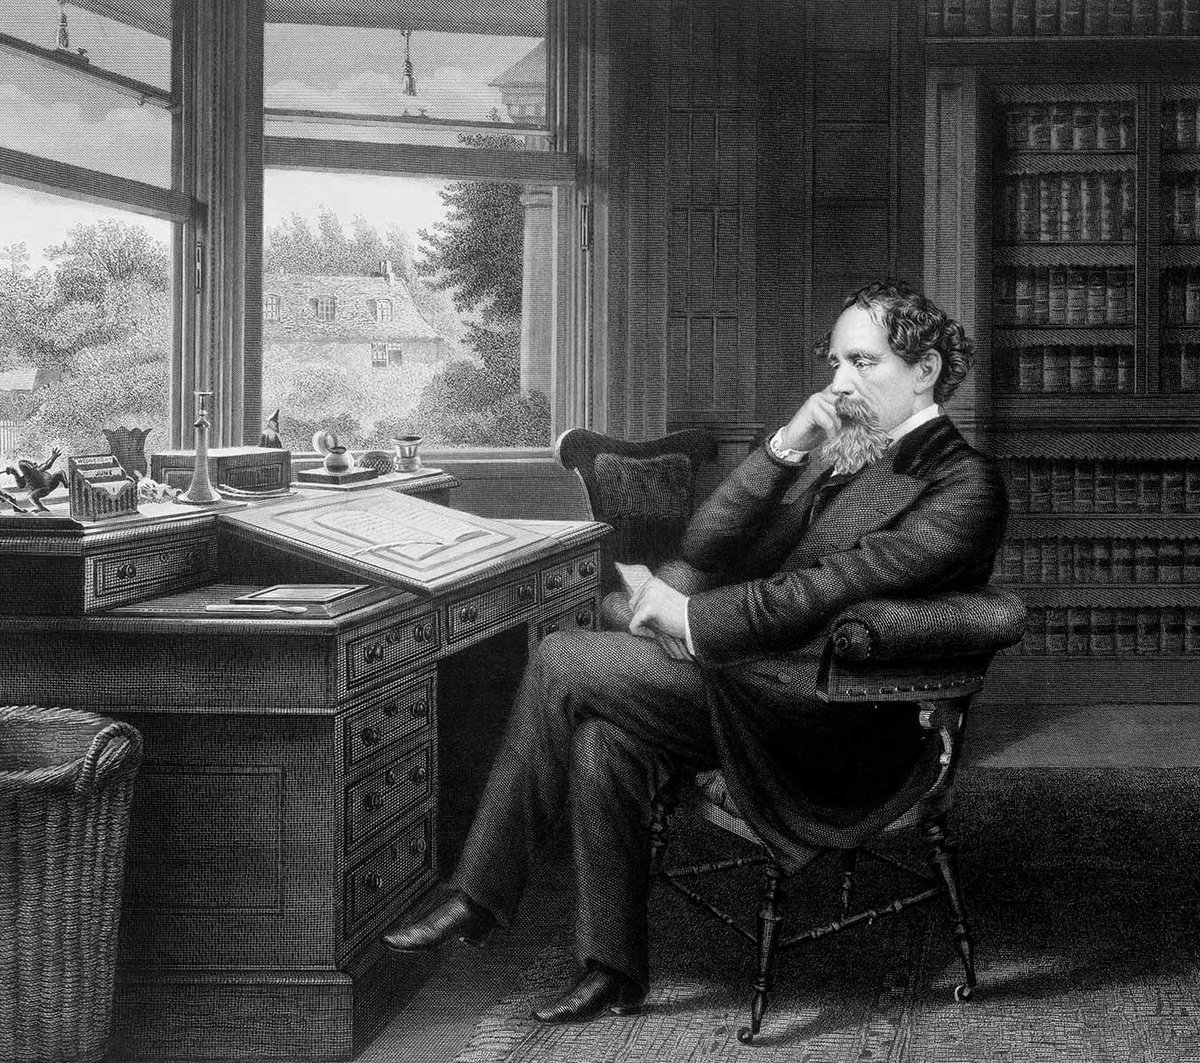
“It was one of those March days when the sun shines hot and the wind blows cold: when it is summer in the light, and winter in the shade.”
— Charles Dickens
@ClancyNeil@KFCBarstool@Pirates That's a valid point. I do read somewhere they had to readjust the whole concept of the zone to make it so the ABS can be consistent. Wouldn't be surprised to see the veteran players and umps get hit the hardest going forward.
@ClancyNeil@KFCBarstool@Pirates I mean even in that case wouldn't that mean the ball is still crossing half the plate in the strike zone? I guess that comes down to the fact that if a ball crosses any part of the plate (in the zone) even slightly should it still be a strike. I'd say yes.
Head-to-Head Record
Runs Allowed Quotient: Teams are ranked by the lowest quotient of runs allowed divided by the number of defensive outs recorded in games played specifically between the tied teams.
Earned Runs Allowed Quotient: If still tied, the same calculation is performed using only earned runs divided by defensive outs in games between the tied teams.
Highest Batting Average:
Drawing of Lots