Day 15 of my #30DayChallenge to secure a role in data science!
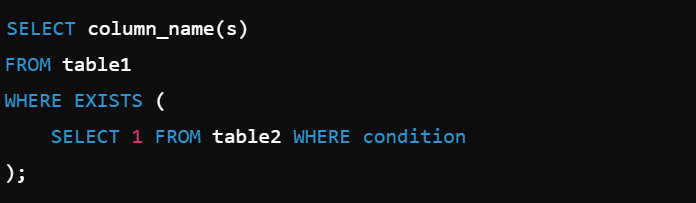
EXISTS vs IN in SQL
🔹 EXISTS – Checks if a subquery returns any rows (stops at first match).
🔹 IN – Checks if a value exists in a list/subquery result (compares all values).
🔹 Performance – EXISTS is often faster.
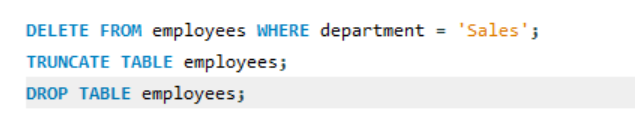
1️⃣ DELETE – Removes specific rows with a WHERE clause. Can be rolled back!
2️⃣ TRUNCATE – Removes ALL rows but keeps the table structure. Faster than DELETE.
3️⃣ DROP – Deletes the entire table (structure + data).
#DataAnalystJob#FreelanceDataAnalyst#DataScienceJobs#DataDriven
🚀 Day 13 of my #30DayChallenge to secure a role in data science!
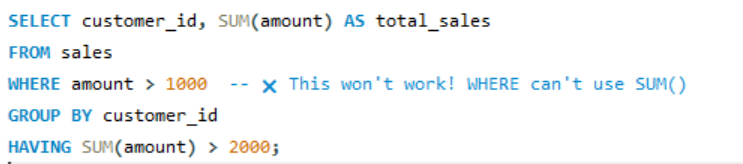
Today, I explored the difference between WHERE vs. HAVING in SQL.
🔹 WHERE filters before aggregation (raw data).
🔹 HAVING filters after aggregation (grouped data).
🚀 Day 12 of my #30DayChallenge to secure a role in data science!
Today, I explored WITHIN GROUP—a powerful SQL clause used in ordered-set aggregate functions like PERCENTILE_CONT().
It helps calculate percentiles, rankings, and mode by sorting data before aggregation.📊
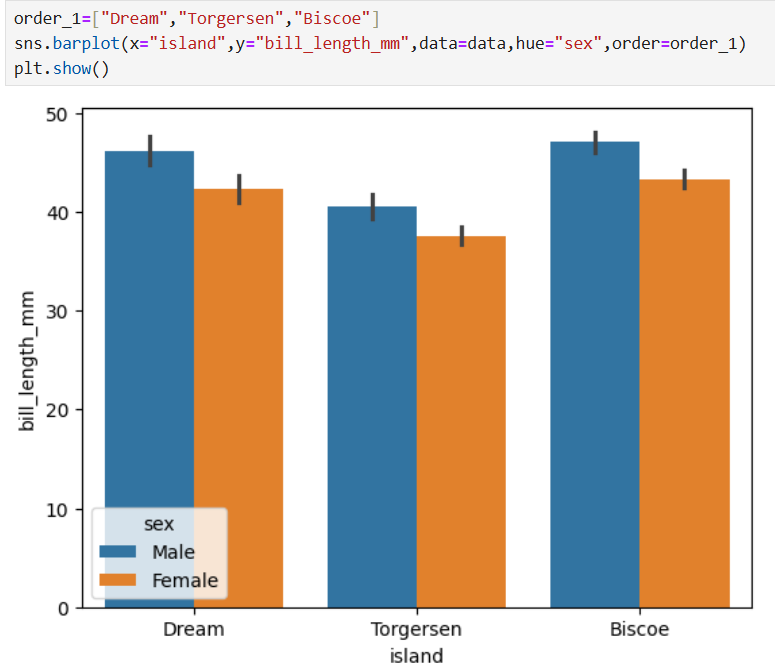
4️⃣ Sort Categories Logically: Sort your bars in ascending or descending order, or in a meaningful sequence (like "Dream," "Torgersen," and "Biscoe" in your chart).
5️⃣ Avoid Overloading: Too many categories or colors can make a bar plot overwhelming. Focus on key comparisons.
🚀 Day 11 of my #30DayChallenge to secure a role in data science!
Tips for Better Bar Plots
1️⃣ Clear Labels: Ensure both the x-axis and y-axis have meaningful and concise labels. If your data uses units (e.g., mm), always include them.
#DataScience#DataVisualization#Seaborn
2️⃣ Consistent Colors: Use a color palette that is easy on the eyes and consistent across categories. For instance, you could use complementary or sequential colors for better differentiation.
3️⃣ Add Data Labels: Consider adding the exact values on top of the bars .
✨ Key highlights:
Leveraged hue to compare categories.
Ordered bars using the order parameter for better storytelling.
📚 Visualization tip: Always consider ordering your categories to enhance interpretability.
How do you structure your plots for maximum clarity?
#DataScience
🚀 Day 10 of my #30DayChallenge to secure a role in data science!
📊 Today’s focus: creating bar plots with Seaborn! This chart compares the average bill length of penguins 🐧 across islands, grouped by sex.
#DataScience#DataVisualization#Seaborn
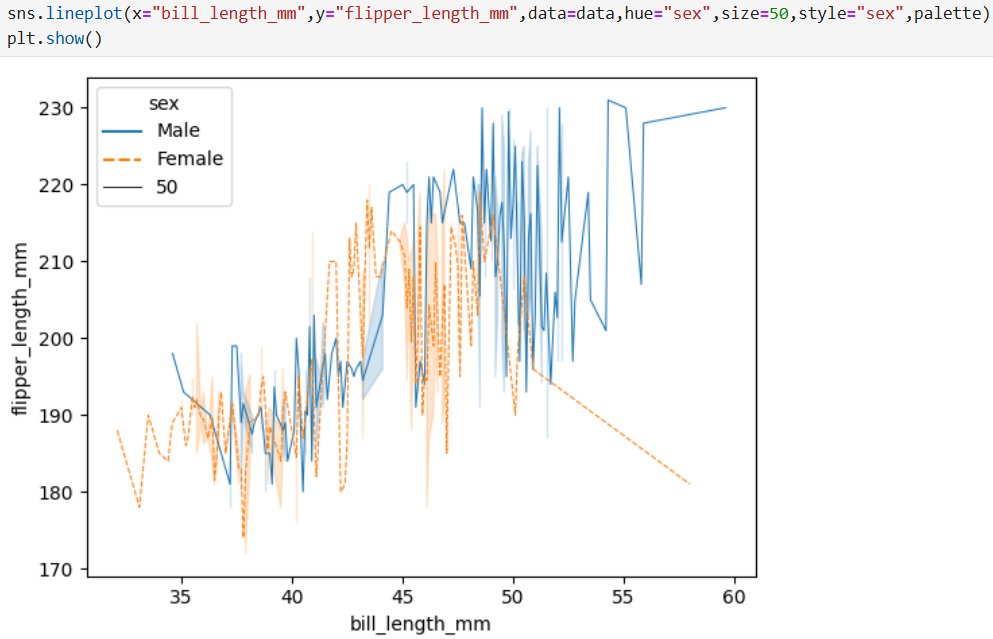
🎨 Key techniques:
Used hue and style to highlight patterns across categories.
Experimented with size and color palettes for clarity.
📈 Visualization is a powerful storytelling tool in data science. How do you make your plots stand out?
#DataScience#DataVisualization#Python
Day 9 of my #30DayChallenge to land a data science role!
🔍 Today, I explored Seaborn's lineplot to visualize relationships in data. The chart below shows the relationship between bill length and flipper length, categorized by penguin sex 🐧.
#DataScience#DataVisualization
Struggling with inconsistent data? Normalize it!
Whether it's scaling or handling outliers, data preprocessing is KEY to unlocking meaningful insights.
Try MinMaxScaler in Python to scale your features:
scaler = MinMaxScaler()
scaled_data = https://t.co/JWWDufmrvU_transform(df)