🔥 $ONDO Chart Analysis – Bullish Breakout Incoming?
Hey #CryptoFam! Let’s dive into this $ONDO chart! #ONDOUSDT#TechnicalAnalysis#Bullish
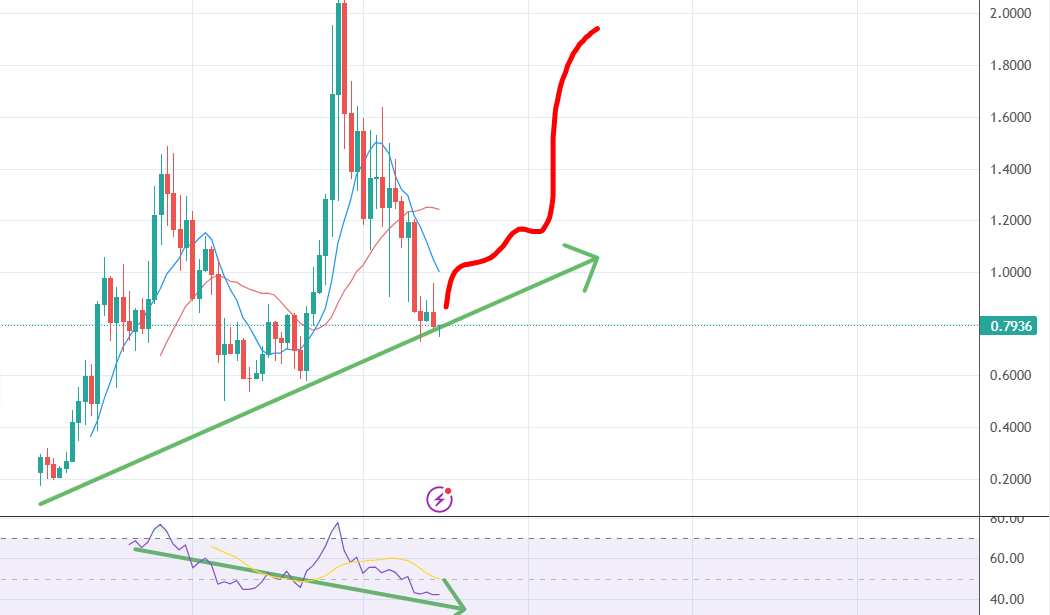
Uptrend Confirmation
$ONDO has been in a strong uptrend since February 2024, following the green trendline with consistent higher lows. #Uptrend #CryptoTrading #ONDOPrice
Breakout Above Resistance
The price broke above the $0.782 resistance (red line) with a strong candle—a big bullish signal. The red arrow marks the breakout; the green arrow points to a potential $1.200 target or higher! #Breakout #CryptoSignals #ONDOAnalysis
Volume Surge
Volume bars show a spike in buying (green bars), confirming the breakout and strong buyer interest. #VolumeAnalysis #CryptoVolume #ONDOHype
RSI Indicator
The RSI is trending down despite the breakout, hinting at a possible pullback or consolidation. It’s not overbought, leaving room for upside. #RSI #CryptoIndicators #PricePrediction #ONDOFuture
Risk Management
Watch the $0.782 level! A drop below could test trendline support at $0.600. Set stop-losses accordingly. What’s your take on $ONDO? Buying the breakout? Let’s discuss! #CryptoCommunity #ONDOHolders #TradingIdeas #BullMarket #CryptoGains #ONDOToTheMoon
Hey there, crypto fam! 🚀 Let’s dive into this Ethereum $ETH chart and break down what’s happening in a way that’s easy to understand—whether you’re a seasoned trader or just getting started. I’m here to help you make sense of the market and hopefully give you some insights to grow your portfolio. If you find this helpful, don’t forget to subscribe for more friendly and actionable crypto analyses! 📷What’s Happening on the ETH Chart?
This chart shows ETH’s price action on a daily timeframe, starting from late January 2025. Let’s break it down step by step:
1. Descending Triangle Pattern
For the past few months (January to late May 2025), ETH has been trading within a descending triangle—a classic chart pattern. This pattern is marked by a flat support line around the $1,790 level and a downward-sloping resistance line (the upper blue line). Descending triangles often signal a continuation of the trend, which in this case was bearish since ETH had been trending downward before entering this pattern.
What does this mean? The price was consolidating, with sellers pushing the price lower each time it hit the resistance, while buyers were defending that $1,790 support like champs. This creates a "coiled spring" effect—pressure was building for a big move.
2. The Breakout! 📷
Around late May 2025, ETH finally broke out of the descending triangle—and it broke to the upside! This is huge! The price surged past the resistance line, and we see a massive green candle shooting up toward the $3,366 level (as shown in the top right of the chart).
Why is this exciting? A breakout above resistance in a descending triangle often signals a trend reversal. After months of bearish pressure, ETH is showing serious bullish momentum. The green arrow on the chart points to a potential target around $3,400, which aligns with previous resistance levels from earlier in the year.
3. Volume Confirmation
On the right side of the chart, we see a volume profile (those horizontal bars). Notice how the volume spikes significantly around the breakout area (green bars). This tells us that a lot of buyers jumped in during the breakout, which adds credibility to this move. High volume on a breakout is a great sign—it means the move is likely to have staying power.
4. Indicators: MACD and RSI
At the bottom of the chart, we have two indicators: the MACD (Moving Average Convergence Divergence) and RSI (Relative Strength Index).
MACD: The MACD lines (blue and orange) have crossed above the zero line, and the histogram is showing green bars. This is a bullish signal, indicating that momentum is shifting in favor of the bulls.
RSI: The RSI is around 60, which is in the "neutral to bullish" territory. It’s not overbought yet (which would be above 70), so there’s still room for ETH to run higher without being overstretched.
What’s Next for ETH? 📷
Based on this chart, ETH looks very promising for the bulls! Here’s what to watch for:
Upside Target: The green arrow suggests a target around $3,400, which matches the previous highs from earlier in 2025. If ETH can break above this level with strong volume, we could see it push toward $3,600 or even higher.
Support to Watch: If ETH pulls back, the former resistance of the descending triangle (around $2,200–$2,300) should now act as support. This is a key level to watch for a potential bounce if the price dips.
Risk Management: Always set a stop-loss! If ETH falls back below $2,200, it could signal that the breakout was a fakeout, and we might see it retest the $1,790 support again.
Why This Matters for You
This breakout could be a game-changer for ETH in 2025. If you’ve been waiting for a good entry point, this might be your moment—but always do your own research and manage your risk. The bullish MACD, strong volume, and breakout above resistance are all signs that ETH could be starting a new uptrend. 📷
Let’s Grow Together!
I hope this analysis was helpful and gave you some clarity on ETH’s next moves! If you liked this breakdown, hit that subscribe button—I’ll be sharing more crypto insights, chart analyses, and tips to help you navigate the market. Let’s grow our portfolios together! 📷 Drop a comment if you’re bullish on ETH or if you have any questions—I’d love to hear from you. See you in the next analysis! 📷
Disclaimer: This is not financial advice. Always do your own research before making any investment decisions. Crypto markets are volatile, so trade wisely!
Short-Term $BTC Analysis
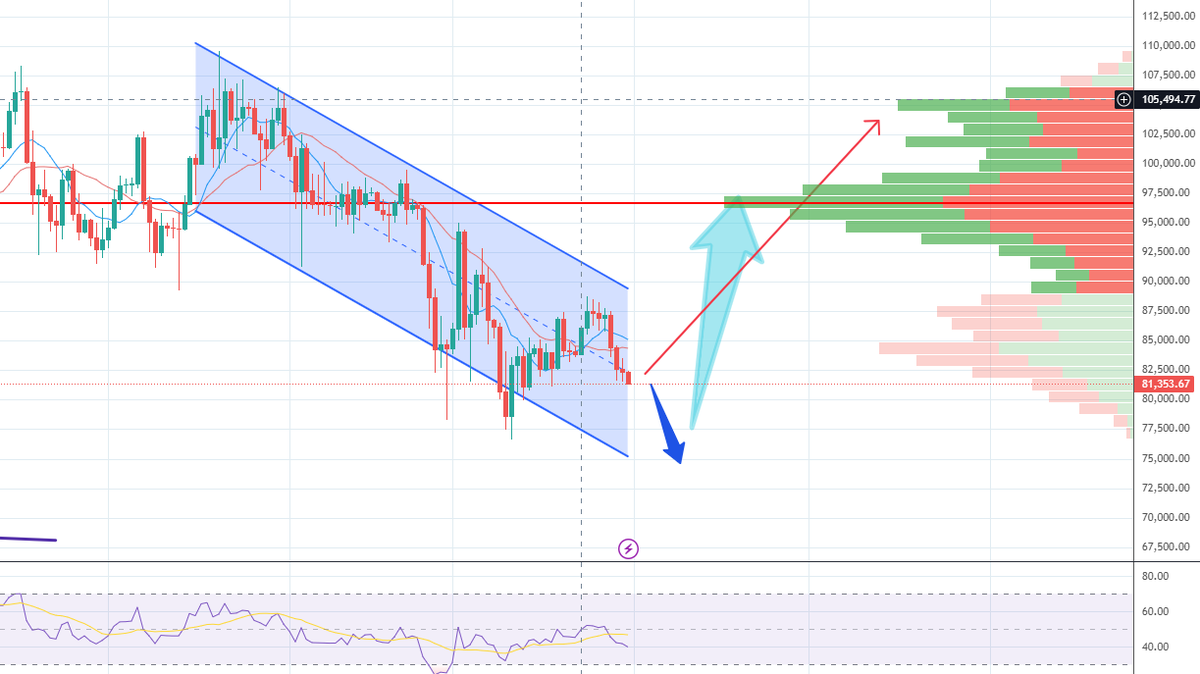
Trend: Recent posts on X and web data suggest Bitcoin has been consolidating or experiencing downward pressure after failing to break key resistance levels (e.g., $84,100 or $85,150). This could indicate a short-term bearish structure, possibly forming patterns like a descending broadening wedge or bear flag.
Support Levels: Key support is likely around $80,000–$81,000, with a deeper level at $77,000–$78,000 (noted as a CME gap fill in X posts). If the price drops below $80K, it might test these lower supports.
Resistance Levels: Immediate resistance sits at $84,100–$85,150. A breakout above this could signal bullish momentum, potentially targeting $88,000 or higher.
Indicators:
RSI (Relative Strength Index): Likely showing indecision (around 40–50) if consolidation is ongoing, or oversold (<30) if a sharp drop occurred recently.
MACD: Could be showing bearish divergence or a weakening bullish crossover, depending on the latest price action.
Ichimoku Cloud: If approaching the Senkou Span B (SSB) on a 4-hour chart (as mentioned in X posts), it might face resistance unless momentum shifts.
Medium-Term Analysis (Daily to Weekly Timeframe)
Trend: The daily chart may reflect a corrective phase after the January peak. Web data indicates a -2.12% drop over the past week and -2.23% over the past month, suggesting a cooling-off period following earlier bullish momentum.
Support Levels: Stronger support lies at $70,000 (noted in technical analysis from Investtech), with $77,000–$80,000 as intermediate zones.
Resistance Levels: $92,500 is a key resistance (Investtech), with $100,000 being a psychological barrier and a potential retest of the all-time high at $109,356.
Patterns: A falling wedge or bullish engulfing candle could be forming (per historical X sentiment), indicating a potential reversal if buyers step in. However, failure to hold $80K might confirm a deeper correction.
Volume: Trading volume ($17–18 billion in 24 hours as of March 30) suggests decent liquidity, but a spike would be needed to confirm a trend change.
Long-Term Analysis (Monthly Timeframe)
Trend: Bitcoin remains in a long-term uptrend, supported by its 18.60% increase over the past year and institutional interest (e.g., $196.7M in ETF inflows in March). The fixed supply of 21 million BTC continues to drive scarcity narratives.
Key Levels: The $100,000–$109,000 range is a critical zone to reclaim for new highs. A drop below $70,000 could signal a more significant bearish shift.
Indicators: The 200-week moving average (a common long-term support) is likely well below current levels (historically around $50K–$60K), reinforcing the bullish bias over years.
Sentiment and External Factors
Market Sentiment: Web data from March 24 shows a shift to positive sentiment as large holders accumulated 200,000 BTC. However, recent price declines might temper this optimism.
Institutional Activity: Bitcoin ETFs saw 10 days of positive inflows, suggesting sustained interest despite volatility.
Macro Factors: Potential volatility from U.S. policy shifts (e.g., Trump’s tariff announcements or SEC leadership changes) could influence risk assets like BTC.
Conclusion
Short-Term Outlook: Bitcoin appears to be at a pivotal point. A bounce from $80K–$81K with strong volume could push it toward $85K, but failure here might lead to $77K–$78K. Watch for breakout confirmation above resistance or a breakdown below support.
Medium-Term Outlook: Consolidation between $80K and $92K seems likely unless a catalyst (e.g., ETF inflows or macro news) drives a breakout. A drop below $77K could signal a deeper correction.
Long-Term Outlook: Bullish, given historical trends and fundamentals, but near-term volatility remains a risk.