Complete Guide to ICT Daily Profiles:
Most trading days repeat one of just FOUR Daily Profiles.
Learn how to identify them early, understand the narrative, and anticipate the session before it unfolds
Real chart examples included. 🧵
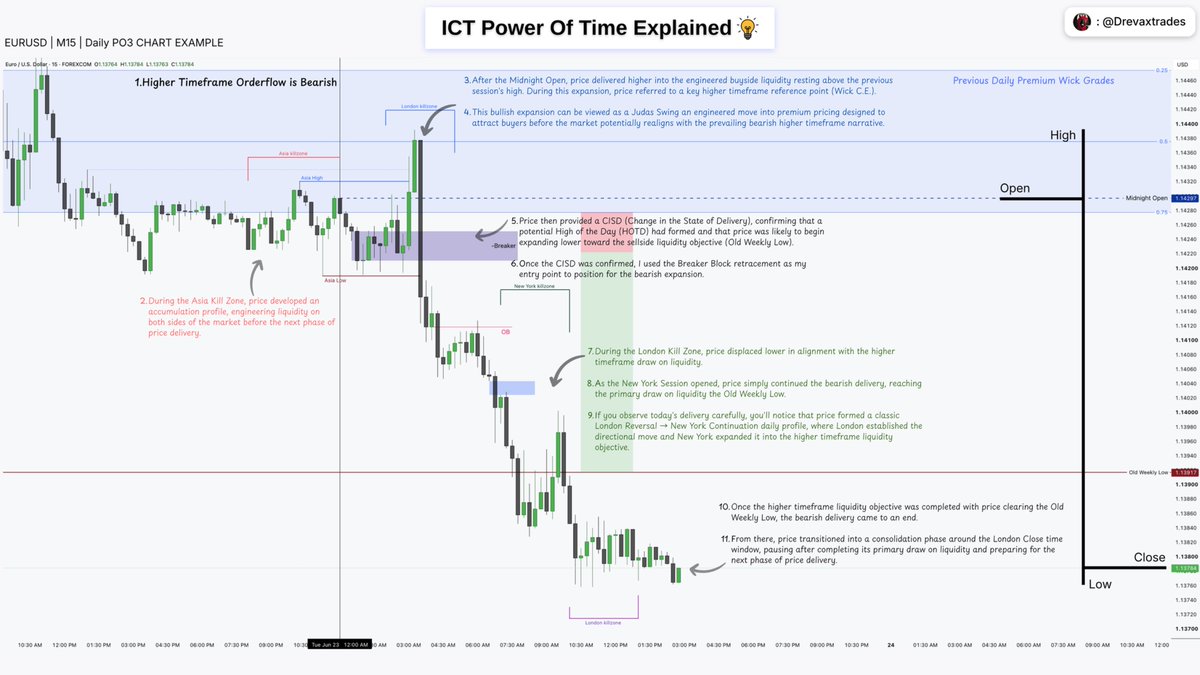
HOW THE ALGORITHM ENGINEER DAILY HIGHS & LOWS? (ICT POWER OF TIME)
Most traders believe daily highs and lows form randomly.
THEY DON'T They are engineered around specific TIME windows repeatedly, precisely, and with intent.
Here’s how ICT explains it .
The market’s daily range is most often shaped during four key sessions:
• Asian Open
• London Open
• New York Open
• London Close
Each session has a distinct role in price delivery.
Asia typically provides consolidation.
Sometimes it forms the daily high or low, but more often it builds liquidity and sets the stage.
If Asia creates a low and price expands away → that low is often protected.
London Open frequently delivers the impulse leg.
It can form the low or high of the day, or expand away from Asia to define directional intent.
If London creates expansion, later sessions usually retrace into London’s range.
New York Open is where manipulation is most visible.
This is where: • Liquidity raids occur
• Daily highs or lows are often printed
• Continuation or reversal is confirmed
Classic model: London impulse → NY retracement → NY continuation.
London Close often completes the range.
In bullish conditions, it frequently forms the high of the day.
In bearish conditions, the low of the day.
At higher-timeframe levels, London Close can also act as a reversal point, especially late in the week.
Here’s the key lesson most miss :
It’s not the session alone that matters.
It’s time + higher-timeframe price levels.
When a key session delivers price into a HTF PD Array, the probability of a swing increases dramatically.
This is why ICT traders don’t chase candles.
They wait for time to deliver price to the right location.
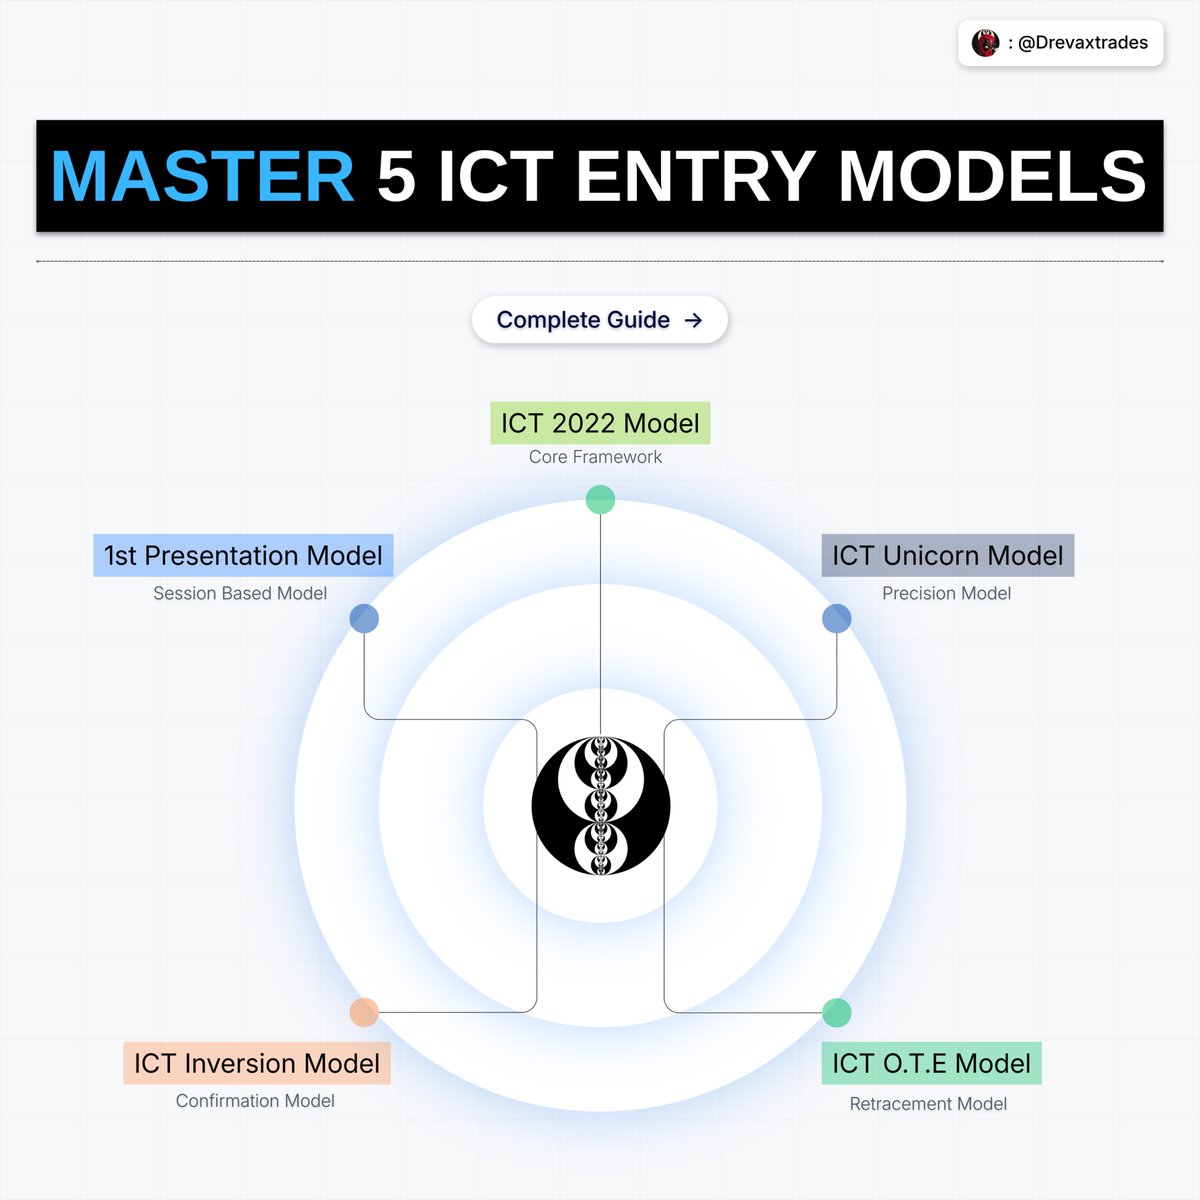
5 ICT Entry Models That Actually Matter🧪:
I compiled the 5 highest-probability ICT Entry Models into one comprehensive 24+ Pages Guide.
Learn when to enter, why it works, and how to execute it consistently
A THREAD🧵
Position Sizing > Strategy (The Truth Most Traders Ignore)
I don’t care how good your system is, how sharp your analysis is, or how perfect your timing feels.
If your position size is wrong you’re finished.
And if your size is right, you can survive even your mistakes.
This is the irony of trading:
The smaller you bet, the higher your chances of lasting long enough to win.
The bigger you bet, the faster you go broke.
Trading isn’t a lottery.
It’s a profession.
And professions require one thing above all - survival.
Respect your capital more than your opinion.
Not tips.
Not timing.
Not predictions.
Size.
Make your positions small enough that you can:
• take losses without fear
• follow your rules without hesitation
• stay in the game long enough to catch the real move
Because you only make real money
after you stop trying to get rich quickly.
You get rich by not going broke first.
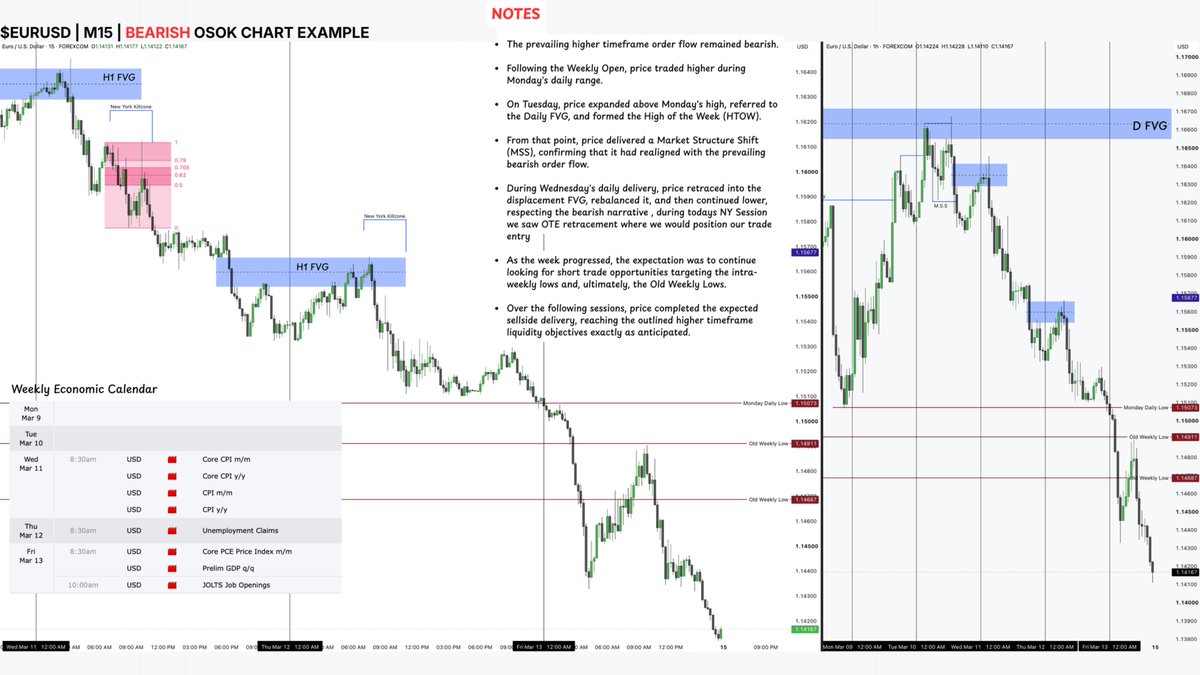
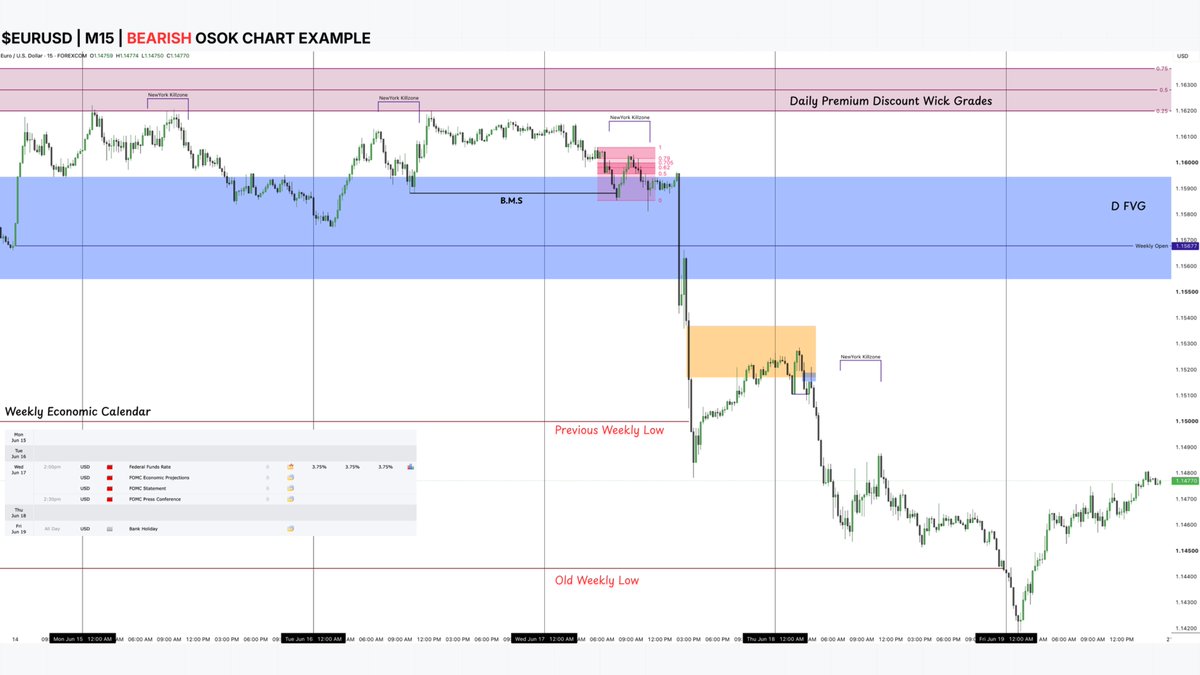
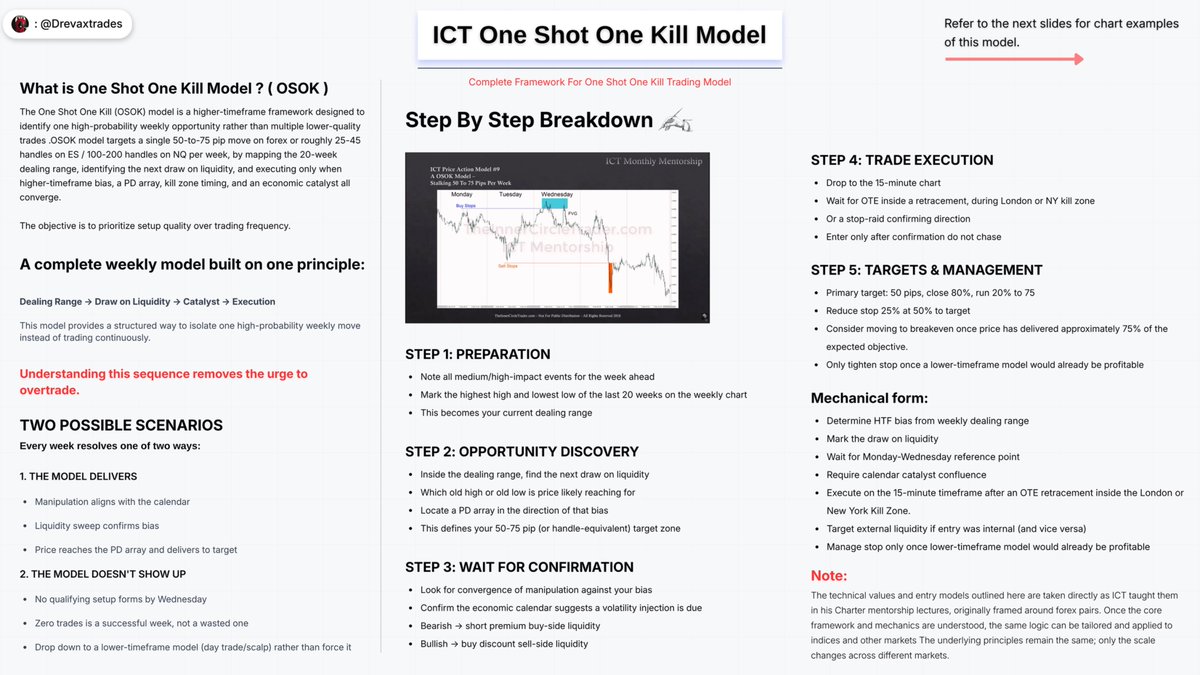
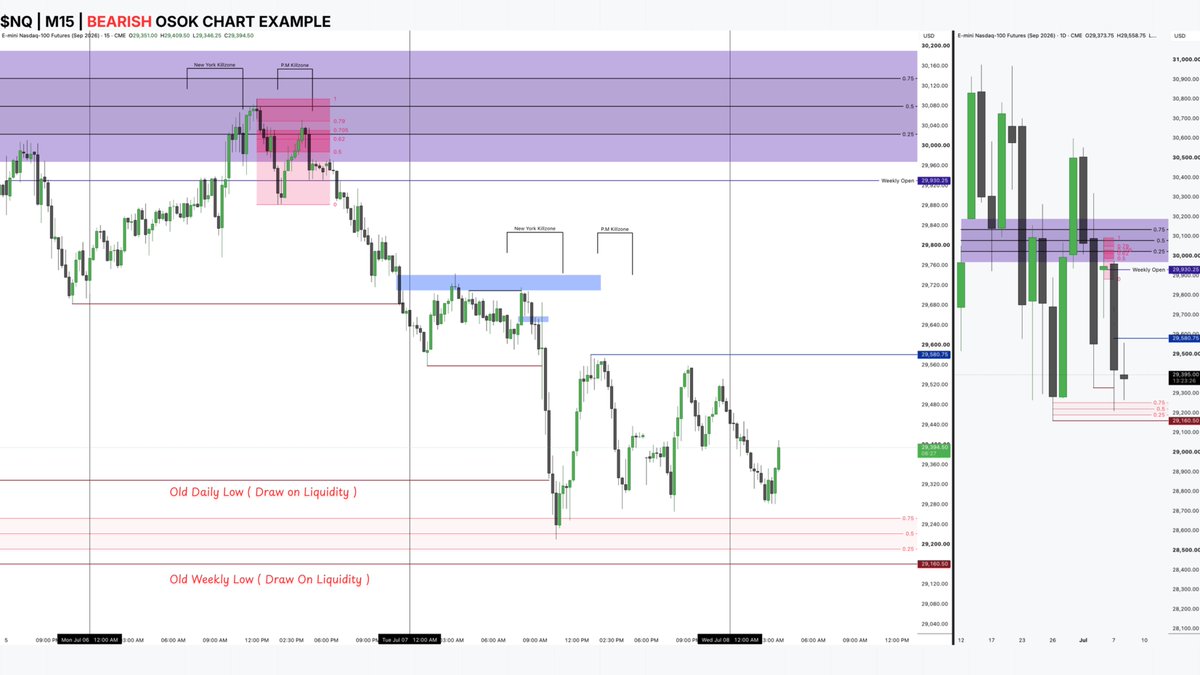
Master ICT's One Shot One Kill (OSOK) Model💡:
If you truly understand this model, you won't feel the need to trade every single day.
The complete step-by-step framework, execution process, and real chart examples to help you understand the model from start to finish
The ICT FOMC 2-Stage Delivery Framework🧪:
Study this before today's FOMC announcement.
A complete breakdown of the recurring delivery profile often observed between the 2:00 PM Rate Decision and the 2:30 PM Press Conference.
💡The Foundation of Price Delivery Every ICT Trader Should Understand.
The Algorithm Really Has Only Two Objectives:
1. Rebalance inefficiencies in price.
Every displacement leaves an imbalance.
Price will return to those areas to complete delivery.
2. Reprice above old highs or below old lows.
Those levels hold external liquidity,
and the algorithm is programmed to reach for them.
When both conditions appear in close proximity,
that zone becomes a powerful draw on price.
Start there first- it’s usually where the next move begins.
YOU DON'T HAVE A STRATEGY PROBLEM:
The psychology behind why traders lose on setups they knew were right.
18 lessons every trader should understand. 🧵👇
The Most Important FVG Of The Day 💡:
The first FVG that forms between 9:31–10:00 AM EST on the 1-minute chart during Regular Trading Hours (RTH).
This is NOT random.
This is time-authorized
inefficiency.
That FVG often becomes the reference point for the entire session - and sometimes even the entire week.
One of the simplest yet most effective ICT models.
🗒️
• Draw on Liquidity
• 09:30 Manipulation
• 9:50 Macro Time Window
• First Presented FVG Entry Model
The fewer variables your model has, the more repeatable execution becomes.
$ES / $NQ
How Time Controls Price Delivery ?
Price delivery during New York session is heavily influenced by predefined time windows where liquidity is engineered, repriced, and expanded toward higher timeframe objectives.
Understanding these time elements changes how intraday price action is interpreted.
NY AM SESSION:
• 7:00 A.M. → NY Killzone begins
• 7:00–8:30 → Premarket Silver Bullet
• 8:30 → Early Open / News Embargo
• 9:30 → Equities Open
• 9:30–10:00 → Opening Range
• 10:00–11:00 → AM Silver Bullet
The 9:30 Opening Range is one of the most important intraday windows.
This is commonly where the market:
• Creates the high or low of the day
• Runs liquidity
• Rebalances inefficiencies
• Establishes directional delivery
If bullish, the algorithm often engineers sellside liquidity below short-term lows before expanding higher.
If bearish, the algorithm often engineers buyside liquidity above highs before delivering lower.
PM SESSION:
• 12:00–1:00 → P.M Lunch Hour
• 1:30 → PM Open Macro
• 2:00–3:00 → PM Silver Bullet
• 3:15–3:45 → Final Hour Macro
• 4:00 → True Day Close
• 4:30 → NY PM Close
After lunch hour, the market transitions into a different delivery phase.
By 1:30 PM:
• AM manipulation is usually complete
• Daily targets may already be reached
• The market prepares for either continuation or reversal
Between 2PM–3PM, the PM Silver Bullet window often delivers:
• Liquidity runs
• Inefficiency rebalancing
• Expansion setups
• Continuation or reversal delivery
Then comes the Final Hour Macro.
3:15–3:45 PM is one of the cleanest delivery windows of the day.
If higher timeframe liquidity remains unsatisfied, the market will often expand aggressively toward that objective before close.
Markets are programmed around liquidity and time.
If liquidity is engineered before the open, then continuation becomes more likely.
If liquidity remains untouched into key macro windows, then manipulation is more likely before expansion.
The objective is understanding how the algorithm shifts delivery based on current market conditions and liquidity positioning throughout the session.
$NQ
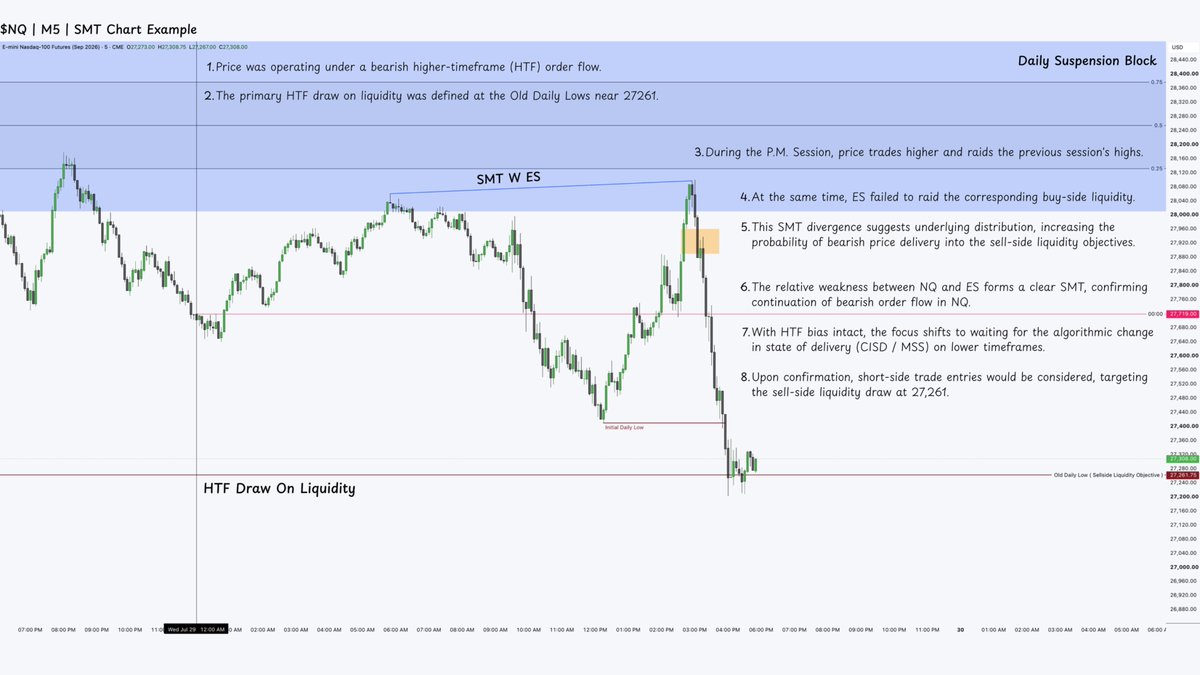
The breaker + FVG is the strongest algorithmic entry pattern there is, especially if liquidity is taken at open price.- ICT
Market Maker Buy Model (MMBM) Framework.💎
1. Draw on Liquidity→ Initial highs formed after the 9:30 open
2. Manipulation→ Pre-market low raid
3. Breaker + FVG → Entry model for continuation into buy-side delivery