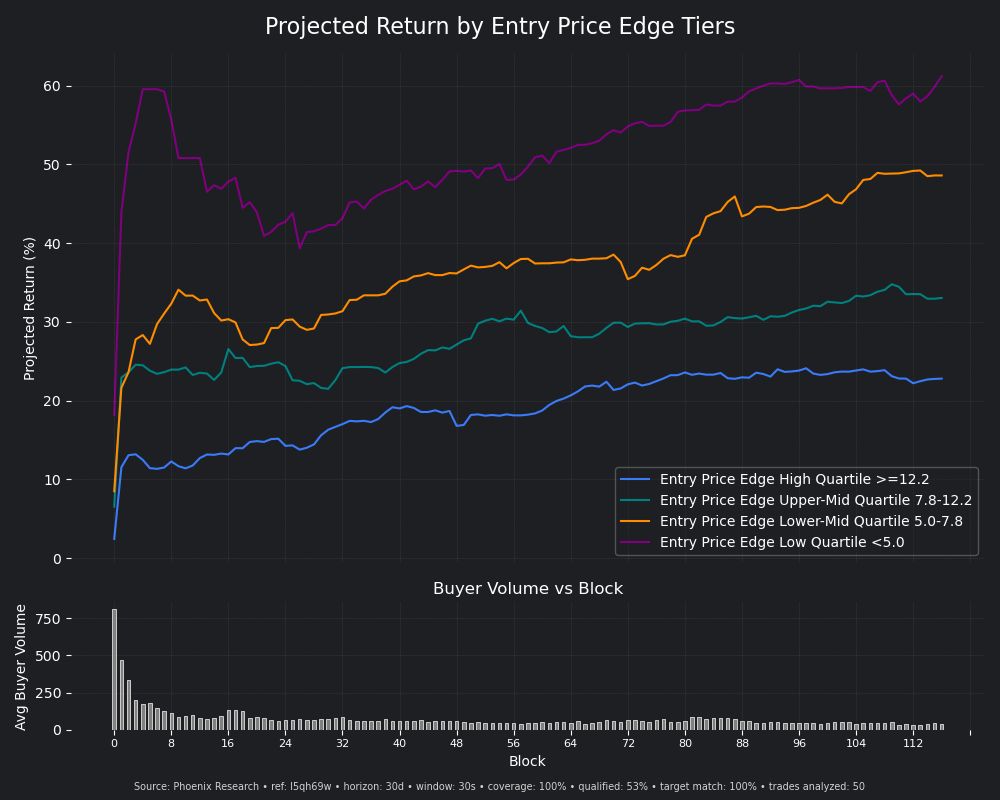
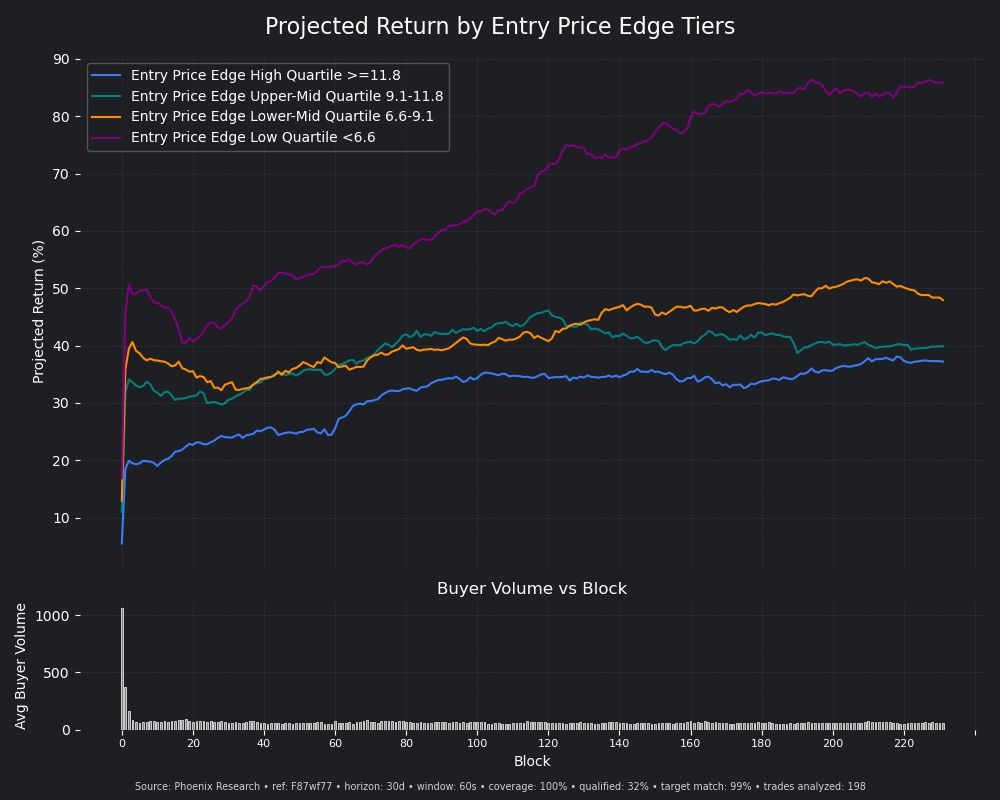
A strong signal deserves a deeper test.
Initial Driver Analysis showed a clear structure.
So we expanded:
* 112 → 220 blocks per entry
* 50 → 198 trades in the backtest
The signal persists — stable across a wider window and larger sample.
And the data reveals a second entry opportunity below $12K market cap, with the strongest performance below $6.6K.
**Find the signal. Expand the test. Confirm the edge.**
Should you always copy-sell a wallet?
Depends.
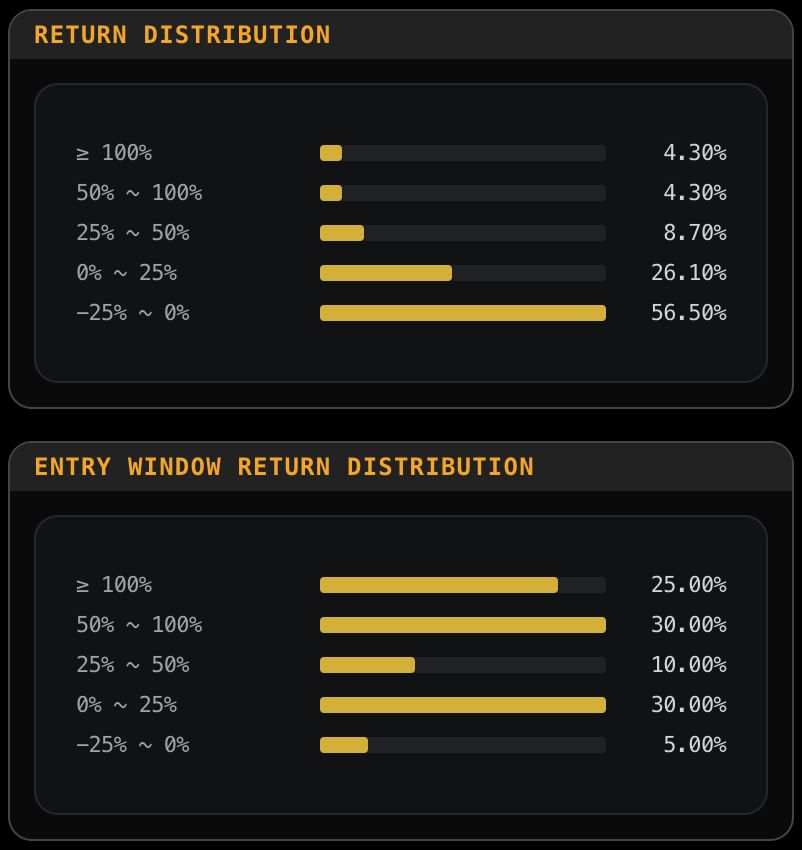
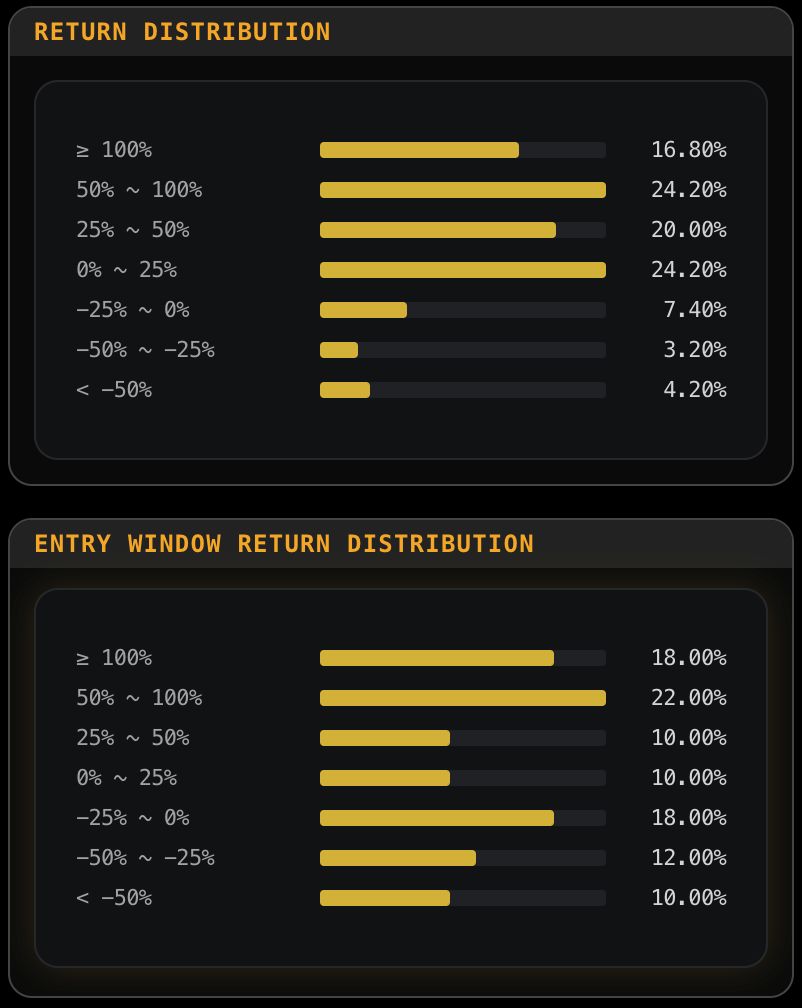
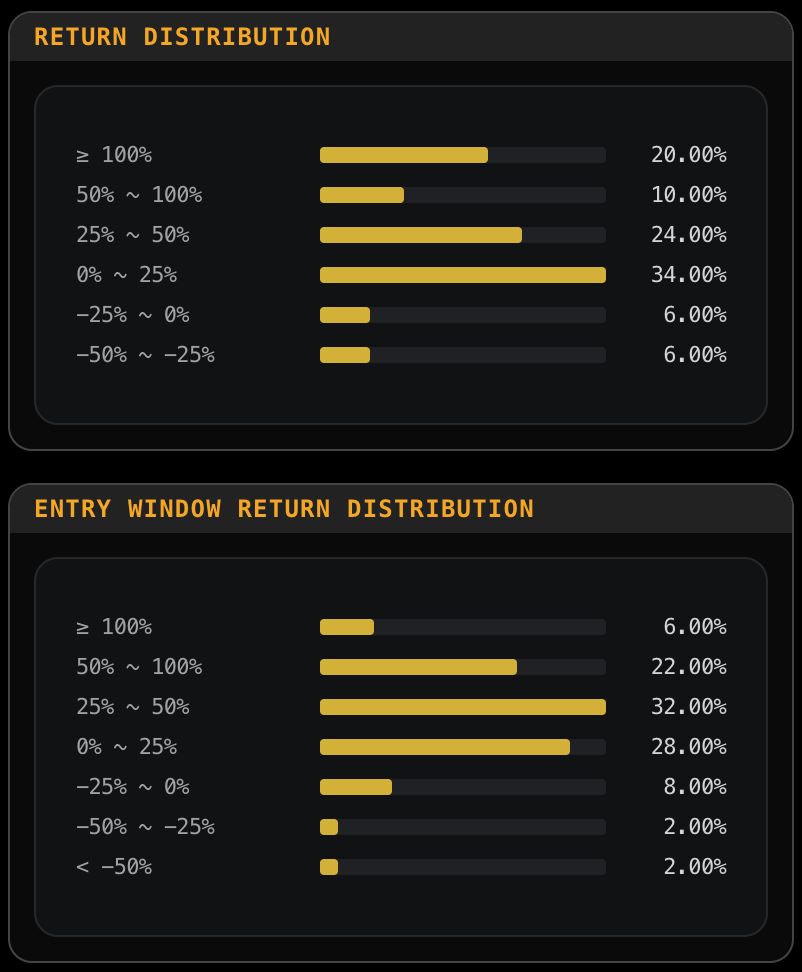
Compare its realized returns with the entry-window return distribution.
Some traders are strong at exits → copy-sell can make sense.
Others show a much stronger entry-window signal → the opportunity may come before the lead wallet exits.
That creates extra capacity from the same strategy:
**Enter. Capture the window. Exit before the lead wallet.**
A capability available to Phoenix Research users.
Where does a high-entry-Sharpe trader actually make money?
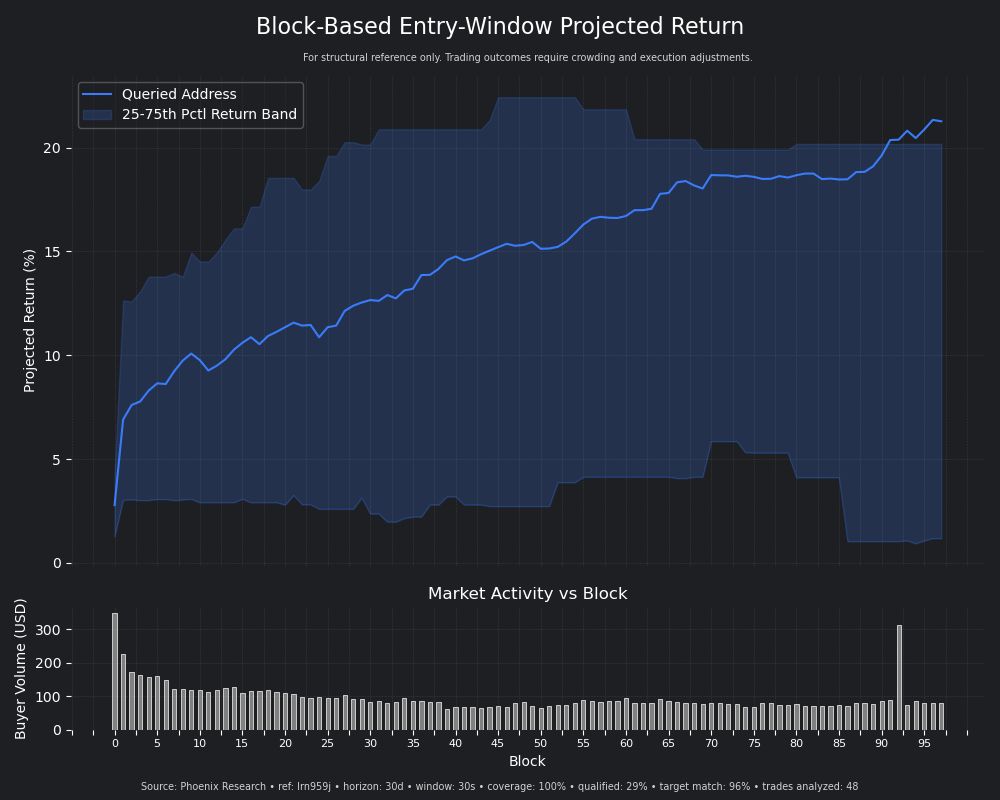
Overall return: 20%.
But Driver Analysis tells a very different story.
Break it down by entry price, most profit comes from <$5.3K entry cap.
That concentration pushes the average equity curve toward the 75th percentile of the return band.
The takeaway?
**Don’t just measure the signal. Find where its value is concentrated.**
A top dev’s entry window:
* 11 recent mints, 600% avg return at peaks — in just the first few seconds.
* 91% of them cleared 100%+ profit.
Strong signal for snipers.
Phoenix Research turns wallet history into an actionable view of when the signal peaks — and how fast it fades
Some traders are simply built for low-cap.
152 recent trades reveal a clear signal window:
* $5.4K–$19.4K entry cap
* First 2 minutes on entry
That’s where this trader’s signal carried the most value.
Other ranges can work too — but they demand tighter entry timing and take-profit settings, with more scrutiny.
**Driver Analysis shows you where a trader’s signal actually works.**
Don’t just find a wallet.
**Find its operating range.**
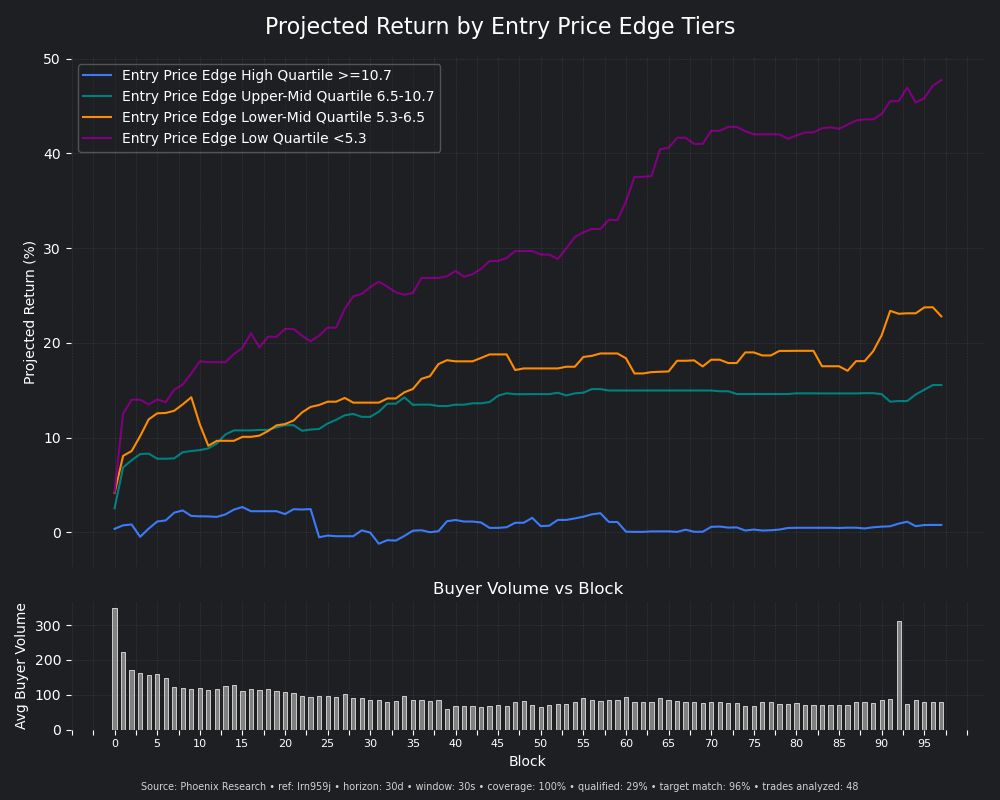
Can you actually copy a top copy trader?
Not by simply copying every trade.
The real question is: where does the trader generate returns?
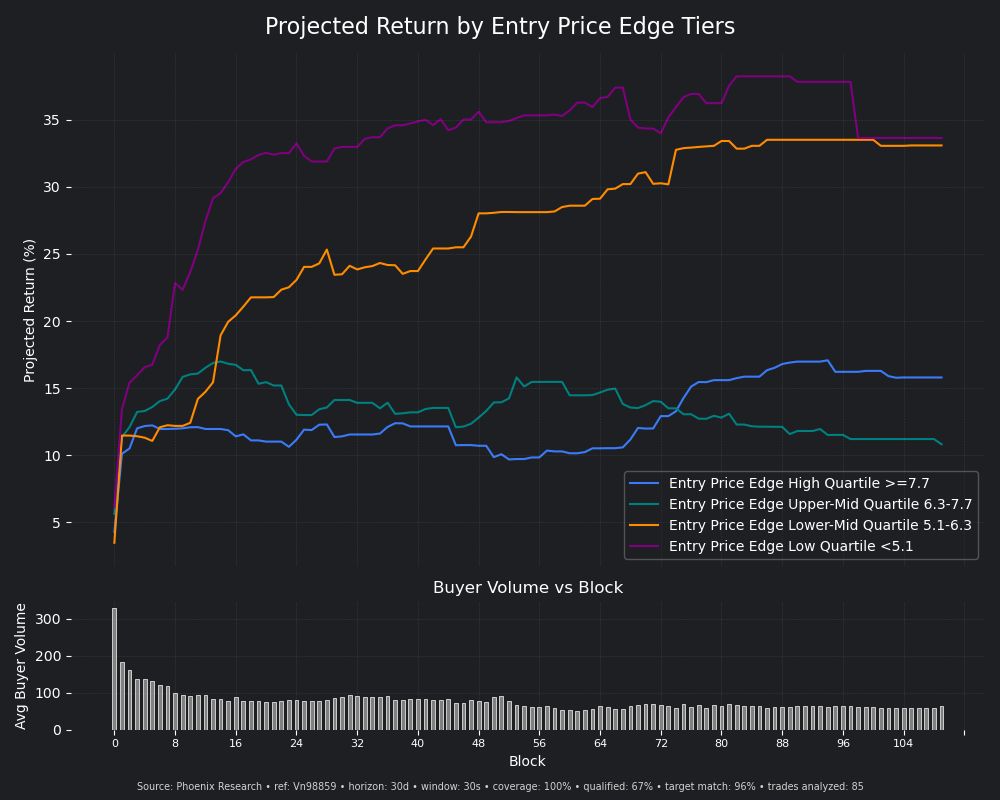
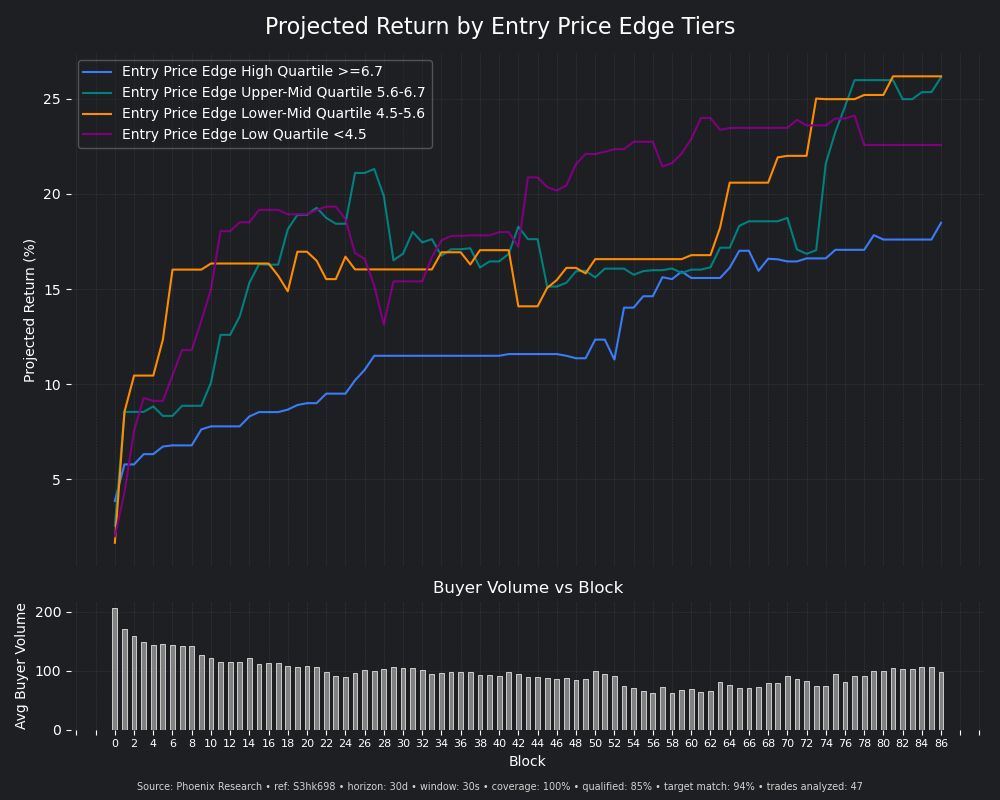
This chart breaks down a top copy trader’s entry-window performance by entry price — 190 trades over 3 days.
At the low-cap end (purple, orange), elite copiers and snipers can consume most of their capacity quickly. Performance plateaued and dropped shortly after.
But toward higher cap (green, blue), something interesting happens:
The equity curve can keep climbing — while meaningful opportunities remain.
That’s where Driver Analysis becomes useful.
Study how top copiers trade.
See how they utilize high-signal wallets.
Identify where performance comes from across different entry conditions.
Then turn those observations into your own actionable trading plan — from low-cap opportunities to higher-cap setups.
**Don’t just copy the trade. Study the behavior behind the returns.**
Phoenix Research™
Same wallet. Same 30-second entry window. Different performance profile.
We compared the recent trades with trades 2 weeks ago. The shift is clear:
• < $6.3K entry cap → stronger returns today
• > $6.3K entry cap → weaker returns today
The market has been strong lately — but the important question is where the performance is actually coming from.
Phoenix Research breaks wallet performance down by entry market price, making it possible to see how a wallet’s short-horizon returns are being attributed across different entry conditions.
Not just:
“Did this wallet perform?”
But:
“At what entry conditions did it perform — and has that changed?”
That distinction matters when evaluating wallet behavior in a changing market.
We are tracking these patterns across a growing set of wallets.
Not just who wins, but how entry window performance shapes outcomes.
Clear signals are emerging.
Happy to share additional examples for those exploring this further.
Most think token creators take all the edge.
Not always.
• This dev averages 20+ SOL on creation
• Takes up most of the liquidity
• ~96% win rate
Yet top copiers still extract ~20% consistently.
Same trades — very different outcomes depending on entry + exit timing.
You can scroll a few trades and “feel” the edge.
We quantify it across 20+ recent trades.
Clear pattern in entry windows.
Consistent dispersion between lead vs followers.
Less guessing.
Faster research.
More certainty.
Most traders focus on what wallets buy.
We focus on how they enter.
Entry timing, return drivers, follower dynamics, liquidity context, structural patterns — not surface-level PnL alone.
We’ve put together a simple page on this:
https://t.co/UuLUf9RiJD
Limited access for now
Appreciate the balanced review.
One thing that stood out — professional charts and in-depth attribution most tools don’t offer, with strong focus on entry timing & real trading edges.
The focus on how outcomes vary even when the same wallets are followed.
That’s exactly the gap we’re trying to solve: behavior and timing, not just picks.
Still early, and feedback like this helps shape it further.
Just tested Phoenix Research (@PhoenixResAI), an AI-powered wallet intelligence tool for Solana traders. Built and used by veteran HF traders. Deep on-chain analytics, high-signal wallet tracking, and actionable insights — all inside Discord. Preview impressions after testing a few wallets #Solana #Web3
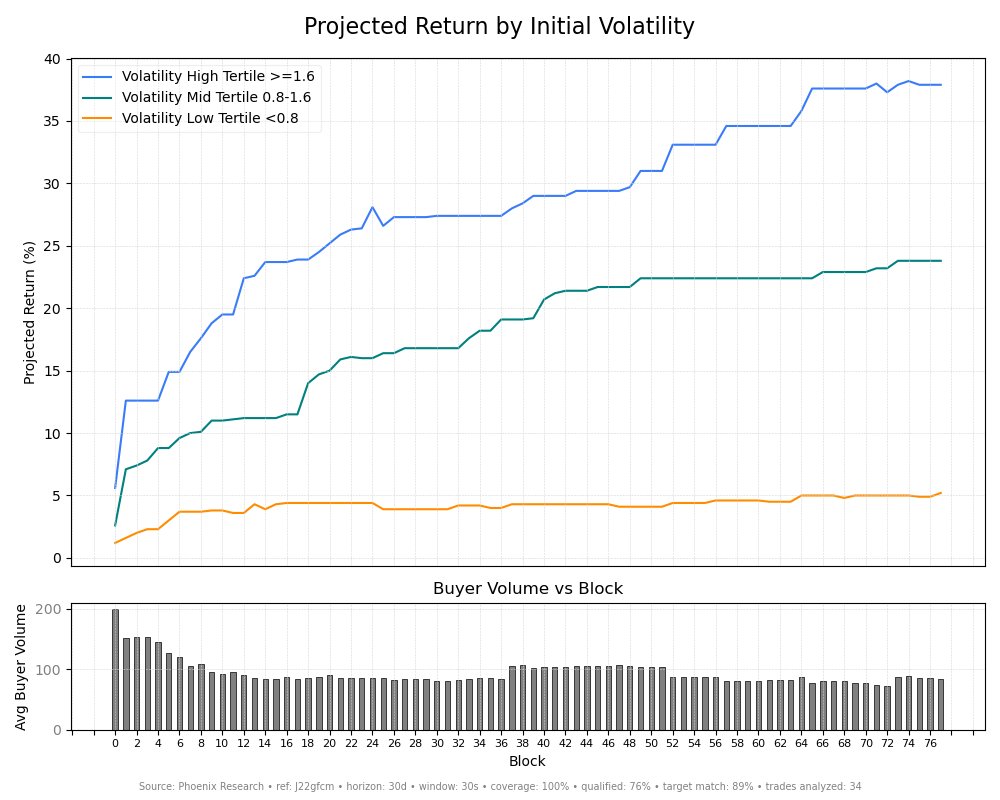
For this trader, initial volatility at entry strongly predicts performance.
Low volatility trades underperform.
High volatility trades drive returns.
A simple filter changes everything.
You could have known.
All it takes is this chart — and Query Lab to surface it.
Elite traders typically build from 50–100 wallets.
Our Wallet Network tracks ~1,000 — and growing.
You don’t just find your 100 here.
It’s far more high-signal wallets than you ever need.
And with Query Lab, you surface even more on demand.
Depth of signal changes the game.
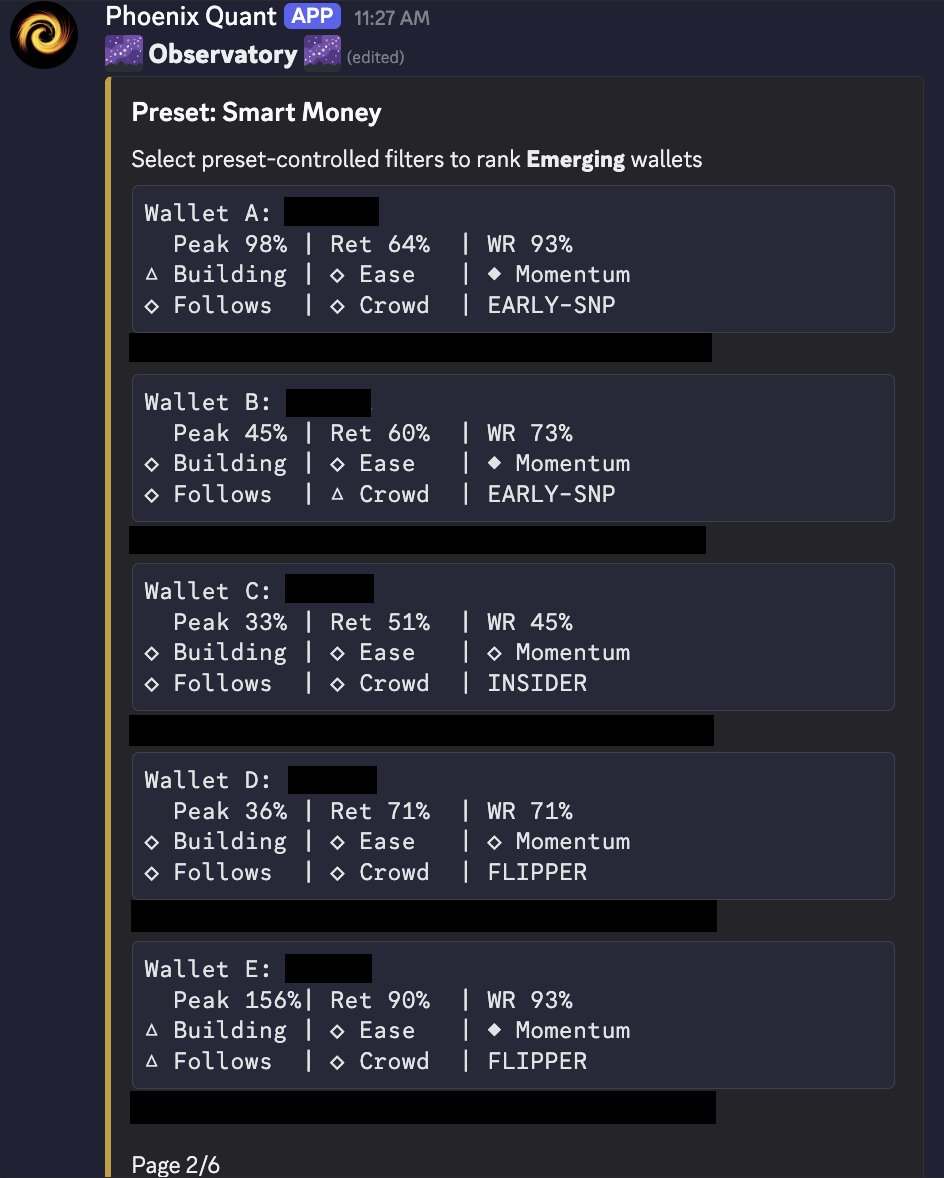
The Emerging cohort surfaces high-performing wallets shortly after creation.
We scan the chain daily to identify conviction early:
• Before broader trend recognition
• Before crowd saturation
• Before signal degradation
3 recently discovered wallets below.
@mrsoloffical early stage — focused on building a high-signal wallet intelligence layer first
long term: more features, better discovery + interpretation, less noise
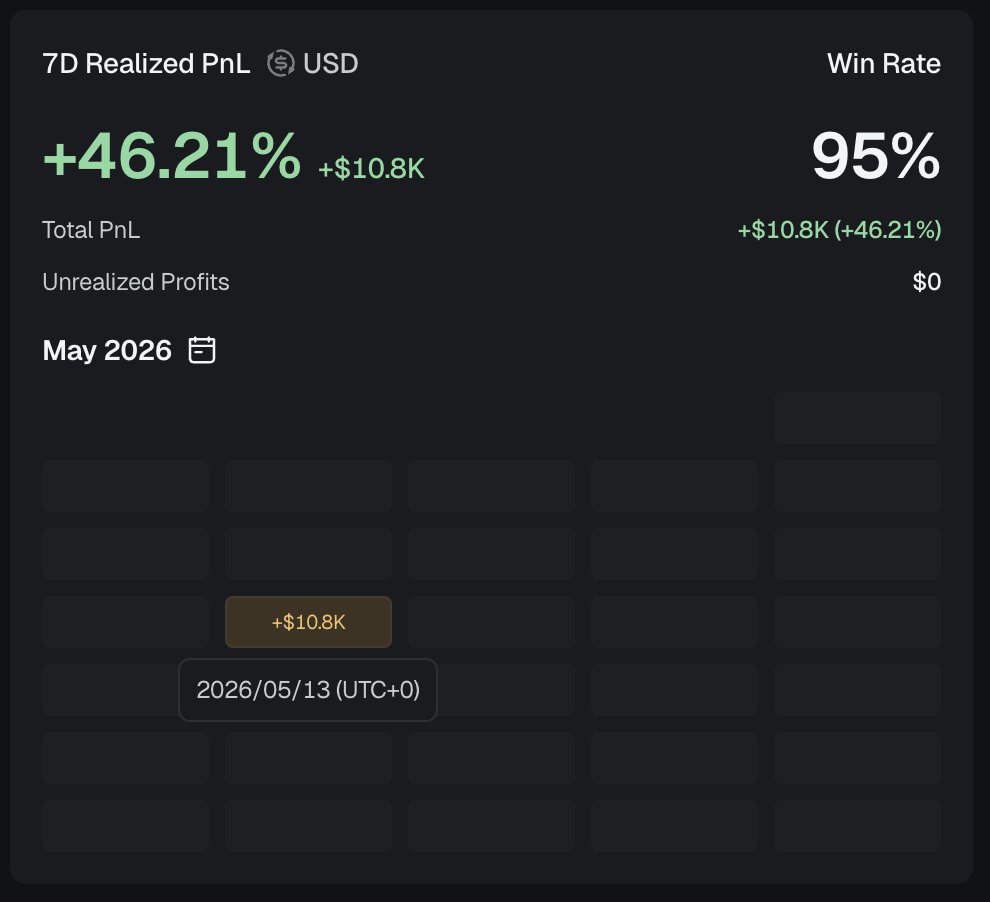
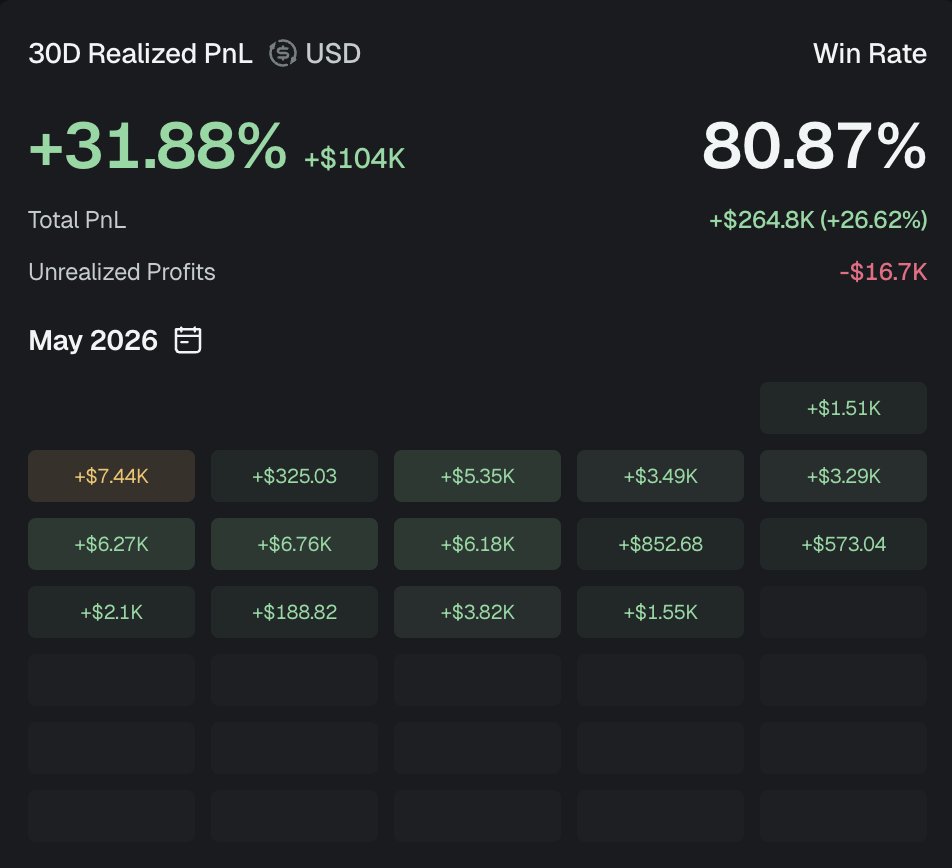
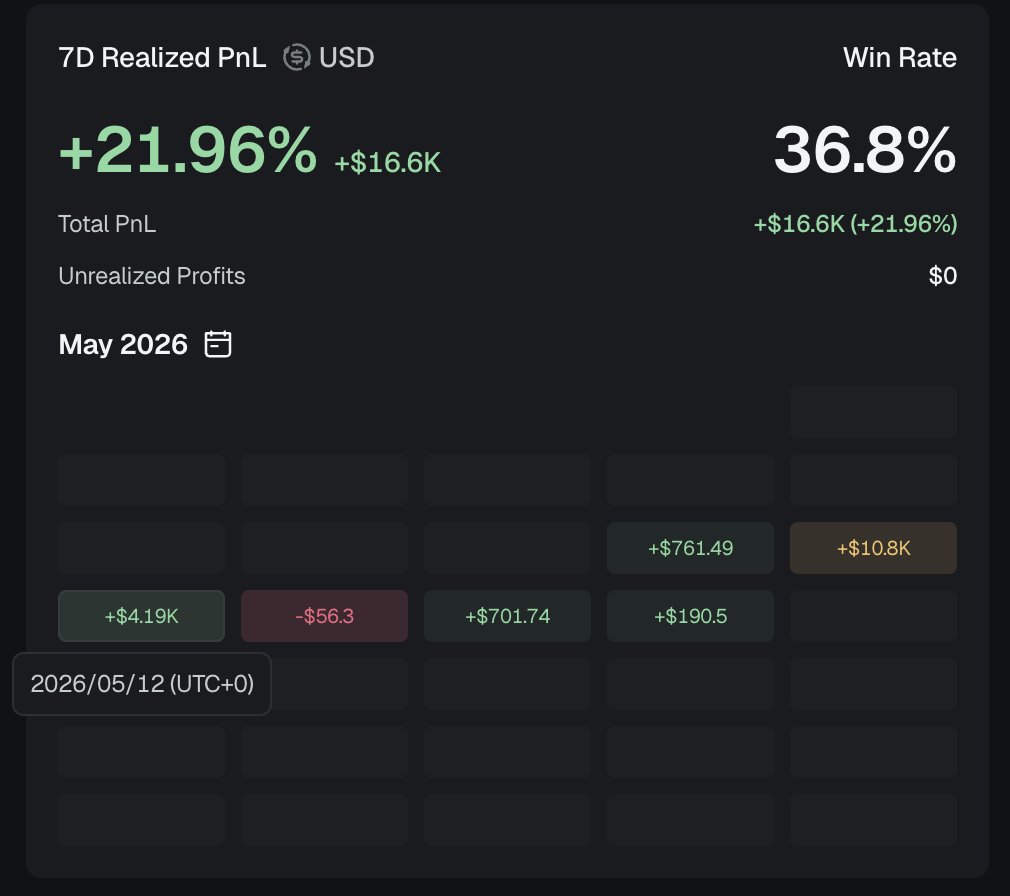
Consistency is rare—but measurable.
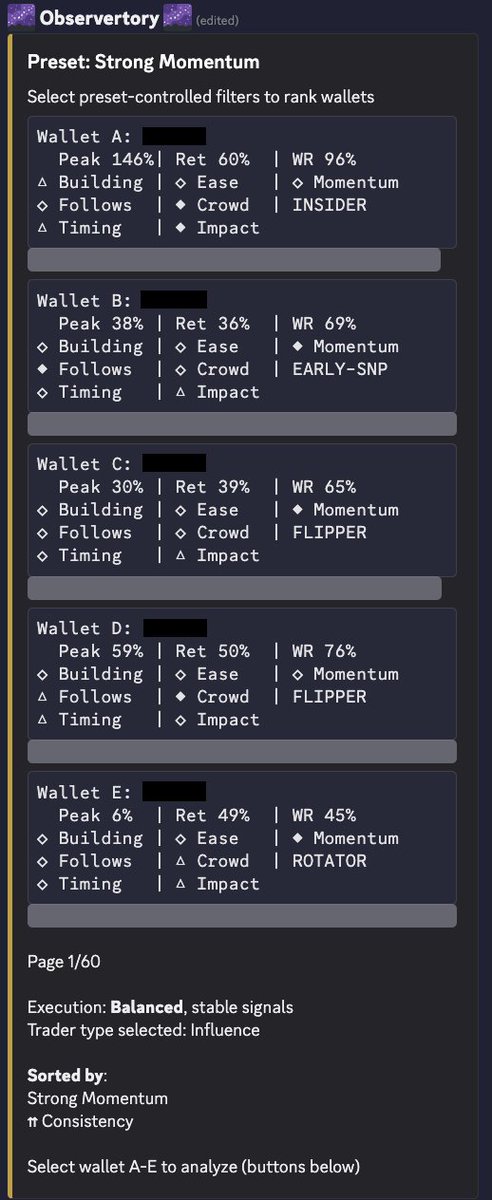
These are top wallets ranked by our Consistency filter:
All 5 show:
• Strong returns on most days
• Minimal down periods
Steady execution over time wins.
Consistency surfaces a class of wallets—not the loudest, but the most repeatable.