One of my favourite parts of the new playerprint setup on Playback90 is how quickly you can navigate through different sections.
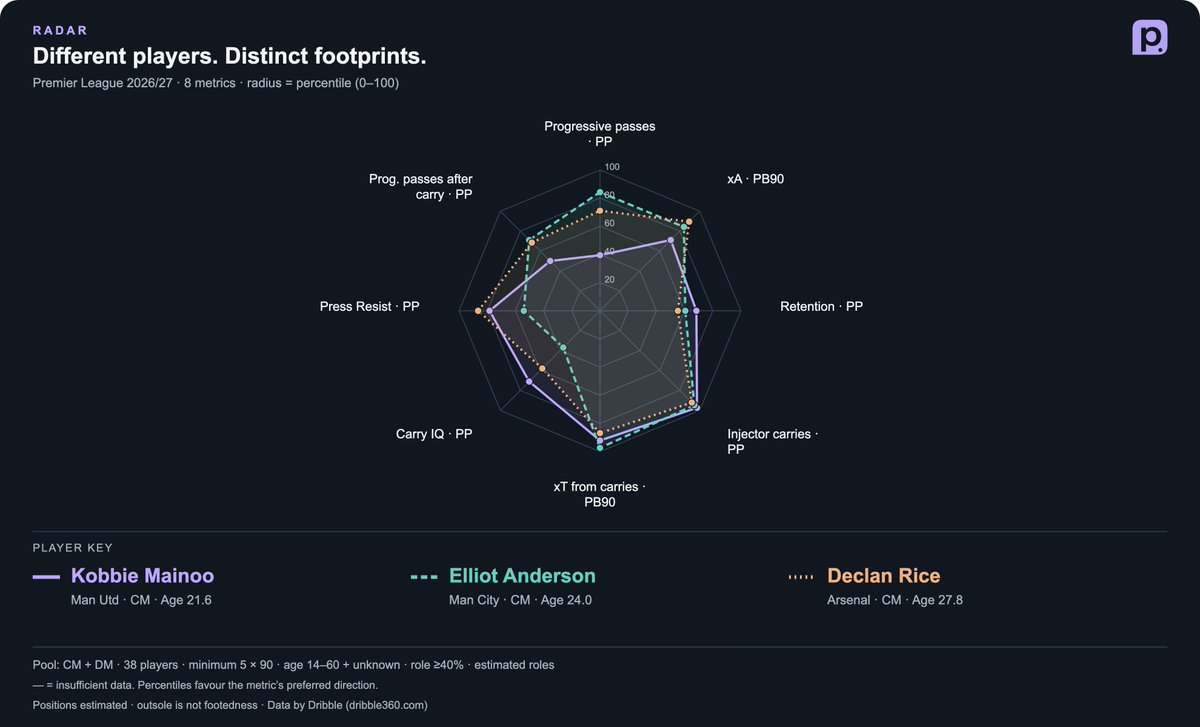
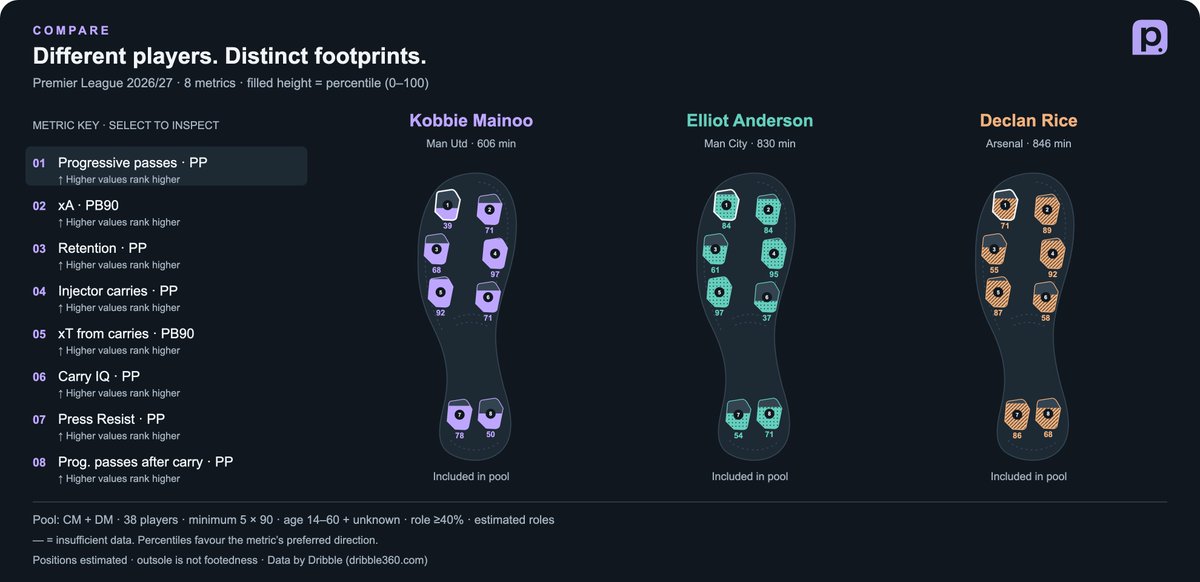
Here is Mainoo vs Anderson vs Rice comparison in two distinct visual styles: a standard radar chart and a boot-print comparison.
Very pleased to announce that Playback90 has collaborated with Pranav to bring on his work from Playerprint onto the app.
Check out the new feature at - https://t.co/yZJorJMIKr
You asked for it. Playerprint is BACK. 🟣
Now part of @Playback90app, with signature bootprints, 170 metrics and 6 leagues to explore.
Who progresses the ball? Who carries with purpose? What happens after they win it back?
Dig into decision-making, tempo, link-up play and more. Compare players, find outliers and put your next scouting shout to the test.
Link below!
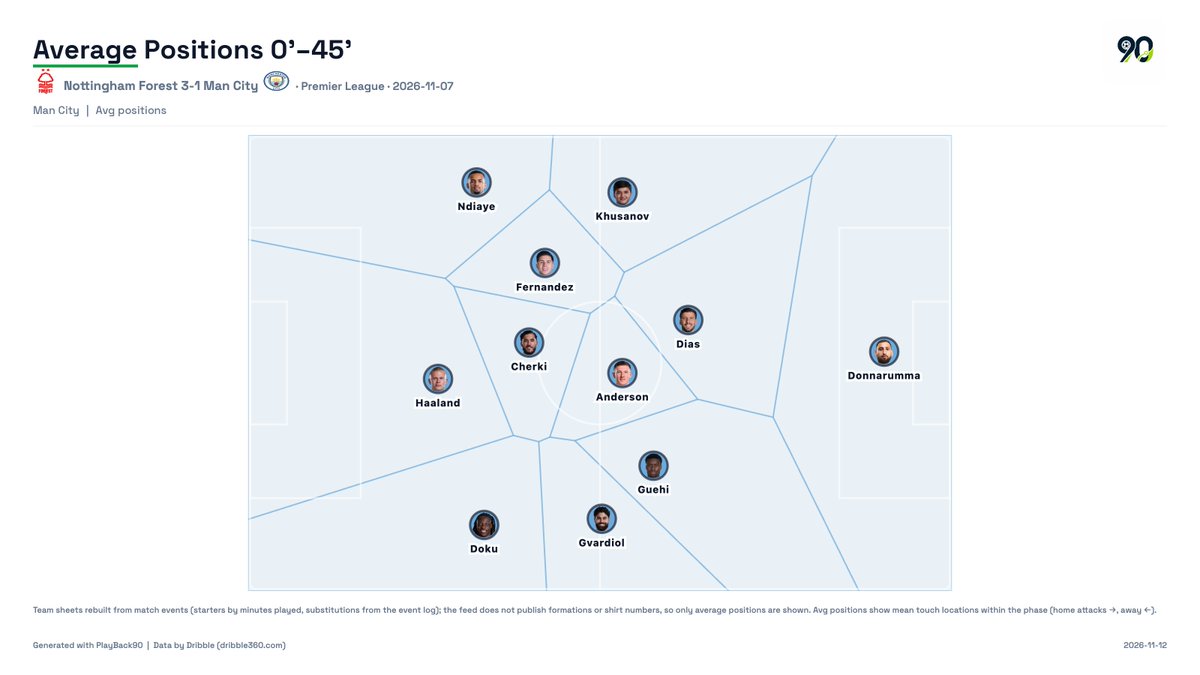
Forest 3-1 Man City: City's average positions by phase. Their midfielders sat 16-19 m apart on average.
All 3 Forest goals came within 16 seconds of a City turnover, two after carries through the middle: Delap 47 m, Gibbs-White 26 m.
#MCFC
Lots to like about Victor Munoz under Iraola. He is really good at speeding ip the tempo of the game.
89th percentile for injector carries as well as aggression ratio. Map shows that he is more comfortable passing on the RHS. 95th percentile for injector threat, which is the number of injectors reaching the final third.
Serie A's best young creators and dribblers after 10 matches. Among under-23s with 330+ minutes, Como's Assane Diao is clear: 2.7 key passes and 2.1 dribbles won in the final third per 90.
Njie, Mastantuono and Alajbegovic follow.
Spurs have finally picked up their form and slowly climbing up the table in the past few weeks
Can they get their third win in a row today away at Leeds?
Season Analysis is now live on PlayBack90
Compare teams and players in the top five leagues and MLS back to 2024/25, plus this season's Champions League and Europa League.
https://t.co/77MsFCPQVz
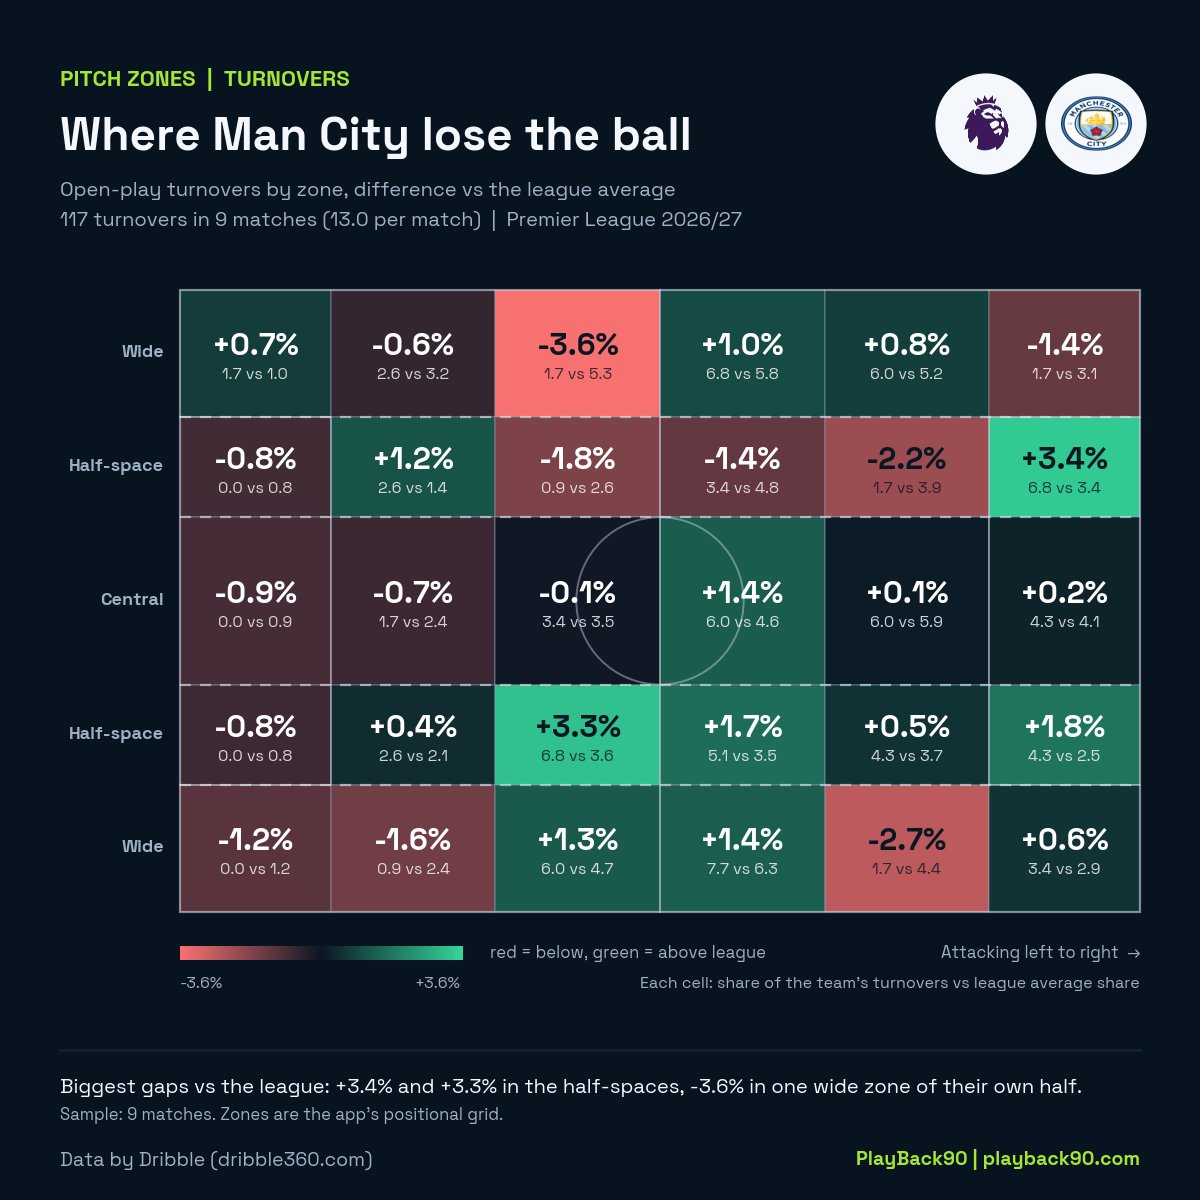
Where do Man City lose the ball? Open-play turnovers by zone, 9 matches.
Most above the league: 6.8% in one final-third half-space (league 3.4%) and 6.8% in a half-space in their own half (3.6%).
Try it out for other clubs at
https://t.co/vPU7Yfml4L > Season analysis
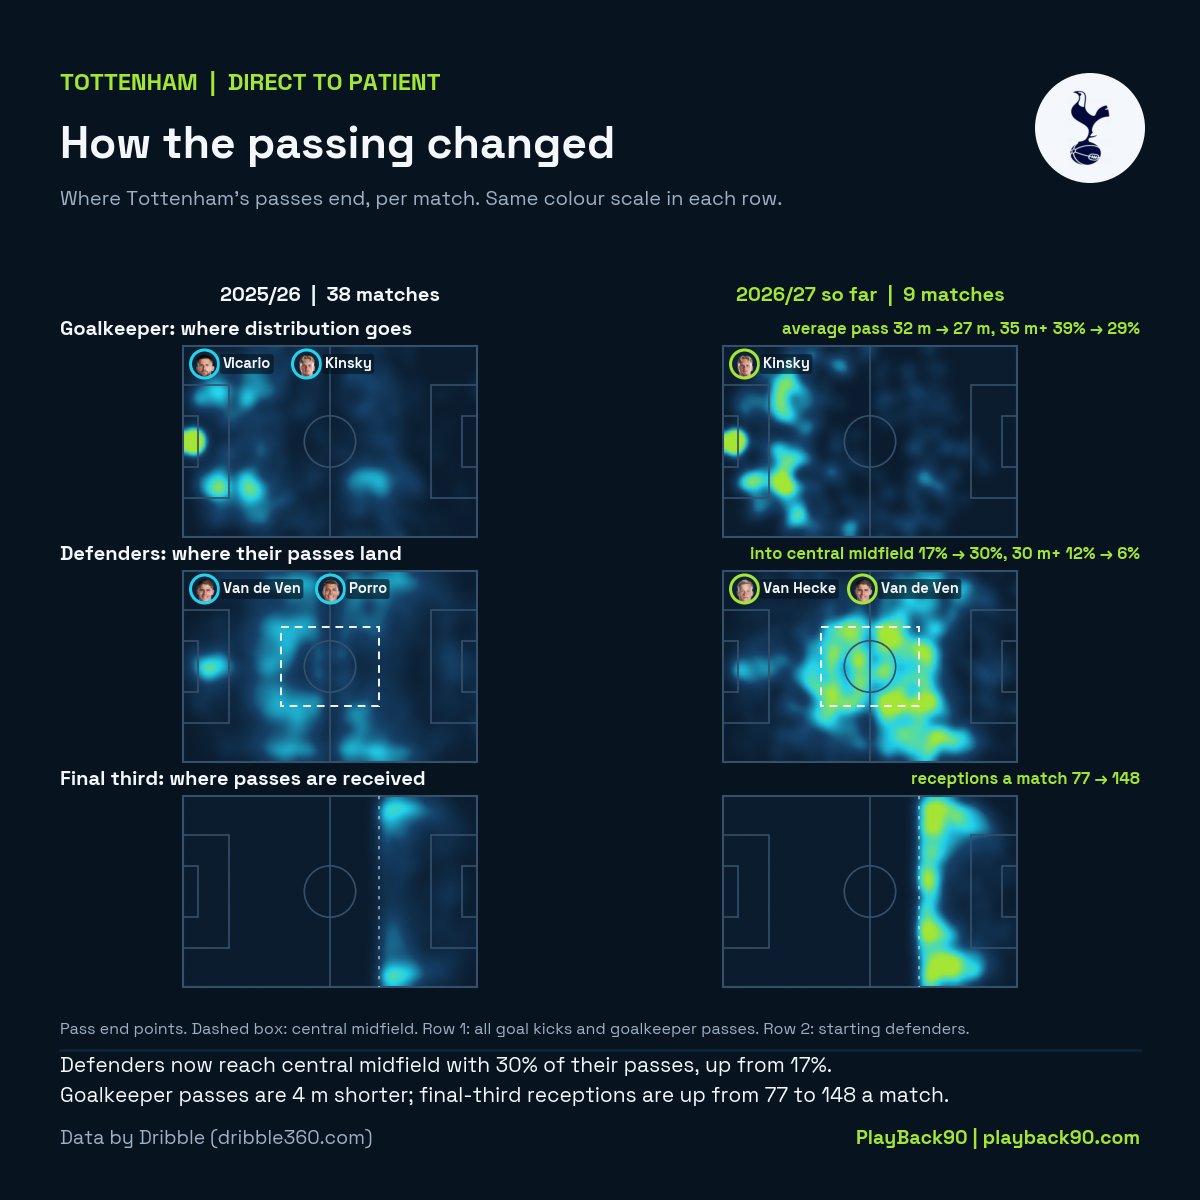
Van Hecke (81 passes per 90) and Van de Ven (78). On our BuildUp Directness measure (0 patient, 100 direct)
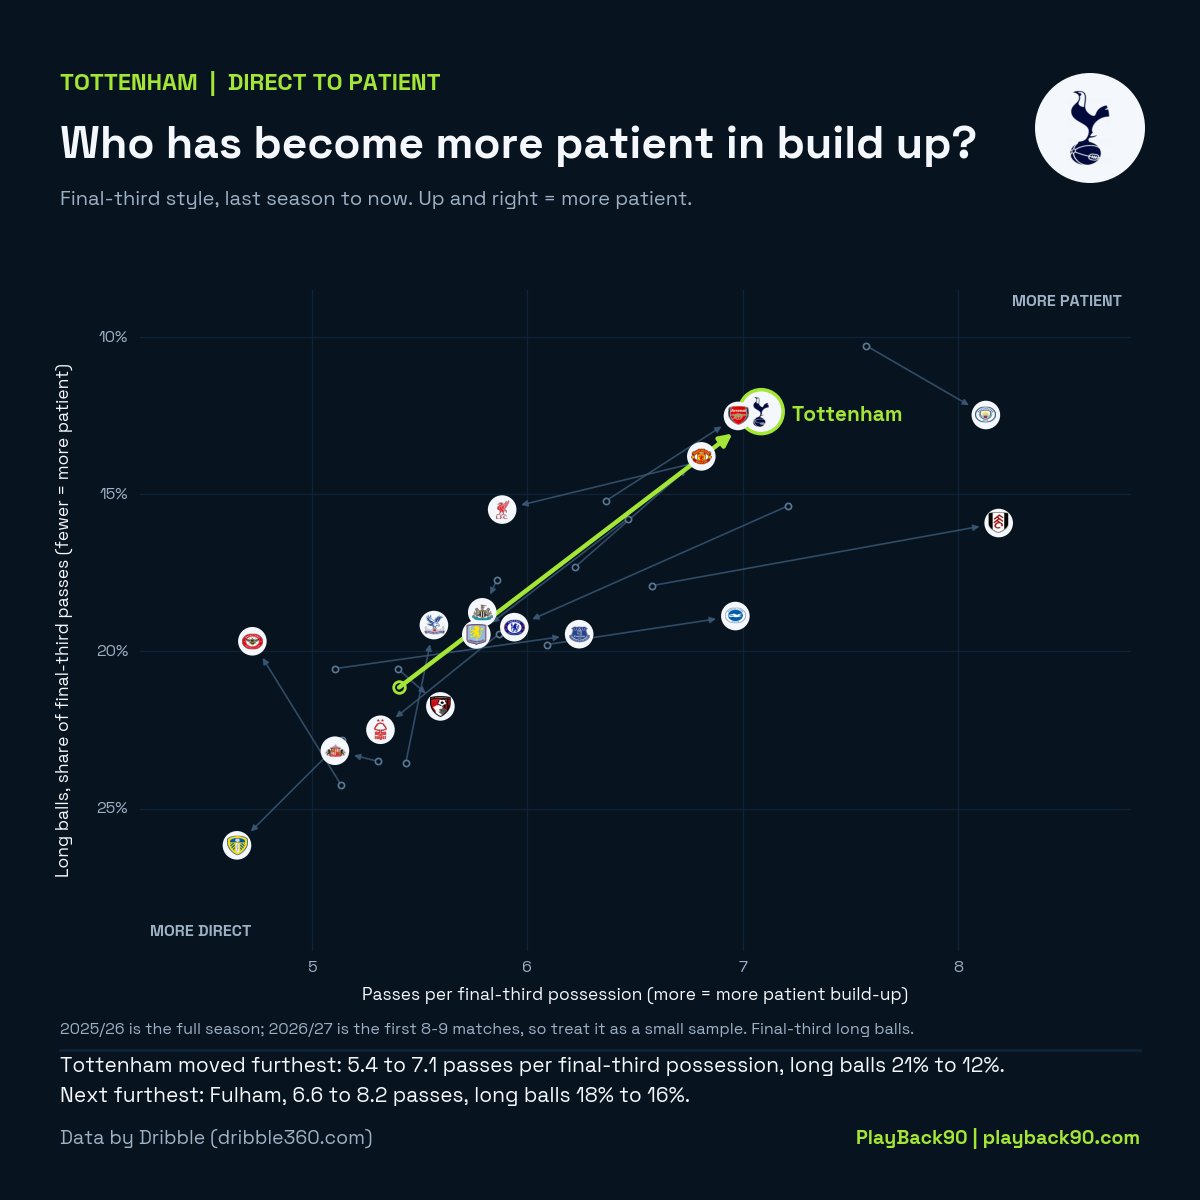
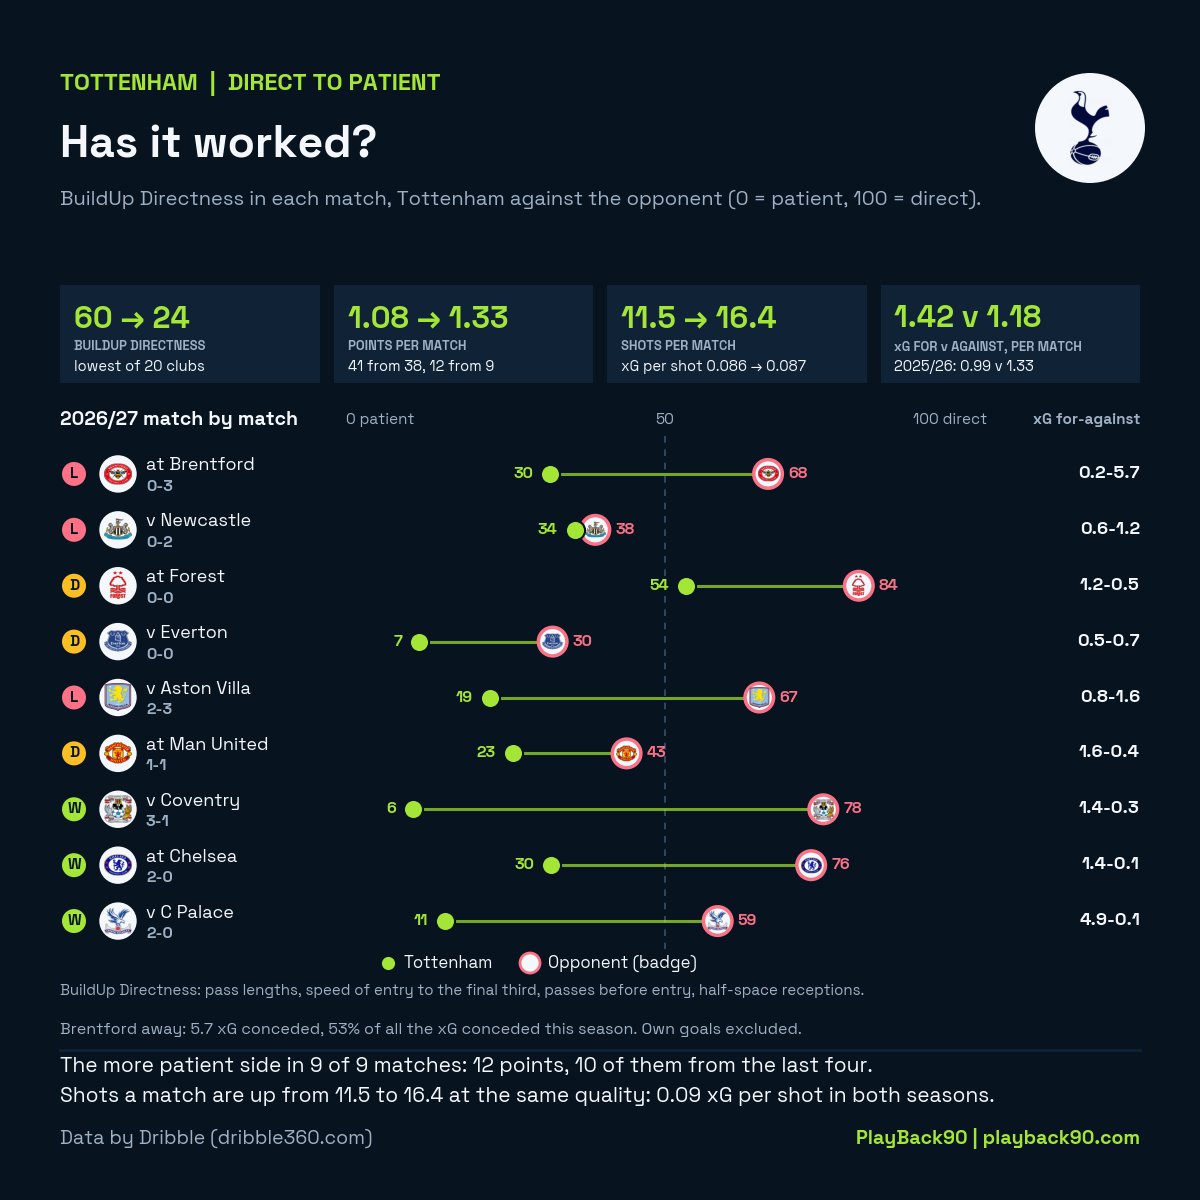
Tottenham were the more patient side in all 9 matches: 12 points, 10 from the last four.
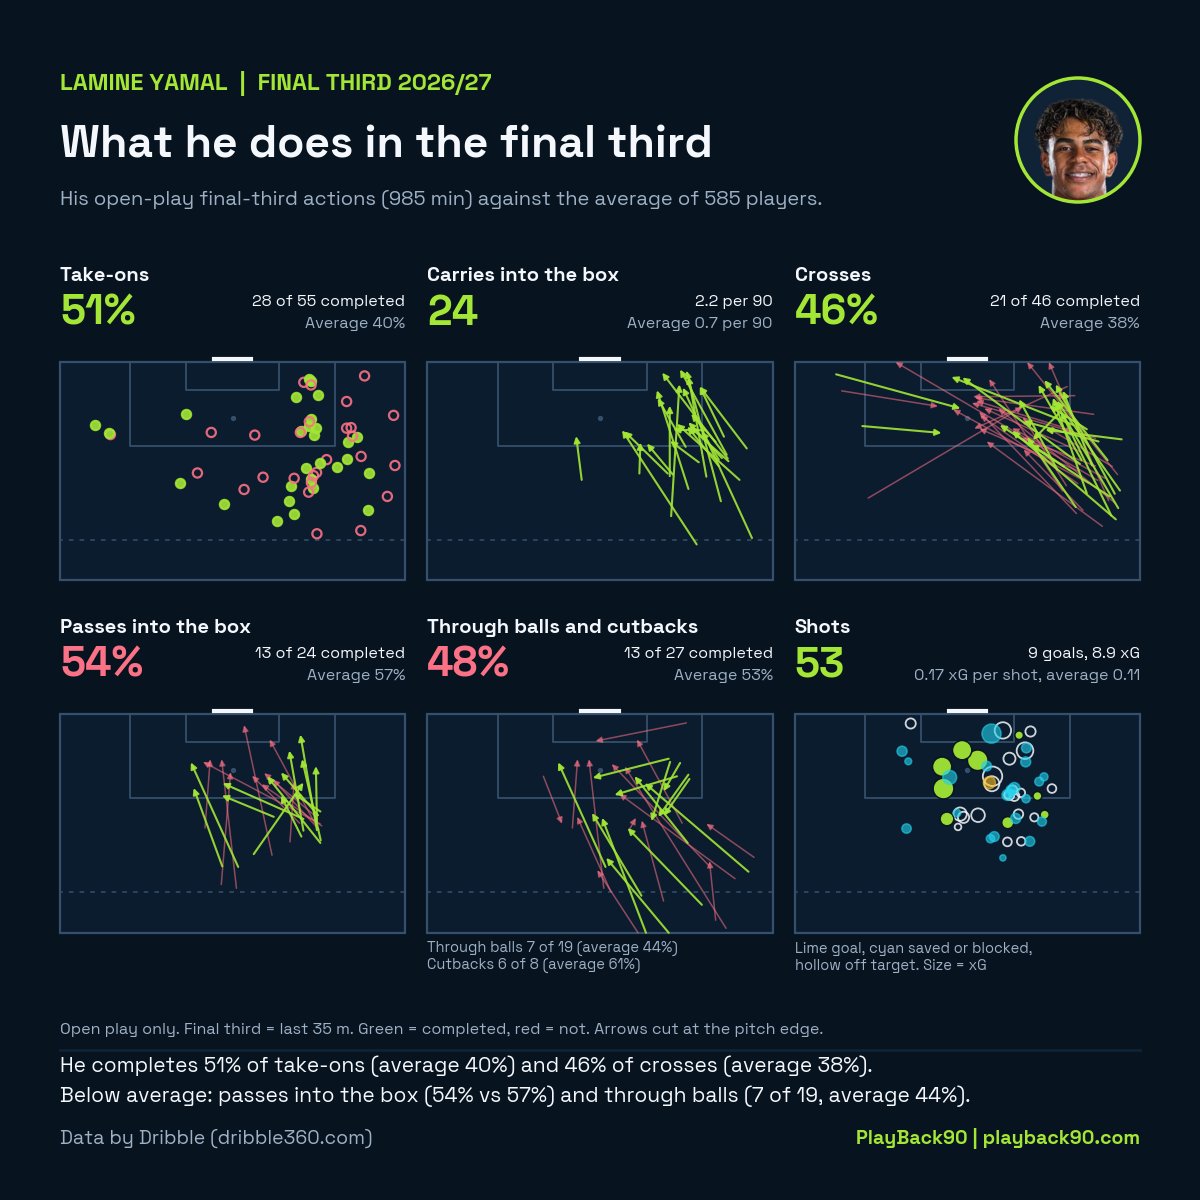
Why Lamine Yamal is among the most dangerous in the final third: 10th for open-play usage and 14th for danger, of 585 top-five-league players.
51% of his take-ons succeed (average 40%). Ranking, actions, touch map, peers.
#Yamal#FCBarcelona
Who creates the most chances from each part of the pitch? 🎯
Shot-creating actions per 90 by zone, Premier League 2026/27.
Each zone shows its leader, and the dot shapes show how the action was made: pass, carry, take-on, defensive action or rebound shot.
Why? 152 shots, 2nd most in the league, but 70% were under 0.05 xG, and 0 goals came from 27 shots worth 0.05 to 0.20. No single player explains it.
Next: four top-6 sides in the first five games, then six against sides ranked 11th to 17th.
Nottingham Forest are 19th on 6 points. Their chances were worth 12.8 expected points: 9th.
They have led in 4 of 9 matches and won one. 6 goals from 11.5 xG is the biggest gap in the league.
#NFFC#PremierLeague
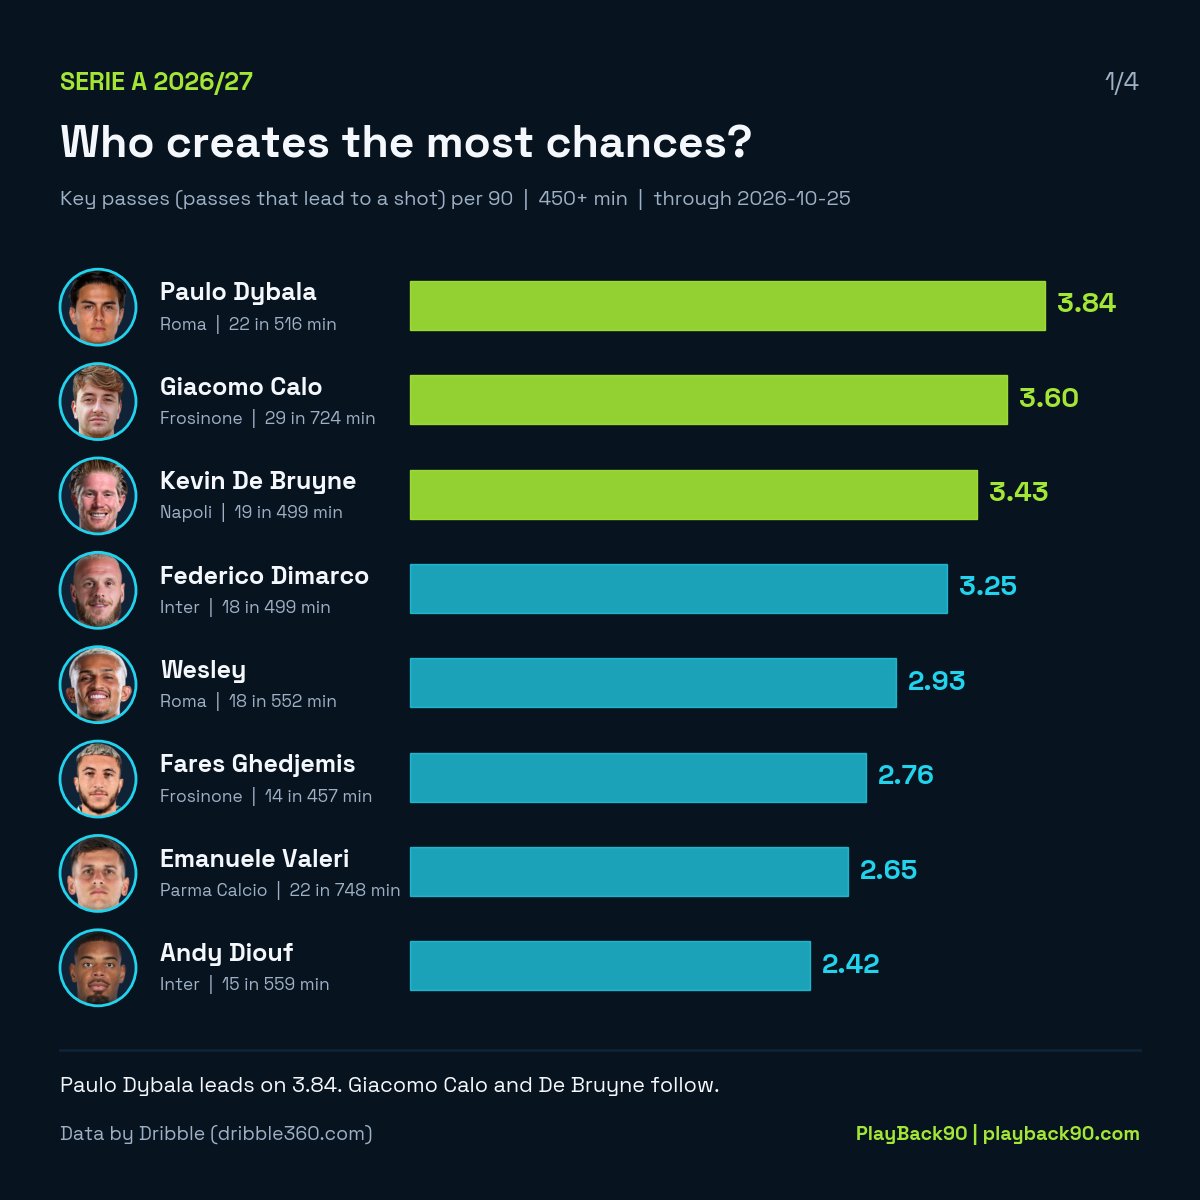
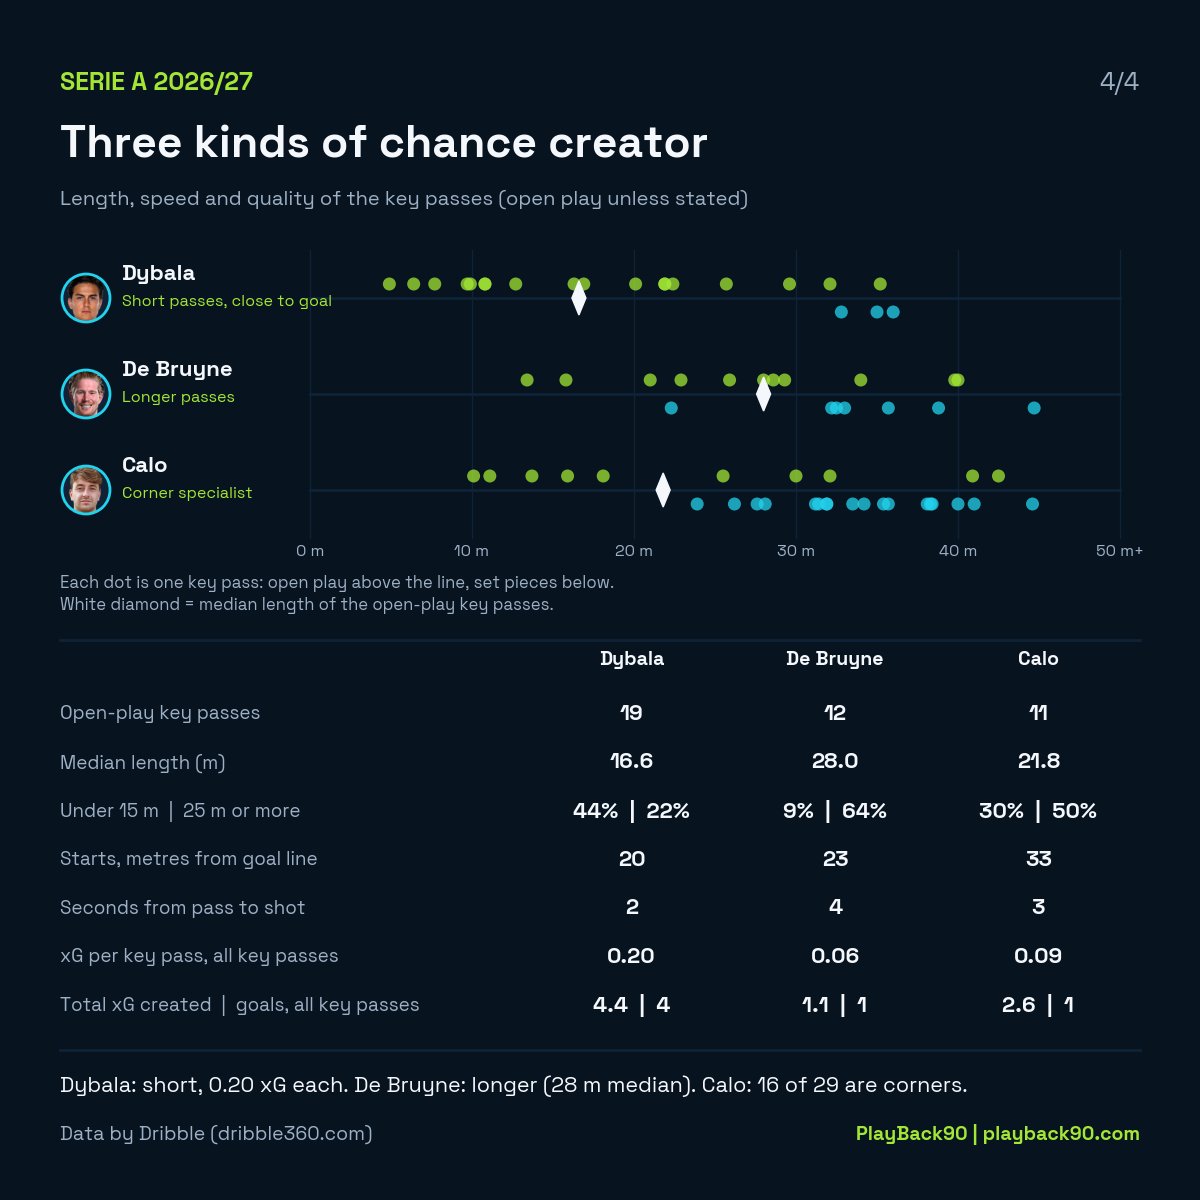
Who creates the most chances in Serie A? Dybala leads on 3.84 key passes per 90. But the top three differ: Dybala's are short and worth 0.20 xG each, De Bruyne's are the longest (28 m median), and 62% of Calo's come from set pieces.
#SerieA#FootballAnalytics
PlayBack90 is back online. 🟢
The 2026/27 season is live: Premier League, LaLiga, Serie A, Bundesliga, Ligue 1, MLS, Champions League and Europa League.
More features landing soon.
https://t.co/vPU7Yfml4L