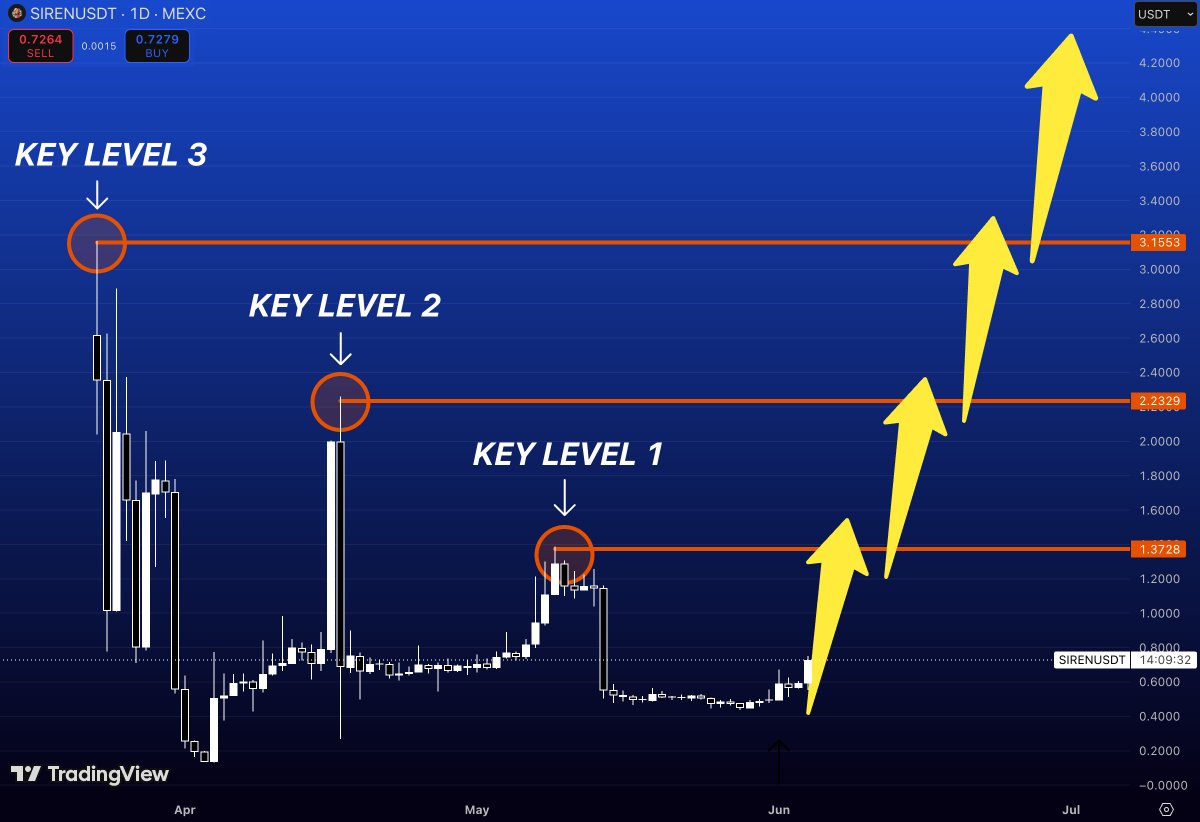
$SIREN feels like that one player nobody drafts…
Until he starts dropping 40 points every game.
The chart spent weeks doing absolutely nothing.
Boring.
Ignored.
Forgotten.
Exactly the kind of setup that puts traders to sleep.
Now look what’s sitting overhead:
🎯 $1.37
🎯 $2.23
🎯 $3.15
Three major resistance levels.
Three places where previous rallies ran out of gas.
And three levels that could become magnets if momentum keeps building.
The funny thing about crypto is that everyone wants a 5x.
Nobody wants to buy before the first 2x.
At $0.72, $SIREN still looks like a random small-cap to most people.
But if it starts reclaiming those levels one by one?
The same crowd will suddenly discover the project and explain why they were bullish all along.
I’ve watched this movie too many times
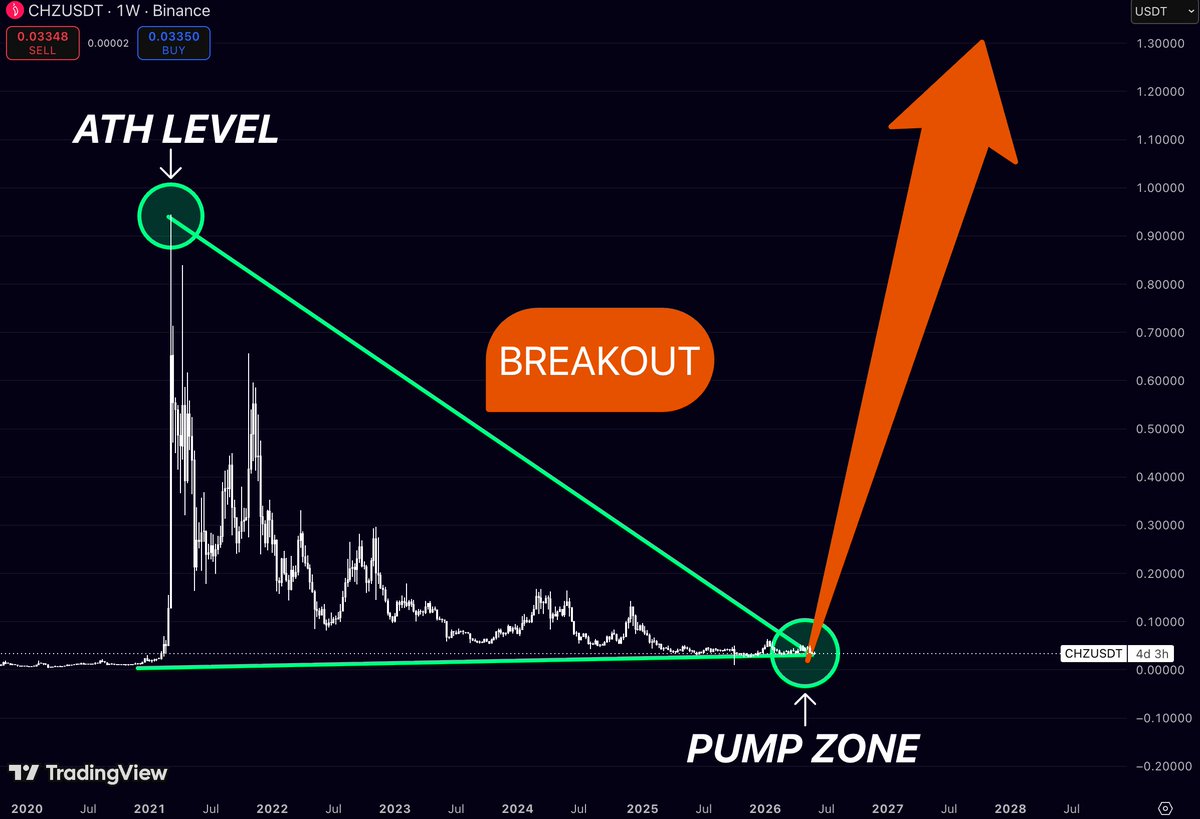
$CHZ is giving off serious “everyone forgot about me” energy
Back in 2021, Chiliz was one of the hottest narratives in crypto
Fan tokens, sports partnerships, stadium hype
it had everything
Then came the brutal part:
Four years of bleeding
Lower highs
Lower lows
Most holders probably stopped checking the chart
And that’s exactly what makes this setup interesting
The entire downtrend from the ATH has now compressed into a massive wedge
while price is sitting right on a multi-year support zone that has been defended again and again
The chart is basically screaming:
ATH resistance: ~$0.95
Current zone: historical accumulation area
Potential breakout: if $CHZ escapes this multi-year downtrend, the move could be violent
Think about it:
In 2021 people were chasing $CHZ near $1.
Today it’s trading around $0.03 and almost nobody is talking about it
Crypto has a funny habit of making the crowd buy tops and ignore bottoms
Will $CHZ return to its old glory?
Nobody knows
But if this giant multi-year base turns into a breakout, today’s chart could end up looking less like a graveyard and more like the launchpad nobody noticed
$VVV is doing something most traders never get to witness.
Not because the chart is complicated.
Because parabolic trends make people uncomfortable.
Every time price goes vertical, the crowd starts asking the same question:
“Is it too late?”
The funny part?
They’ve been asking that question since $10.
Then again at $20.
Then at $50.
And now they’re asking it near $100.
The chart couldn’t be clearer.
$100.55 is the level everyone is watching.
Not because it’s random.
Because round numbers become psychological battlegrounds.
That’s where early buyers take profits.
That’s where late buyers hesitate.
And that’s where strong trends prove they’re still strong.
What’s interesting is that $VVV didn’t crawl toward this level.
It exploded into it.
That matters.
Markets that spend months struggling beneath resistance usually get rejected.
Markets that arrive at resistance like a freight train often have unfinished business.
Right now, price is sitting directly beneath the first triple-digit milestone in its history.
And if buyers manage to turn $100 from resistance into support, the conversation changes completely.
At that point, traders stop asking whether $100 is possible.
They start asking how high the next leg can go.
The hardest thing in crypto isn’t finding strong trends.
It’s believing them while they’re happening.
And right now, $VVV is giving the market a very simple message:
“I’m not done yet.”
$LUNC is approaching the exact levels that stopped every major recovery attempt after the collapse
And the next reaction could determine whether this is another relief rally or the beginning of a much larger trend reversal
Most traders still associate $LUNC with what happened in 2022
What matters now is the structure that has been forming ever since
The chart highlights three major resistance zones that repeatedly rejected price during previous recovery attempts:
Target 1 - 0.00017885
Target 2 - 0.00027615
Target 3 - 0.00064451
Each level comes directly from historical turning points where bullish momentum failed and sellers regained control
What’s interesting is that $LUNC hasn’t reclaimed any of them yet
After spending years building a base near cycle lows, price is only now beginning to advance toward the first major resistance zone
The first test sits at 0.00017885
This level marked the peak of a significant recovery rally during 2024 before the market rolled over again
If buyers manage to break through it, the next major objective becomes 0.00027615
That’s another historical rejection area where previous upside momentum stalled
But the level that could attract the most attention is much higher
0.00064451 represents one of the most important resistance zones on the entire chart
It’s the area where a major post-collapse rally ultimately failed and sellers regained full control
Markets often revisit the same levels that defined previous cycles
And when a multi-year accumulation range begins to expand, former rejection zones tend to become the roadmap for the next phase higher
If momentum continues building and buyers keep reclaiming historical resistance
$LUNC could be preparing for its first serious challenge of all three major post-collapse barriers
The base took years to build
The breakout phase often happens much faster than anyone expects
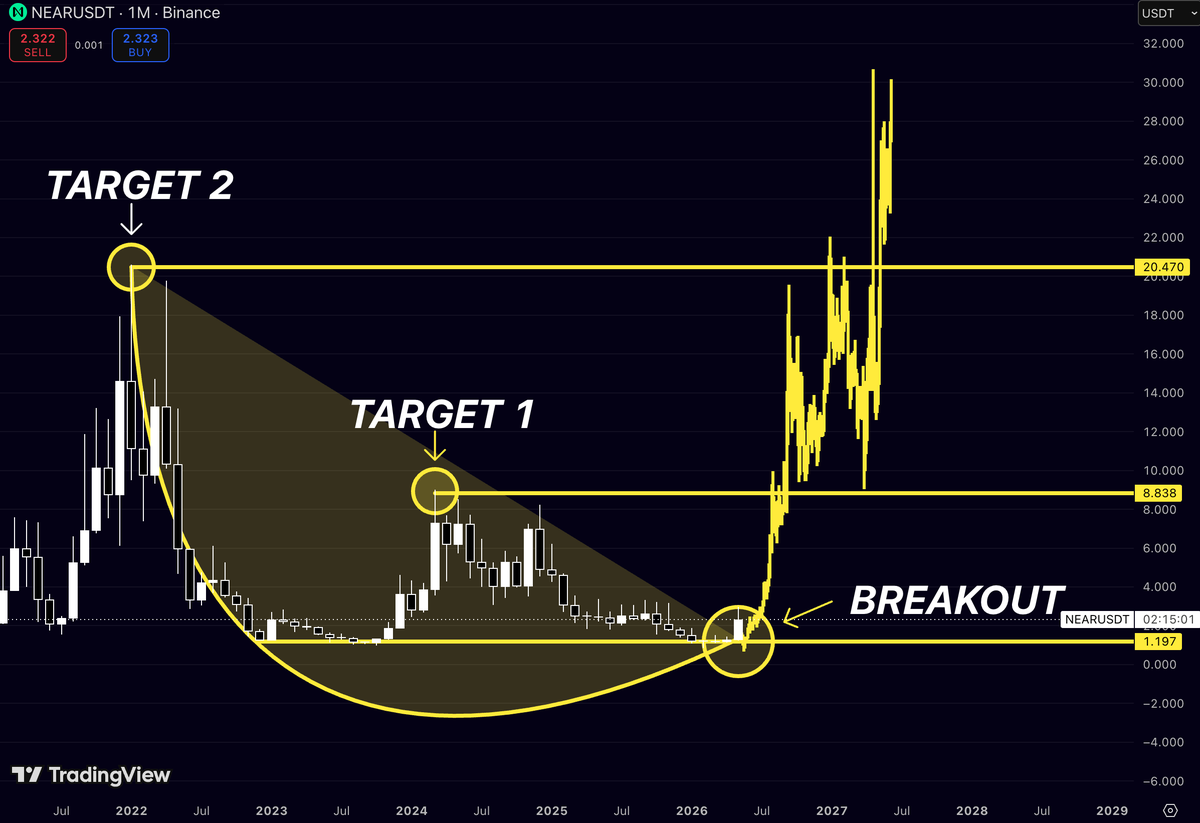
$NEAR has exploded out of the same accumulation zone that launched every major rally in its history
And the most important resistance levels are still sitting higher
Most traders are focused on the breakout that’s already happening
What matters now is where previous bull markets actually peaked
The chart highlights three major pump zones where $NEAR built a base before launching aggressive upside moves
Pump Zone 1 sparked the 2021 expansion
Pump Zone 2 formed before another powerful rally in 2023–2024
And now price has once again emerged from Pump Zone 3
What’s interesting is that all three accumulation areas formed around the same historical support region
Every time price returned to this zone, buyers stepped in and a major trend followed
The next key objectives are clearly visible:
Target 1 - $8.93
Target 2 - $20.54
These levels aren’t random
They represent major historical resistance zones where bullish momentum previously stalled and large market reversals began
The first target marks the top of the 2024 recovery structure
The second target comes directly from the peak of one of the strongest rallies in $NEAR history
What makes this setup interesting is that price isn’t approaching resistance from a position of weakness
It’s approaching after breaking out from a multi-year base that has already produced explosive moves multiple times before
Markets tend to leave clues
And the pattern on $NEAR is difficult to ignore:
Pump Zone 1 → Rally
Pump Zone 2 → Rally
Pump Zone 3 → ?
If buyers continue defending the current breakout structure
$NEAR could be entering the next phase of a move toward $8.93 and potentially even $20.54
Sometimes the biggest opportunities appear when history starts repeating itself
$ASTER is sitting below three levels that have controlled every major move since launch
And if buyers start reclaiming them one by one, this chart could look completely different in the months ahead
Most traders see a token that has been stuck in a range for months
What I’m watching is the structure forming beneath price
After the initial post-launch volatility
$ASTER spent months compressing into a tight base while momentum slowly faded across the market
Those periods are often ignored
Until they aren’t
The chart highlights three major historical resistance zones:
Target 1 - $0.9677
Target 2 - $1.3942
Target 3 - $2.4262
These levels weren’t chosen at random
Each one marks a previous area where bullish momentum failed and sellers regained control
The first major test sits near $0.9677
This zone acted as an important turning point during the decline and represents the first barrier standing between consolidation and expansion
Above that, price enters the $1.3942 region
This level marked one of the strongest reaction points during the early trading history of the asset and could become a key battleground if momentum accelerates
But the level that matters most is still higher
The $2.4262 area represents one of the most significant resistance zones on the entire chart
It’s where one of the largest distribution phases began after launch
making it a natural target if a sustained trend develops
Markets have a habit of revisiting the levels that defined their history
And when a long period of accumulation finally breaks into expansion, old resistance zones often become the roadmap
If buyers continue building momentum from this base, $ASTER may be preparing for its first major trend reversal since the launch selloff
The structure is there
Now the market has to decide whether it’s ready to start reclaiming it
$DASH is one of those charts that looks completely forgotten…
right before the market remembers it exists
Over the years, the chart has built three major price memory zones:
$148 - the first key resistance where momentum previously stalled
$284 - the major mid-cycle breakout level
$479 - the zone where peak optimism once dominated the market
The interesting part isn’t that these levels exist
The interesting part is that $DASH is currently trading much closer to its multi-year base than to any of these historical targets
When an asset spends years moving sideways, most participants lose interest
Liquidity dries up
Volatility disappears
Attention shifts elsewhere
That’s exactly the environment where some of the strongest cycle reversals are born
A move back toward $148 would likely be dismissed as a temporary bounce
A break above $284 would start changing the narrative
And if price manages to reclaim and hold above that area
The path toward the historical $479 zone becomes significantly more realistic
Markets often reward what nobody wants to look at
And sometimes the biggest moves come from the coins people stopped talking about years ago
$INJ has a habit of launching from the same place nobody cares about
In 2020 it exploded from the base and printed Target 1
In 2023 it repeated the process and ran all the way to Target 2
Now price is back sitting in what this chart calls Pump Zone 3
The exact area where previous major expansions were born
The interesting part isn’t the targets
It’s the launchpad
Every cycle started near the rising support line
Every cycle looked boring before it became obvious
If history decides to rhyme one more time, the path on the chart points toward:
Target 1 → ~$25
Target 2 → ~$53
Target 3 → ~$80+
Most traders chase the green candles
$INJ has historically rewarded the people who bought the silence before them
Everyone talks about $BTC next move
Almost NOBODY is paying attention to $ZEC
Yet the chart is quietly pointing toward levels most traders haven’t looked at in years
Back in previous cycles, $ZEC left behind three major price zones that repeatedly acted as turning points for the market
$368 - the first major historical barrier
$745 - the midpoint where momentum could be tested
$1,100+ - the zone that sits near the upper end of $ZEC biggest expansions
What’s interesting isn’t the targets themselves
It’s the structure
The projected path follows a stair-step advance through old resistance, turning previous ceilings into potential support before moving toward the next objective
Markets rarely move in a straight line
But when an asset spends years building a base, the largest moves often happen when nobody expects them
If $ZEC starts reclaiming these historical zones, the conversation around this chart could look very different a few years from now
$XLM has launched from the same accumulation zone three separate times
The first move delivered 634%
The second delivered 593%
Now Stellar is sitting in what could be Pump Zone 3
Most traders focus on the rally after it happens
The real opportunity appears when the market returns to the same launch area that fueled previous cycles
On the chart, three major accumulation zones stand out
Pump Zone 1 → +634% move
Pump Zone 2 → +593% move
Pump Zone 3 → current setup
What’s interesting is that every major $XLM expansion started from a higher structural low
That ascending base has been developing for years while volatility steadily compressed
History doesn’t guarantee repetition
But markets often rhyme
If Pump Zone 3 follows the same pattern as previous cycles, the upside potential could be significantly larger than what most traders currently expect
The previous rallies produced several hundred percent returns before reaching exhaustion
And compared with earlier cycles, today’s structure is forming from a much stronger long-term base
That’s why many investors aren’t watching the recent candles
They’re watching the level where the move started
Because that’s where every major $XLM rally began
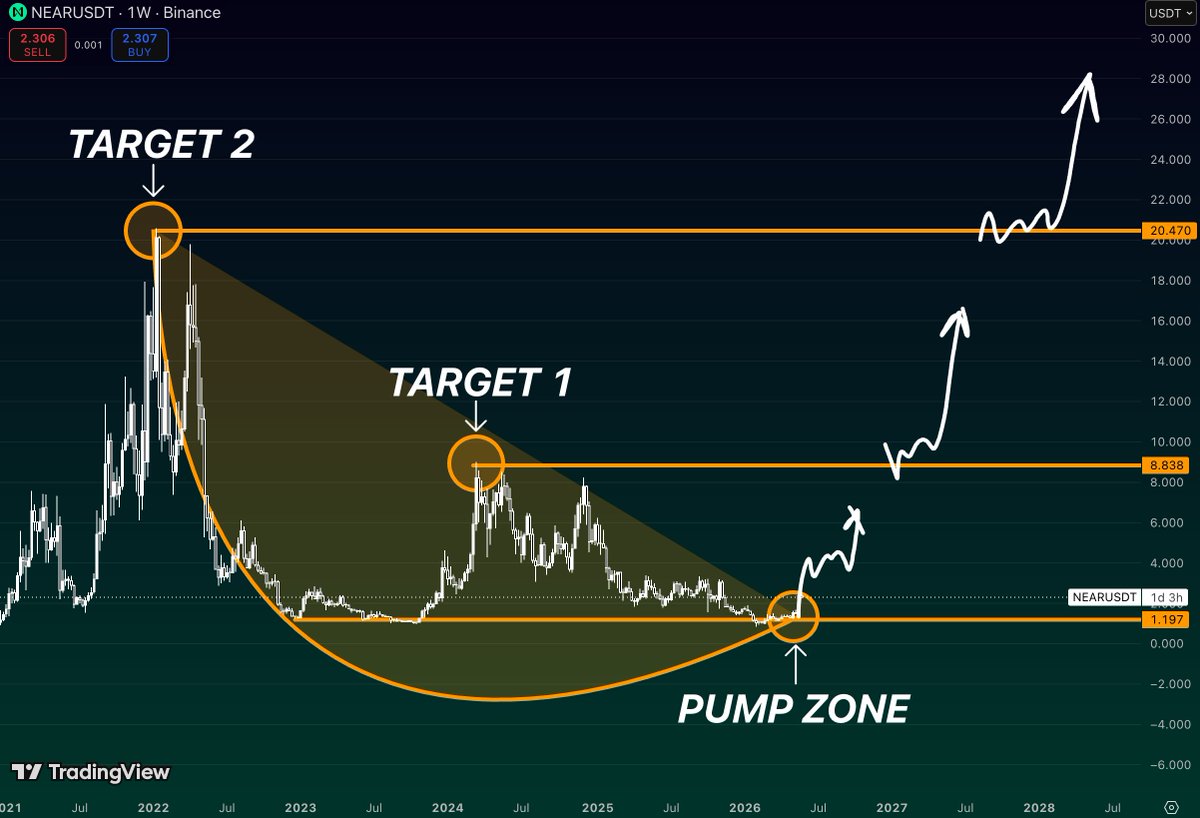
$NEAR is one of the few large-cap altcoins that keeps repeating the same pattern across multiple market cycles
First comes the long accumulation
Then a breakout from the base
And finally a return to the levels that once acted as major resistance
That’s exactly what this chart is highlighting
The most important moment wasn’t the move to $10, $15, or even $20
It was the breakout from the $1.20 area
That zone acted as a floor throughout the bear market and eventually became the launchpad for the entire move higher
Once price escaped that range, the structure completely changed
Target 1 - $8.84
Target 2 - $20.47
These aren’t random numbers
Both levels marked major turning points where previous rallies lost momentum and sellers stepped in aggressively
Markets tend to remember those areas
That’s why price often returns to test them years later
What’s especially interesting is that the distance between the breakout zone and the second target is enormous
It shows how much upside can develop once a multi-year base finally resolves upward
The chart tells a simple story:
Years of accumulation below $1.20
A decisive breakout
And a roadmap toward the major resistance zone around $20+
If history continues to rhyme, the breakout area may end up being remembered as the cheapest part of the entire cycle
$WLD is one of those charts that nobody wants to touch after a brutal downtrend
Ironically, that’s usually when the most interesting setups start to appear
The market already left three clear footprints:
Target 1 → $4.20
Target 2 → $6.50
Target 3 → $11.95
Every one of these levels was a major turning point during the previous cycle
Now price sits near the exact area where sellers have already exhausted themselves after months of decline
What’s interesting isn’t the prediction
It’s the risk/reward
When an asset is trading 90%+ below its major highs, most people only see what was lost
But markets don’t move based on the past
They move based on where liquidity sits next
And on this chart, the next magnets are obvious
First the market starts talking about $4
Then $6
Then suddenly everyone is asking how $WLD got back near $12 so fast
The funny part?
If that scenario plays out, the hardest buy wasn’t at $4
It was down here, when nobody wanted it
$TAO
This chart tells a very different story than most people realize
$TAO didn’t just bounce from the lows. It reclaimed the $163 support zone
blasted through the major $746 resistance
and now it’s spending time directly beneath the most important level on the entire chart:
the previous ATH around $1,243.
Think about that for a second.
After a move from the bottom of the range to over $1,200
$TAO isn’t collapsing
It isn’t giving back the gains
It’s sitting right under all-time highs, absorbing supply and refusing to move lower
That’s what strong markets do
Most traders spend years waiting for confirmation
$TAO has already delivered it
The support held
The key level broke
Now price is battling at the final historical ceiling.
And when an asset keeps knocking on the same door, eventually that door tends to open
If $1,243 gives way, $TAO enters price discovery again
And that’s where charts stop providing answers and start asking questions
$NEAR spent almost four years building one GIANT rounded base
Think about that for a second
While traders chased every new narrative
$NEAR quietly went from euphoria… to collapse… to complete indifference
Now price is sitting exactly where previous cycles started
The same zone that launched major expansions before
The first real test waits near $9
That’s where sellers showed up in 2024 and where many participants will be tempted to take profits again
Above that sits the $20 area
The level that defined the peak of the entire cycle
What’s fascinating isn’t the upside target
It’s the amount of time spent preparing for it
The longer a market sleeps, the more violent the wake-up tends to be
$DASH
There’s something unusual about this chart
$DASH spent years trading below levels that once looked unreachable
Now price is climbing back into the exact zones where previous bull runs started running out of fuel
The first target isn’t random
It’s the area where an entire cycle changed direction
Above that, the chart opens into territory that hasn’t seen serious testing in years
Most people remember $DASH for what it used to be
Markets care more about what it can become
And sometimes the oldest names are the ones nobody sees coming
$RENDER
The market already showed us where the real battles happened
Not at today’s price
Not even close
The first major supply zone sits near the previous key level around $5.5
Above that, there’s a massive gap before the old ATH region comes back into focus
What’s interesting is that price is attempting this recovery from the same area where buyers repeatedly stepped in during prior consolidations
The chart isn’t fighting resistance yet
It’s still building energy beneath it
Sometimes the biggest moves begin when price is nowhere near the levels everyone is watching
🚨 OIL IS SETTING UP THE SAME 2008 TRAP
Everyone sees oil going higher… and assumes it has to continue.
That’s exactly how the last cycle peaked.
Back in 2008, oil ripped to $147.
Narrative was identical.
Supply tight.
Demand strong.
No reason for it to stop.
Then it collapsed to $30.
Not slowly.
Violently.
Here’s what most people still don’t understand.
The physical oil market moves around 100M barrels per day.
But in futures?
Over 1 BILLION barrels trade daily.
That’s a 10x paper market sitting on top of reality.
So who actually sets the price?
Producers… or leveraged traders in derivatives?
That’s where things get distorted.
Because major moves don’t come from fundamentals alone.
They come from positioning.
And positioning right now looks familiar.
Liquidity is thin.
Flows are aggressive.
Shorts are getting squeezed out of the market.
That’s phase one.
The part where price accelerates and everyone becomes convinced.
Now layer in today’s macro.
Geopolitical tension around Iran.
Physical barrels trading at premiums in certain regions.
Rates still elevated.
Inflation pressure building globally.
On the surface, it all justifies higher prices.
But that’s the trap.
Because when the narrative becomes too clean…
Positioning becomes one-sided.
And that’s when reversals hit hardest.
We’ve already seen how this market operates.
Major oil players have paid billions in fines for manipulating benchmarks.
Pushing price during low liquidity windows.
Exploiting the exact structure we’re seeing again.
Nothing about that system has changed.
Only the participants have.
Right now, oil isn’t just moving on supply and demand.
It’s moving on leverage and expectation.
And when those get stretched too far…
The unwind doesn’t ask for permission.
If this continues to follow the same path as 2008…
The move everyone is chasing higher right now…
Will be remembered as the top.
Not the trend.
🚨 THIS “BOTTOM CALL” IS EXACTLY THE WARNING
Every cycle has this moment.
The shift from fear… to certainty.
Suddenly, everyone agrees.
“The bottom is in.”
“The rally has started.”
“This is the move.”
That confidence doesn’t appear at the beginning.
It appears right before the market tests it.
Because real bottoms don’t feel obvious.
They feel uncomfortable.
Uncertain.
Hard to trust.
What we’re seeing right now is the opposite.
Conviction rising fast.
Aggression coming back.
People going all-in like the hard part is over.
That’s not how durable reversals start.
That’s how traps get built.
Markets don’t reward consensus.
They exploit it.
When everyone leans one way too quickly, price doesn’t follow them.
It moves against them.
That’s how positioning resets.
That’s how liquidity gets created.
And right now, the narrative is getting crowded.
“Mega rally.”
“New cycle.”
“Don’t miss this.”
You’ve heard it before.
Every time, it sounds convincing.
Every time, it pulls people in.
And every time, the market asks the same question:
Are you early…
Or are you liquidity?
Because the biggest moves don’t begin when everyone is ready.
They begin when most people have already given up.
Right now, it feels like the opposite.
And that’s exactly why it’s worth paying attention.