@PMOIndia@CMOfficeUP@BPCLimited@DMBalrampur
My consumer number 776514
and registered mobile no 9919687616
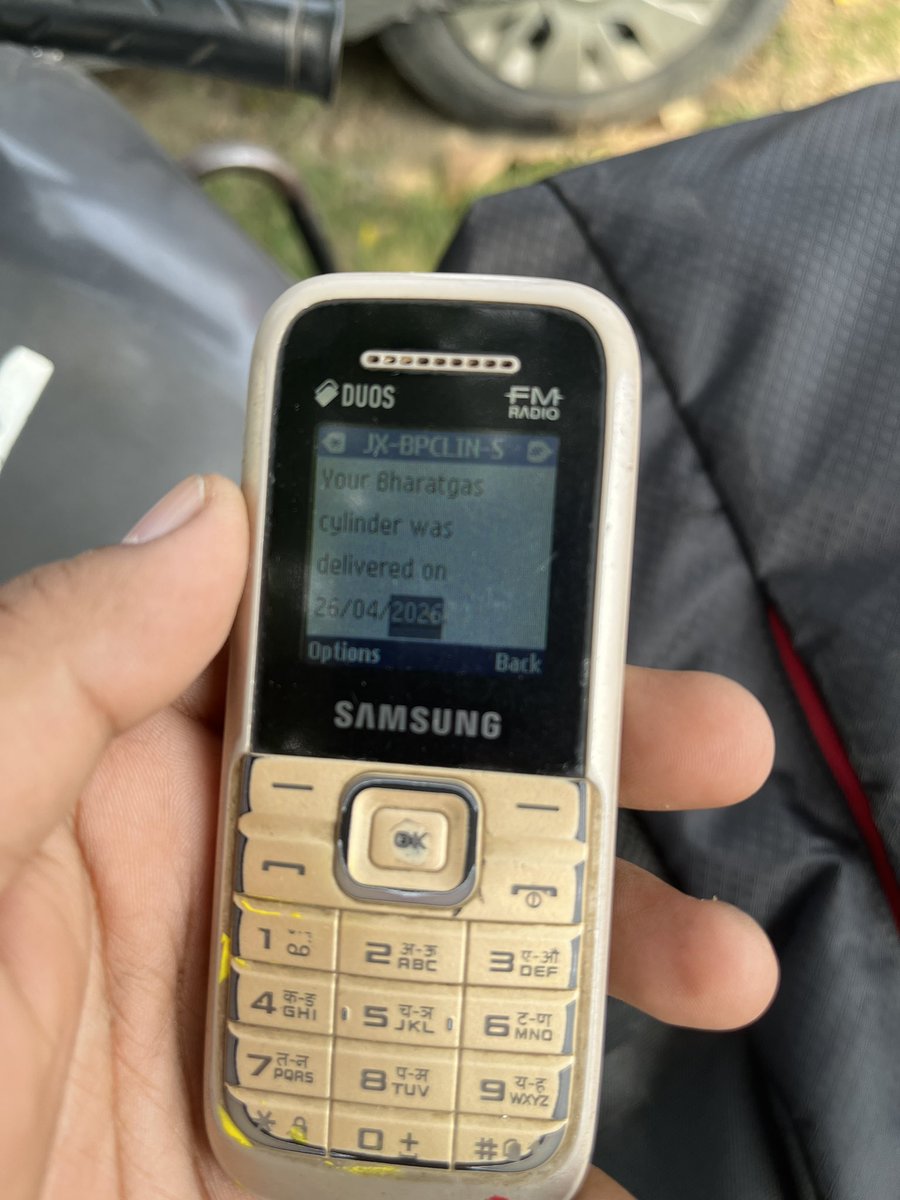
I booked my refil on 25/4/26 , and delivery is showing on 26/4/26 but I didn't get my cylinder.
When i visited agency multiple times but no one discuss clearly on this
@MoPNG_eSeva Service provider name : Bharat Gas
Consumer no 7765111488
Agency name :Shri Bala Ji Bharat Gas Nsi Bazar tulsipur road Balrampur 271201
Register Contact no 9919687616
जो भी व्यक्ति HDFC SKY डीमेट एकाउंट का प्रयोग करते हैं कृपया सावधान रहें, बहुत बड़ा फ़्रॉड चल रहा है शिकायत करने पर सुन भी नहीं रहे, एक दिन में एक शेयर बेचने पर 22185 रुपये DP चार्ज काट लिया गया ,पैसे वापिस नही कर रहे हैं
@HDFCSKY@SEBI_India@saditya10p@PMOIndia
पहली काल करने पर तो चेतावनी ठीक है,, लेकिन 10 बार फोन करो, 10 बार अमिताभ को सुनना कहाँ तक उचित है? कृपया इस पोस्ट से सहमत हैं तो इस पोस्ट को शेयर करके आगे बढ़ाएं,, जिससे कि संबंधित अधिकार�� तक पहुंचे और इस मे कुछ सुधार हो सके, जिससे कि हम निश्चिंत होकर फोन कर सकें
38 सेकंड में 242 जिंदगी खाक हो गईं अब सोचिए अगर उस आपातकाल में अगर कोई फोन करता तो पहले 30 सेकंड तो उसको बच्चन Sir की चेतावनी सुननी पड़ती,या अगर किसी को हार्ट अटैक आ जाये, या कोई गंभीर एक्सीडेंट हो जाये तो वो साइबर क्राइम से तो बच जाएगा, परंतु यमराज से कैसे बच पायेगा दिन में केवल
@IRCTCofficial Dear Team ,
Today 18/7/24 ,I m travelling from Delhi to Surat by train no 12952.
The sneaks quality is very poor .Mostly items are looking local brand.
I m not paying catering charge for local items.
Pl look and improve quality of products.
STOP searching for tools to identify Nifty Direction.
Are you a Intraday Nifty Trader ? then kindly spend next 5 minutes to read this tweet fully.
FREE Resource🔥🔥 to identify Whether Nifty will move Up or Down during live market.
Click on "Show more" and read fully
Like & Retweet is appreciated
1] Do you know Nifty Distribution percentage ?
More than 40% of Nifty price movement is mainly depend on 6 heavy weight stocks,
Reliance - 10.3%
HDFC Bank - 9.3%
ICICI Bank - 8%
HDFC - 6.3%
INFY - 5.6%
TCS - 4.1%
( Percentage might slight vary depend on the recent changes )
You would have read this or watched some videos many times about the percentage . But i will share you a systematic technique to use these percentage with multi-confirmation from candlestick charts & VWAP.
VWAP is commonly used indicator by most traders for trade entry .
Now i will use VWAP slight differently along with the above percentage of stocks to identify INTRADAY TREND & DIRECTION.
1] Now check the [ Chart - 1 ] which has simple VWAP plotted on 6 Heavy Weight stocks to understand Nifty direction.
I follow a simple rule in a Ratio Format
[ 4:2 , 5:1 , 6:0 for Bullishness ]
- 4:2 means 4 heavy weight stocks out of 6 is above VWAP - Nifty is Mild Bullish
- 5:1 means 5 heavy weight stocks out of 6 is above VWAP - Nifty is Bullish .
- 6:0 means 6 heavy weight stocks out of 6 is above VWAP - Nifty is Super Bullish.
Just Reverse for bearishness
[ 2:4 , 1:5 , 0:6 for Bearishness ]
- 2:4 means 2 heavy weight stocks out of 6 is above VWAP - Nifty looks Mild Bearish.
- 1:5 means 1 heavy weight stocks out of 6 is above VWAP - Nifty looks Bearish .
- 0:6 means 0 heavy weight stocks out of 6 is above VWAP - Nifty looks Super Bearish.
In both the Bullish & Bearish if 3:3 ratio comes 3 stocks above VWAP & 3 below VWAP - Sideways.
----------------------------------------
2] After checking [ Chart 1 ] and above Ratio format let's move on to Chart -2.
Heavy weight stocks in Chart - 1 on the same day's price reaction of Nifty using simple approach - Price trading around and above VWAP. I better focus to plan more bullish trades when most of the heavy weight stocks are also above VWAP.
The main aim is to find & trade in the correct direction - Most traders face a problem of getting trapped in the wrong direction. [ Even i have got trapped many a times nothing wrong in accepting the truth ]
3] Refer Chart 3 & 4
Always Nifty will not give one sided moves or staying above/below VWAP. Here an interesting example were few stocks trading above VWAP & few below VWAP - Information is confused - Chart is warning to wait and trade as a Directional trader [ Lack of direction just relax]
The second most problem faced by traders[ even i have faced many a times ] they start over-think during sideways market in hope of catching the next directional move. [ From my experience most of the time charts will give some hint about next direction during sideways price action - we have to be smart in reading the charts correctly ]
I will try to share separately on the ways to trade sideways market after few days - Keep supporting me.
LEARN - UPGRADE - EARN
If you find this tweet useful kindly share with traders by LIKE & RETWEET this tweet.
Follow me @learntotrade365 to get more trading content & strategies.
Also to get Live Market updates of Banknifty/Nifty levels during live market by joining the free telegram channel -https://t.co/qtrc4OEFev
I have shared my observation .Use it for educational & knowledge purpose only.


![learntotrade365's tweet photo. STOP searching for tools to identify Nifty Direction.
Are you a Intraday Nifty Trader ? then kindly spend next 5 minutes to read this tweet fully.
FREE Resource🔥🔥 to identify Whether Nifty will move Up or Down during live market.
Click on "Show more" and read fully
Like & Retweet is appreciated
1] Do you know Nifty Distribution percentage ?
More than 40% of Nifty price movement is mainly depend on 6 heavy weight stocks,
Reliance - 10.3%
HDFC Bank - 9.3%
ICICI Bank - 8%
HDFC - 6.3%
INFY - 5.6%
TCS - 4.1%
( Percentage might slight vary depend on the recent changes )
You would have read this or watched some videos many times about the percentage . But i will share you a systematic technique to use these percentage with multi-confirmation from candlestick charts & VWAP.
VWAP is commonly used indicator by most traders for trade entry .
Now i will use VWAP slight differently along with the above percentage of stocks to identify INTRADAY TREND & DIRECTION.
1] Now check the [ Chart - 1 ] which has simple VWAP plotted on 6 Heavy Weight stocks to understand Nifty direction.
I follow a simple rule in a Ratio Format
[ 4:2 , 5:1 , 6:0 for Bullishness ]
- 4:2 means 4 heavy weight stocks out of 6 is above VWAP - Nifty is Mild Bullish
- 5:1 means 5 heavy weight stocks out of 6 is above VWAP - Nifty is Bullish .
- 6:0 means 6 heavy weight stocks out of 6 is above VWAP - Nifty is Super Bullish.
Just Reverse for bearishness
[ 2:4 , 1:5 , 0:6 for Bearishness ]
- 2:4 means 2 heavy weight stocks out of 6 is above VWAP - Nifty looks Mild Bearish.
- 1:5 means 1 heavy weight stocks out of 6 is above VWAP - Nifty looks Bearish .
- 0:6 means 0 heavy weight stocks out of 6 is above VWAP - Nifty looks Super Bearish.
In both the Bullish & Bearish if 3:3 ratio comes 3 stocks above VWAP & 3 below VWAP - Sideways.
----------------------------------------
2] After checking [ Chart 1 ] and above Ratio format let's move on to Chart -2.
Heavy weight stocks in Chart - 1 on the same day's price reaction of Nifty using simple approach - Price trading around and above VWAP. I better focus to plan more bullish trades when most of the heavy weight stocks are also above VWAP.
The main aim is to find & trade in the correct direction - Most traders face a problem of getting trapped in the wrong direction. [ Even i have got trapped many a times nothing wrong in accepting the truth ]
3] Refer Chart 3 & 4
Always Nifty will not give one sided moves or staying above/below VWAP. Here an interesting example were few stocks trading above VWAP & few below VWAP - Information is confused - Chart is warning to wait and trade as a Directional trader [ Lack of direction just relax]
The second most problem faced by traders[ even i have faced many a times ] they start over-think during sideways market in hope of catching the next directional move. [ From my experience most of the time charts will give some hint about next direction during sideways price action - we have to be smart in reading the charts correctly ]
I will try to share separately on the ways to trade sideways market after few days - Keep supporting me.
LEARN - UPGRADE - EARN
If you find this tweet useful kindly share with traders by LIKE & RETWEET this tweet.
Follow me @learntotrade365 to get more trading content & strategies.
Also to get Live Market updates of Banknifty/Nifty levels during live market by joining the free telegram channel -https://t.co/qtrc4OEFev
I have shared my observation .Use it for educational & knowledge purpose only.](https://pbs.twimg.com/media/FwQGN3KaMAAldhu.jpg)
![learntotrade365's tweet photo. STOP searching for tools to identify Nifty Direction.
Are you a Intraday Nifty Trader ? then kindly spend next 5 minutes to read this tweet fully.
FREE Resource🔥🔥 to identify Whether Nifty will move Up or Down during live market.
Click on "Show more" and read fully
Like & Retweet is appreciated
1] Do you know Nifty Distribution percentage ?
More than 40% of Nifty price movement is mainly depend on 6 heavy weight stocks,
Reliance - 10.3%
HDFC Bank - 9.3%
ICICI Bank - 8%
HDFC - 6.3%
INFY - 5.6%
TCS - 4.1%
( Percentage might slight vary depend on the recent changes )
You would have read this or watched some videos many times about the percentage . But i will share you a systematic technique to use these percentage with multi-confirmation from candlestick charts & VWAP.
VWAP is commonly used indicator by most traders for trade entry .
Now i will use VWAP slight differently along with the above percentage of stocks to identify INTRADAY TREND & DIRECTION.
1] Now check the [ Chart - 1 ] which has simple VWAP plotted on 6 Heavy Weight stocks to understand Nifty direction.
I follow a simple rule in a Ratio Format
[ 4:2 , 5:1 , 6:0 for Bullishness ]
- 4:2 means 4 heavy weight stocks out of 6 is above VWAP - Nifty is Mild Bullish
- 5:1 means 5 heavy weight stocks out of 6 is above VWAP - Nifty is Bullish .
- 6:0 means 6 heavy weight stocks out of 6 is above VWAP - Nifty is Super Bullish.
Just Reverse for bearishness
[ 2:4 , 1:5 , 0:6 for Bearishness ]
- 2:4 means 2 heavy weight stocks out of 6 is above VWAP - Nifty looks Mild Bearish.
- 1:5 means 1 heavy weight stocks out of 6 is above VWAP - Nifty looks Bearish .
- 0:6 means 0 heavy weight stocks out of 6 is above VWAP - Nifty looks Super Bearish.
In both the Bullish & Bearish if 3:3 ratio comes 3 stocks above VWAP & 3 below VWAP - Sideways.
----------------------------------------
2] After checking [ Chart 1 ] and above Ratio format let's move on to Chart -2.
Heavy weight stocks in Chart - 1 on the same day's price reaction of Nifty using simple approach - Price trading around and above VWAP. I better focus to plan more bullish trades when most of the heavy weight stocks are also above VWAP.
The main aim is to find & trade in the correct direction - Most traders face a problem of getting trapped in the wrong direction. [ Even i have got trapped many a times nothing wrong in accepting the truth ]
3] Refer Chart 3 & 4
Always Nifty will not give one sided moves or staying above/below VWAP. Here an interesting example were few stocks trading above VWAP & few below VWAP - Information is confused - Chart is warning to wait and trade as a Directional trader [ Lack of direction just relax]
The second most problem faced by traders[ even i have faced many a times ] they start over-think during sideways market in hope of catching the next directional move. [ From my experience most of the time charts will give some hint about next direction during sideways price action - we have to be smart in reading the charts correctly ]
I will try to share separately on the ways to trade sideways market after few days - Keep supporting me.
LEARN - UPGRADE - EARN
If you find this tweet useful kindly share with traders by LIKE & RETWEET this tweet.
Follow me @learntotrade365 to get more trading content & strategies.
Also to get Live Market updates of Banknifty/Nifty levels during live market by joining the free telegram channel -https://t.co/qtrc4OEFev
I have shared my observation .Use it for educational & knowledge purpose only.](https://pbs.twimg.com/media/FwQGMkhaUAA0V9J.jpg)
![learntotrade365's tweet photo. STOP searching for tools to identify Nifty Direction.
Are you a Intraday Nifty Trader ? then kindly spend next 5 minutes to read this tweet fully.
FREE Resource🔥🔥 to identify Whether Nifty will move Up or Down during live market.
Click on "Show more" and read fully
Like & Retweet is appreciated
1] Do you know Nifty Distribution percentage ?
More than 40% of Nifty price movement is mainly depend on 6 heavy weight stocks,
Reliance - 10.3%
HDFC Bank - 9.3%
ICICI Bank - 8%
HDFC - 6.3%
INFY - 5.6%
TCS - 4.1%
( Percentage might slight vary depend on the recent changes )
You would have read this or watched some videos many times about the percentage . But i will share you a systematic technique to use these percentage with multi-confirmation from candlestick charts & VWAP.
VWAP is commonly used indicator by most traders for trade entry .
Now i will use VWAP slight differently along with the above percentage of stocks to identify INTRADAY TREND & DIRECTION.
1] Now check the [ Chart - 1 ] which has simple VWAP plotted on 6 Heavy Weight stocks to understand Nifty direction.
I follow a simple rule in a Ratio Format
[ 4:2 , 5:1 , 6:0 for Bullishness ]
- 4:2 means 4 heavy weight stocks out of 6 is above VWAP - Nifty is Mild Bullish
- 5:1 means 5 heavy weight stocks out of 6 is above VWAP - Nifty is Bullish .
- 6:0 means 6 heavy weight stocks out of 6 is above VWAP - Nifty is Super Bullish.
Just Reverse for bearishness
[ 2:4 , 1:5 , 0:6 for Bearishness ]
- 2:4 means 2 heavy weight stocks out of 6 is above VWAP - Nifty looks Mild Bearish.
- 1:5 means 1 heavy weight stocks out of 6 is above VWAP - Nifty looks Bearish .
- 0:6 means 0 heavy weight stocks out of 6 is above VWAP - Nifty looks Super Bearish.
In both the Bullish & Bearish if 3:3 ratio comes 3 stocks above VWAP & 3 below VWAP - Sideways.
----------------------------------------
2] After checking [ Chart 1 ] and above Ratio format let's move on to Chart -2.
Heavy weight stocks in Chart - 1 on the same day's price reaction of Nifty using simple approach - Price trading around and above VWAP. I better focus to plan more bullish trades when most of the heavy weight stocks are also above VWAP.
The main aim is to find & trade in the correct direction - Most traders face a problem of getting trapped in the wrong direction. [ Even i have got trapped many a times nothing wrong in accepting the truth ]
3] Refer Chart 3 & 4
Always Nifty will not give one sided moves or staying above/below VWAP. Here an interesting example were few stocks trading above VWAP & few below VWAP - Information is confused - Chart is warning to wait and trade as a Directional trader [ Lack of direction just relax]
The second most problem faced by traders[ even i have faced many a times ] they start over-think during sideways market in hope of catching the next directional move. [ From my experience most of the time charts will give some hint about next direction during sideways price action - we have to be smart in reading the charts correctly ]
I will try to share separately on the ways to trade sideways market after few days - Keep supporting me.
LEARN - UPGRADE - EARN
If you find this tweet useful kindly share with traders by LIKE & RETWEET this tweet.
Follow me @learntotrade365 to get more trading content & strategies.
Also to get Live Market updates of Banknifty/Nifty levels during live market by joining the free telegram channel -https://t.co/qtrc4OEFev
I have shared my observation .Use it for educational & knowledge purpose only.](https://pbs.twimg.com/media/FwQGKwWakAIeHP4.jpg)







![learntotrade365's tweet photo. STOP searching for tools to identify Nifty Direction.
Are you a Intraday Nifty Trader ? then kindly spend next 5 minutes to read this tweet fully.
FREE Resource🔥🔥 to identify Whether Nifty will move Up or Down during live market.
Click on "Show more" and read fully
Like & Retweet is appreciated
1] Do you know Nifty Distribution percentage ?
More than 40% of Nifty price movement is mainly depend on 6 heavy weight stocks,
Reliance - 10.3%
HDFC Bank - 9.3%
ICICI Bank - 8%
HDFC - 6.3%
INFY - 5.6%
TCS - 4.1%
( Percentage might slight vary depend on the recent changes )
You would have read this or watched some videos many times about the percentage . But i will share you a systematic technique to use these percentage with multi-confirmation from candlestick charts & VWAP.
VWAP is commonly used indicator by most traders for trade entry .
Now i will use VWAP slight differently along with the above percentage of stocks to identify INTRADAY TREND & DIRECTION.
1] Now check the [ Chart - 1 ] which has simple VWAP plotted on 6 Heavy Weight stocks to understand Nifty direction.
I follow a simple rule in a Ratio Format
[ 4:2 , 5:1 , 6:0 for Bullishness ]
- 4:2 means 4 heavy weight stocks out of 6 is above VWAP - Nifty is Mild Bullish
- 5:1 means 5 heavy weight stocks out of 6 is above VWAP - Nifty is Bullish .
- 6:0 means 6 heavy weight stocks out of 6 is above VWAP - Nifty is Super Bullish.
Just Reverse for bearishness
[ 2:4 , 1:5 , 0:6 for Bearishness ]
- 2:4 means 2 heavy weight stocks out of 6 is above VWAP - Nifty looks Mild Bearish.
- 1:5 means 1 heavy weight stocks out of 6 is above VWAP - Nifty looks Bearish .
- 0:6 means 0 heavy weight stocks out of 6 is above VWAP - Nifty looks Super Bearish.
In both the Bullish & Bearish if 3:3 ratio comes 3 stocks above VWAP & 3 below VWAP - Sideways.
----------------------------------------
2] After checking [ Chart 1 ] and above Ratio format let's move on to Chart -2.
Heavy weight stocks in Chart - 1 on the same day's price reaction of Nifty using simple approach - Price trading around and above VWAP. I better focus to plan more bullish trades when most of the heavy weight stocks are also above VWAP.
The main aim is to find & trade in the correct direction - Most traders face a problem of getting trapped in the wrong direction. [ Even i have got trapped many a times nothing wrong in accepting the truth ]
3] Refer Chart 3 & 4
Always Nifty will not give one sided moves or staying above/below VWAP. Here an interesting example were few stocks trading above VWAP & few below VWAP - Information is confused - Chart is warning to wait and trade as a Directional trader [ Lack of direction just relax]
The second most problem faced by traders[ even i have faced many a times ] they start over-think during sideways market in hope of catching the next directional move. [ From my experience most of the time charts will give some hint about next direction during sideways price action - we have to be smart in reading the charts correctly ]
I will try to share separately on the ways to trade sideways market after few days - Keep supporting me.
LEARN - UPGRADE - EARN
If you find this tweet useful kindly share with traders by LIKE & RETWEET this tweet.
Follow me @learntotrade365 to get more trading content & strategies.
Also to get Live Market updates of Banknifty/Nifty levels during live market by joining the free telegram channel -https://t.co/qtrc4OEFev
I have shared my observation .Use it for educational & knowledge purpose only.](https://pbs.twimg.com/media/FwQGO5JakAInG4b.jpg)


