Vox | Macro is built to solve and simplify the problem of analyzing markets.
LinkedIn, X or most venues for surfacing new information are flooded with AI-generated content and engagement-optimized takes. Most of it has no practical value for market participants trying to make decisions.
Vox | Macro is an invite-only platform for vetted investors and market participants — purpose-built for macro analysis, not engagement metrics.
What's inside:
→ Daily sentiment surveys across key macro assets
→ Prediction market analysis and synthesis — which contracts are seeing informed flows and what is the aggregate interpretation of their pricing
→ Central bank speech analysis scored by topic and market relevance
→ Macro news synthesis ranked by market impact, from a variety of sources
→ Community polls on price targets for any asset, any timeframe
→ TradingView charts, Polymarket contracts, and tweets embedded directly in chat
Every member is vetted. Every feature is designed to surface signal.
Macro-relevant prediction market signals // 2026-09-24 06:00 EST Update
· Fed hiking cycle is back and accelerating. The October 2026 rate hike contract has surged to 68.5% YES (+22pp in a week, +44pp in a month), and the broader "another Fed rate hike in 2026" market sits at 90.5% YES (+10pp week-over-week). The January Fed dissent market swinging to 41.5% YES (+23pp weekly, +22.5pp monthly) adds texture: markets are pricing not just a hike but meaningful internal disagreement at the Fed, suggesting the committee is not unified on this tightening path. Taken together, these flows represent the most concentrated repositioning in the dataset — sophisticated capital has sharply repriced the Fed's reaction function over the past month.
· Saudi Arabia / Houthi / oil infrastructure risk is live and being actively priced. The Houthi military action against Saudi Arabia on September 29 is at 25.5% YES with volume running at 4.0× the monthly average. Simultaneously, the Saudi East-West pipeline restart by October 31 sits at 80.9% YES but has lost 5.6pp in the past week. These two markets together imply positioning around a specific near-term window of disruption risk: the pipeline is expected to come back online, but the probability of a Houthi strike before month-end is not trivial and is drawing intense speculative interest. At WTI near $93.81, any supply shock from a successful strike would be materially amplifying.
· Venezuela leadership transition is being repriced rapidly. The probability that Delcy Rodríguez leads Venezuela by end of 2026 has jumped to 38.5% (+28.5pp in a week, +29pp in a month) while the Maduro "no prison time" contract sits at 69.5% (+19pp weekly, +30pp monthly). These two markets are telling a coherent story: capital is pricing an accelerating leadership transition in Caracas — Maduro exits without incarceration, Rodríguez steps up. The speed and simultaneity of both moves suggests informed flow, not noise.
· US-Iran ceasefire holding but invasion risk is fading, not zero. The ceasefire-through-September-30 contract is at 84.5% YES with 4.0× volume spike, while the "US invades Iran before 2027" contract has drifted down to 13.5% (-3pp both weekly and monthly). Markets are simultaneously affirming near-term ceasefire stability and slowly pricing out the tail risk of full military escalation — a coherent de-escalation signal, though the elevated volume on the ceasefire contract suggests participants are actively watching the expiry rather than treating it as settled.
· Bitcoin is rallying but has failed to reach the higher strike targets. The "Bitcoin above $82,000 on September 24" contract sits at 86.5% YES — effectively confirming current price levels. However, the "$87,500 in September" contract is only 26.5% YES (+20pp weekly), and the "$88,000 in the September 21–27 window" is just 10.5%. The Ethereum "$2,250 by December 31" contract has collapsed to 35.5% (-29pp weekly, -40.5pp monthly), strongly implying the crypto bear-case has been pushed out. Markets are pricing a crypto recovery that is real but running into resistance well below the optimistic upper-band targets.
· US measles outbreak is on a trajectory to cross the 5,000-case threshold. That contract is at 72.0% YES (+3.5pp weekly, +22.5pp monthly) with 3.59× volume. While not a traditional macro variable, at this scale a domestic public health deterioration has fiscal implications (federal response spending) and is a politically salient domestic policy signal heading into the 2026 election cycle.
---
· Global central banks are tightening in lockstep — and some are just getting started. The Bank of England November hike is priced at 79.5% YES (+17pp weekly, +57pp monthly) — the largest one-month move among secondary central bank contracts — signaling a significant repricing of BOE policy, likely driven by persistent inflation. The RBA September hike is at 94.5% YES (+91.5pp monthly), essentially a settled outcome. The BOJ December hike sits at 61.0% YES. Three major non-Fed central banks are all priced to tighten within the next three months; combined with the Fed repositioning in the dominant signals, this is a synchronized global tightening pulse, with rate-differential implications for DXY and EM carry trades.
· Bank of Canada and RBNZ are the policy divergence signals to watch. The Bank of Canada "no change in December" contract has dropped sharply to 35.0% (-25pp weekly), implying markets have rapidly shifted to pricing a BOC move — either a hike or cut — rather than a hold. The RBNZ "no change in December" has jumped to 50.0% (+36.5pp weekly), moving in the opposite direction toward a hold. These two moves in opposite directions, both with elevated volume deviations (2.37× and 3.05×), represent the clearest short-horizon policy divergence in the dataset and carry direct implications for CAD and NZD pricing against a backdrop of global tightening.
Productivity data, just like so much of the quarterly economic data compendium, tend to be revised significantly over time. Initially while those data were being released, the 90s and early 00s did not seem like a high productivity growth period. It was only years later that that story materialised.
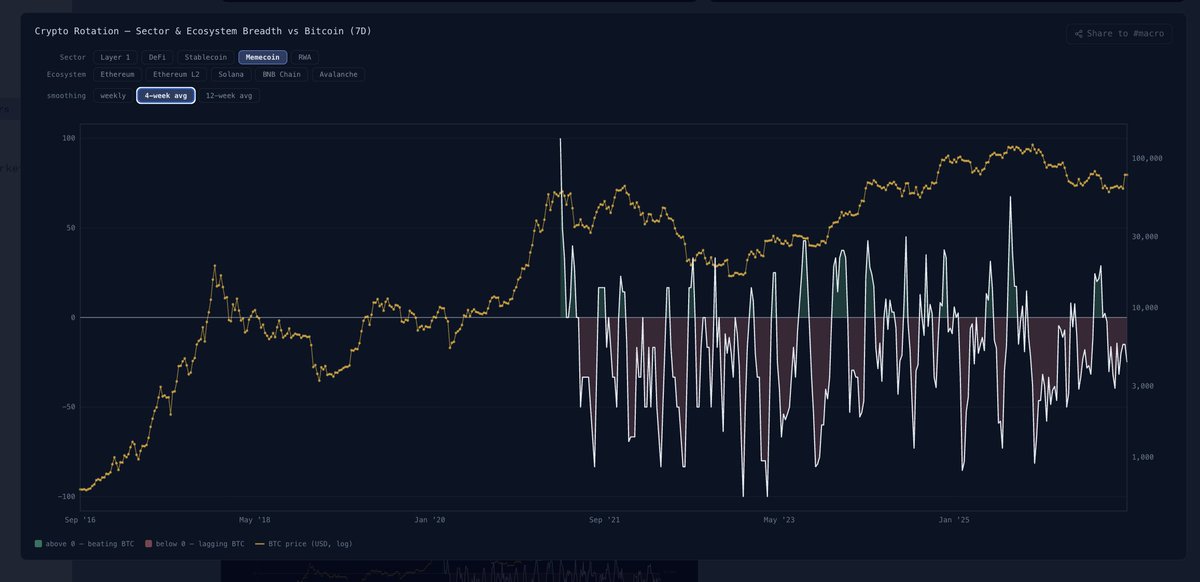
Crypto Rally Gaining Breadth, Yet High-Risk Cohorts Remain Subdued
The aggregate rally in crypto markets since mid-August continues, with breadth improving across the top 100 market capitalization-ranked assets. On a 4-week moving average basis, we are now seeing a majority of the top 100 outperforming Bitcoin for the first time since the May/June period.
Despite this improvement in risk sentiment, the highest-risk parts of the market continue to underperform BTC. The largest memecoins, which outperformed in the April/May, 2026 price rally continue to remain subdued, lagging BTC's recent performance.
Macro-relevant prediction market pricing evolution // 2026-09-21 06:00 EST Update
· Fed rate hike cycle resuming — highest-conviction call in the dataset. The October Fed hike market has surged to 53.5% YES, up +17pp in a week and +30pp in a month, with a 3.41× volume spike and a 5.8/5.8 flow score — the single most broadly supported repositioning in the entire dataset. The broader "another Fed hike in 2026" contract sits at 85.5% YES, and the 10-year Treasury hitting 5.2% market has moved to 43.1% YES (+10pp weekly, +35pp monthly). Markets are collectively repricing a tighter-for-longer Fed, with the policy rate and the long end both being pushed higher by informed flow simultaneously.
· Saudi pipeline disruption is real and sustained — not a false alarm. The East-West pipeline restart contract collapsed to 32% YES, down a dramatic -24.5pp in a single week with 3.73× volume. The speed and magnitude of that single-week drop signals that sophisticated participants have concluded the disruption will persist beyond September 30. With WTI already at $93.93, a prolonged outage on a major Saudi export route is a supply shock with direct upside price implications — the $105 WTI strike market sitting at 18% YES represents meaningful optionality in this environment.
· Venezuela regime transition is being priced as imminent. The Delcy Rodríguez leadership market has exploded to 37% YES, up +24.5pp in a week and +27.5pp in a month, with 3.72× volume. This scale and speed of flow into a political succession contract signals that informed capital believes Maduro's hold on power has materially weakened and that Rodríguez — currently VP — is now the most likely successor figure heading into year-end 2026.
· Middle East conflict architecture is settling into a fragile but durable ceasefire posture. The Israel-Iran ceasefire continuing through November holds at 71.5% YES, and the US-Iran ceasefire through September 30 is at 83.5% YES — both with elevated volume. At the same time, the "Israel strikes 4 countries in 2026" market has dropped -10.8pp in a week to 75.7%, and the US invasion of Iran contract sits at just 16.5% with flat flow. Markets are pricing regional de-escalation as the base case while still assigning material probability to Israeli military action remaining multi-front but below the threshold of a broader US military commitment.
· Russia-Ukraine front is stabilizing, not escalating. The Kramatorsk capture market has fallen to 20% YES, down -10pp weekly and -13.5pp monthly, with 3.33× volume confirming active repositioning away from a Russian breakthrough scenario. Simultaneously, the Russian Duma election market has surged to 67.8% YES (+58.9pp in a week — the largest single-contract weekly move in the dataset), signaling that markets are now pricing a Russian election as either imminent or newly called, with United Russia expected to dominate. Together these signals point to a Russia consolidating domestically while its military offensive stalls.
· BYD delisting from the US military companies blacklist is gaining traction. The market has moved to 23% YES, up +8.5pp weekly and +9.5pp monthly, with 3.87× volume — the highest VolDev in the dominant section. For a market priced this low, that volume and directional flow is significant: informed participants are repositioning toward a potential US-China diplomatic accommodation on Chinese EV/tech company designations, which would carry broad implications for Chinese equity access and cross-border investment restrictions.
· Brazil's political landscape is shifting sharply toward a Bolsonaro restoration. Flávio Bolsonaro's presidential win probability has risen to 58.9% YES, up +8.5pp weekly and +25.9pp monthly. The "second place in round one" market is at 68.5% but falling (-16pp monthly), suggesting markets expect him to consolidate support enough to outperform initial round expectations. The Renan Santos 8% threshold contract at 10.5% implies the radical-left flank remains weak. Taken together, informed flow is pricing a center-right to right-wing electoral outcome in Brazil's largest upcoming democratic event.
---
· A synchronized global tightening wave is the dominant central bank story outside the US. The ECB is priced at 60.5% YES for a December hike. The BOJ is at 69% YES for a December hike. The BOE has surged to 68% YES for a November hike, up +20.5pp weekly and +47pp monthly — one of the largest monthly central bank flow moves in the dataset. The RBA is at 94.8% YES for a September hike (+92pp monthly). Every major central bank with active flow in this dataset is being priced as hiking, not cutting — the SNB alone is at 99.9% for no change, confirming it as the sole holdout. This is a globally synchronized tightening regime, with rate-differential implications that pressure currencies of economies where central banks are slower to move.
· Bank of Russia expected to pause — a notable divergence within the tightening consensus. The CBR no-change market has jumped to 72.5% YES, up +27pp weekly and +21.5pp monthly, with 2.83× volume. While every major Western and Asia-Pacific central bank is being priced as hiking, informed flow is pricing Russia's central bank as holding — likely reflecting the tension between war-driven fiscal pressure and an economy where further tightening risks are assessed differently. The Bank of Canada no-change market at 56.5% and falling (-7pp weekly) adds a secondary note of hesitation in the North American policy picture, though it lacks the same conviction of flow.
Macro-relevant prediction market pricing // 2026-09-09 06:00 EST Update
· Middle East escalation is the dominant regime shift being priced. Israel military action against Lebanon on September 9 sits at 66% with a 4.00× volume spike and a perfect 5.0/5.0 flow score on both horizons — the highest conviction signal in the dataset. Simultaneously, the Israel-Lebanon diplomatic meeting by September 15 has collapsed 36pp in a week to just 16.5%, confirming markets see kinetic escalation, not negotiation, as the base case. These two contracts tell the same story from opposite directions: sophisticated capital has largely closed out the diplomatic resolution trade and repositioned into conflict.
· A US-Iran ceasefire is being priced in rapidly, but the Hormuz blockade risk remains elevated and is moving independently. The US-Iran effective ceasefire by September 4 has surged 25pp in a week to 48.5% with a 3.98× volume spike, signaling aggressive repositioning toward de-escalation on that bilateral track. However, the zero-ships-through-Hormuz contract has simultaneously risen 17pp to 35%, and an Iran-Oman Hormuz agreement sits at 50.5% after a 16.5pp weekly gain. Markets are not treating these as contradictory — the read is that a US-Iran political ceasefire does not automatically reopen the strait, and capital is hedging the two scenarios separately. Hormuz disruption risk remains a live tail even under a ceasefire.
· The Fed is in genuine two-way uncertainty for the September meeting, with the monthly trend running hard against the weekly. The 25bp hike contract sits at 52.5% — near coin-flip — but the signal structure is internally conflicted: the 1-month change is +18pp (capital flowing into hike pricing over the past month) while the 1-week change is -6pp (some reversal in the most recent week). The "next Fed move is a hike" contract at 82.5% (+22pp over the month) confirms the directional bias is upward, but the near-term wobble at 52.5% suggests the September meeting specifically remains genuinely contested. This is not a settled call.
· Ethereum is being repriced sharply higher in the near term, with the downside tail compressing fast. The ETH-reaches-$2,600-in-September contract has surged 27pp in a week to 73.5%, while the ETH-dips-to-$2,250-by-year-end contract has dropped 24pp to 57% — both on volume spikes above 3.9×. Bitcoin's $75,000 dip-in-September contract has similarly fallen 24pp to 58.5%, while the BTC-above-$80,000-on-September-9 contract sits at only 13.5%. The composite picture is a market pricing in a near-term crypto relief rally that does not yet resolve the longer-dated downside — ETH recovery to $2,600 near-term is high-conviction; the year-end tail risk to $2,250 remains above-even odds.
· A Millennium Prize mathematics solution and AGI announcement are both being repriced meaningfully higher on the 1-month horizon, suggesting markets are beginning to assign non-trivial probability to a step-change AI/science event before 2027. The CMI Millennium Prize contract has risen 9.5pp in a week and 15pp over the month to 30.5%; the OpenAI AGI announcement contract is up 4pp weekly and 15pp monthly to 23.5%. Neither is high-conviction in isolation, but both moving together on similar timescales suggests a shared underlying driver — likely news or signals around frontier AI capability — rather than independent idiosyncratic repricing.
· The ECB and BOJ September hikes are fully settled facts per market pricing. ECB +25bp in September sits at 99.7% (+17.6pp over the month); BOJ +25bp in September sits at 97.6% (+55.1pp over the month — the largest monthly central bank move in the dataset). Both are priced as done deals. The BOJ move is the more consequential signal: a 55pp monthly surge to near-certainty means this was not priced a month ago and is now consensus, with direct implications for yen strength and carry trade unwind dynamics. The ECB at 99.7% is settled and directionally confirms Europe is also in a tightening posture.
· The RBA and BOE are also in active tightening cycles, while the RBNZ is on hold — a divergence that matters for rate differentials in the Pacific and Commonwealth currency complex. RBA +25bp in September is at 74.5%, up 20pp in a week and a massive 70.5pp over the month, confirming a dramatic shift from easing expectations to a near-certain hike. BOE rate hike in 2026 is at 64.5%, up 37pp over the month. Against this, RBNZ holds at its October meeting with 91% probability, and the RBNZ is priced to hike at December (60%). The RBA and BOE moving into synchronized tightening while the RBNZ lags by a meeting creates a meaningful AUD/NZD and GBP rate-differential signal that is actively being repositioned around.
Here's a properly calibrated version of this, where the trend is extrapolated using only data available up to a given point in time.
It's just a best-fit prediction, not some predestined law of the price mechanism. Now, just as in the past, demand for ETH will be important in driving any catch-up to the uptrend. ICOs or NFTs are now artifacts of bygone times, but they did push people to want to buy ETH to do stuff with it.
Memecoin Enthusiasm Remains Highly Concentrated
The launch of Robinhood Chain has drawn significant attention and a revival of memecoin interest not seen for some time.
On aggregate however, memes remain a laggard. Multi-cycle memecoins like dogecoin:native or ethereum:0x95ad61b0a150d79219dcf64e1e6cc01f0b64c4ce continue to lag bitcoin:native in their performance over a multi-week basis. This is more consistent with a localised hub of excitement on Robinhood vs. a spike in crypto risk appetite.
In the past, it's been the spike in outperformance of memes vs. bitcoin:native that has signaled a local market peak. We remain far away from those heady extremes today.
@ajey_eth HYPE FDV is ~$80Bln. Assume that for perp dex valuation purposes, the same market power law in aggregate crypto also holds. ETH to BTC MCap of ~0.2 = LIT to HYPE FDV of ~0.2, which implies LIT FDV of 10-20Bln so LIT 10-20.
What is pushing up long-duration bond yields globally?
For most of 2026 and especially since the end of Q2 major 10 and 30 year benchmark government bond yields globally continue rising. While inflation and a hawkish monetary policy path repricing were important components in yields rising around the outbreak of the Iran war, these factors have been muted in recent months.
Even as commodity prices have picked up in Q3-2026, breakeven inflation remained rangebound. 5 year government bond yields, which in major DM economies embed monetary policy settings and expectations about their changes over the near-term, have not moved significantly over the same time period.
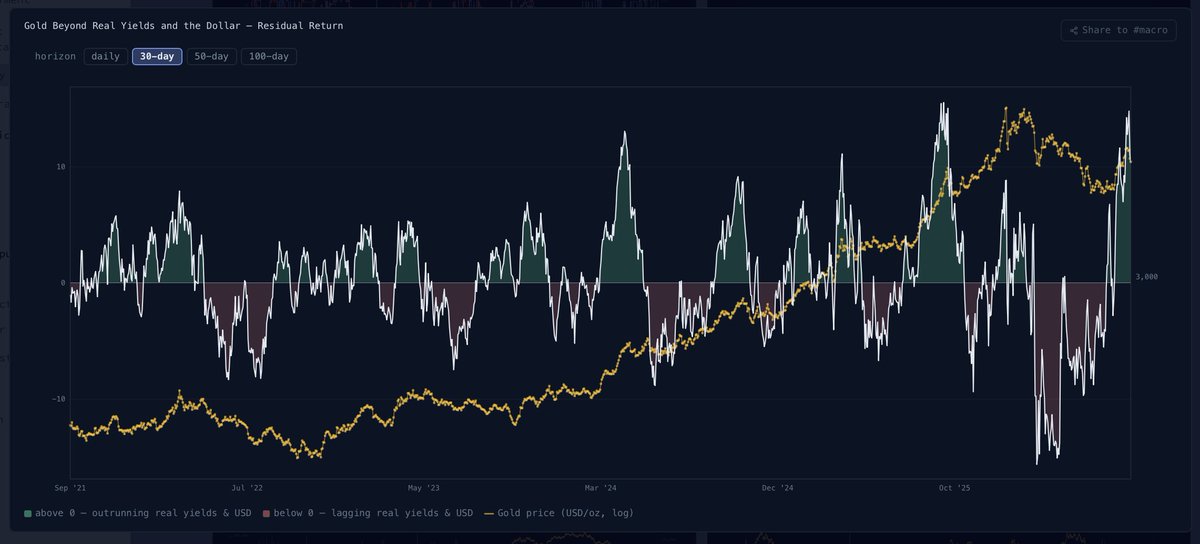
The best hypothesis focuses on global real growth acceleration over this period, an acceleration in private sector debt issuance to fund AI-linked cap-ex, as well as a dearth of official sector buyers of government debt, exemplified by gold's price rally.
The acceleration in global growth, tracked by both high-frequency proxies of realized economic data as well as global PMIs underscore a global growth environment which features a broad cross-section of major economies. On its own this factor would place upward pressures on inflation-adjusted government bond yields.
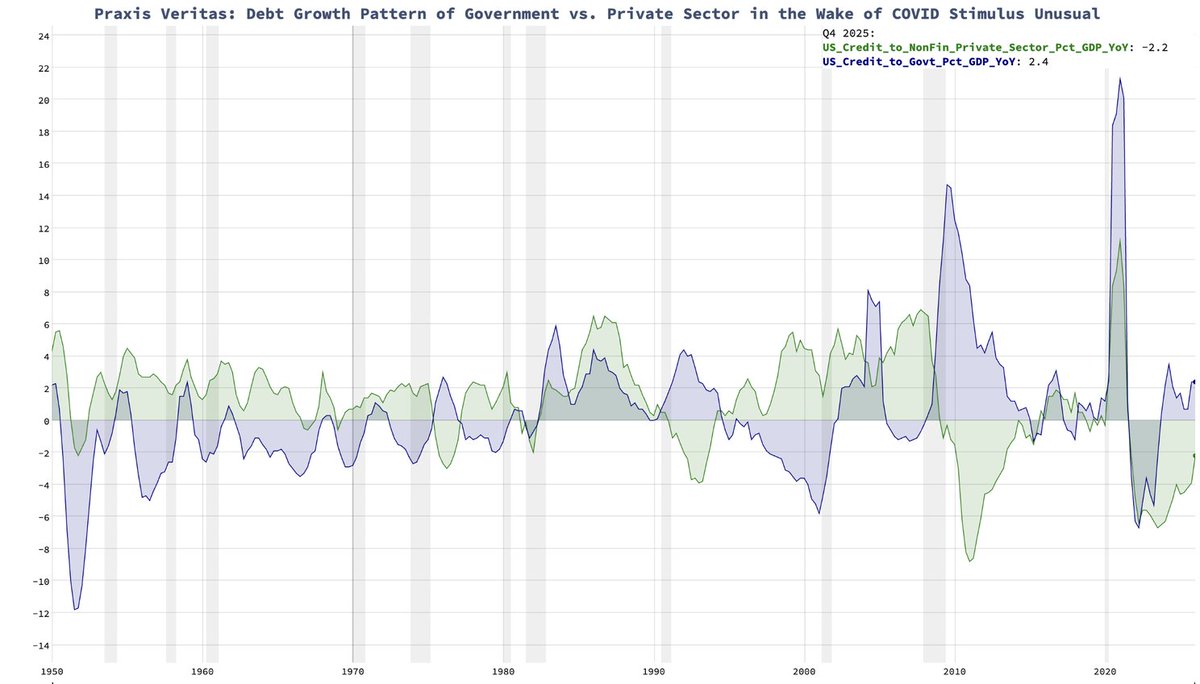
Some of this growth acceleration is directly driven by AI-linked capital expenditures. At the margin, this cap-ex is increasingly funded by private sector debt issuance. In most of the post-COVID period, the rapid rise in government debt ratios in major economies was met with a deleveraging of the private sector. An end to this regime means attracting sovereign debt buyers at the margin requires more enticing yields than in the past.
Finally, the rally in gold prices in recent years underscores the shift in official reserve allocation dynamics. For various reasons, central banks have favored increasing the share of purchases of gold. Q2 marked a pause in that process, as many waited for the initial consequences of the Iran conflict to play out. The rebound in gold in Q3 could be a sign that the recent dynamics of official sector gold purchases at the expense of sovereign debt are back.
Comparing Spot ETH and BTC Net ETF Flows
On a rolling 20 trading day basis, the recent rise in BTC net ETF inflows marks the most sustained flow print since early May, 2026.
The pickup in ETH net inflows has been more pronounced, with the highest print since Oct, 2025.
The Case for ethereum:0x232ce3bd40fcd6f80f3d55a522d03f25df784ee2 in a Nutshell
The experience over previous bull and bear markets in crypto is that tokens or companies that derive an important share of their revenue from trading fees tend to co-move with aggregate trading volumes.
For example, the chart below compares $COIN with aggregate spot trading volumes across all crypto venues. It's not a perfect relationship, but generally Coinbase's equity value oscillates with crypto trading activity. For the bulk of the duration of the chart, the vast majority of trading-based revenues were allocated among the major CEXs, of which Coinbase is a part.
It is only in recent months, with the rise of hyperliquid:native and now ethereum:0x232ce3bd40fcd6f80f3d55a522d03f25df784ee2, that on-chain venues have started to claim a share of this trading activity.
So, in a nutshell, if trading volumes pick up after a prolonged multi-quarter downtrend, the outsized beneficiaries should be the new entrants to the market.
Praxis Veritas LLC | Not investment advice | For informational purposes only
Vox|Macro News Pulse — 2026-08-26 18:00 EST Intraday macro developments and news flow ranked by salience and market impact.
[5/5] AI Earnings Boom Confirms Sustained Investment Supercycle
Nvidia projected 70% sales growth into 2028, Amazon ordered 2 million Nvidia chips, Salesforce jumped 12% on AI growth and its Anthropic stake, Okta surged 20% on AI-driven identity security demand, and CrowdStrike rose 11% on record revenue — together painting a picture of broad AI monetization across infrastructure, security, and software layers. Notably, Nvidia's guidance fell short of the most aggressive estimates, with some analysts calling the results "not impressive enough," suggesting the bar for surprise is now extraordinarily high even in a 70% growth environment.
𝗠𝗮𝗿𝗸𝗲𝘁 𝗜𝗺𝗽𝗮𝗰𝘁: The AI trade is broadening beyond pure-play semis into cybersecurity and SaaS, reducing single-stock concentration risk. However, Nvidia's inability to beat the loftiest expectations signals the stock may be priced for perfection — watch for rotation from Nvidia into software and security beneficiaries where earnings surprise potential is higher. S&P 500 year-end consensus has been revised up to 7,900.
━━━━━━━━━━━━━━━━━━━━
[4/5] Strait of Hormuz: Partial De-escalation, Full Uncertainty
Trump claimed 10 million barrels of oil transited Hormuz yesterday and declared it "functioning," but a senior Iranian source told Reuters a final agreement with Oman has not been reached, and US allies are casting doubt on Trump's claims that mines have been cleared. Kalshi prediction markets show reopening odds at only 50-68% through early 2028, reflecting deep uncertainty despite the headline optimism.
𝗠𝗮𝗿𝗸𝗲𝘁 𝗜𝗺𝗽𝗮𝗰𝘁: Spot gold is down nearly 1% to $4,613, suggesting markets are partially pricing in de-escalation. Oil markets appear calmer per Trump's comments, but the gap between political narrative and Iranian confirmation is a key risk — any breakdown in Oman talks could trigger a sharp reversal in energy and haven assets. Iran's claim that the US is blocking a Hormuz deal adds a geopolitical wildcard.
━━━━━━━━━━━━━━━━━━━━
[4/5] Scarcity Assets and Hard Money Inflows Surge
Bitcoin and Gold ETFs drew $7 billion in combined inflows as the scarcity trade accelerates, with Bitcoin rallying 22% since August 20 but stalling near the key $80,000 resistance level amid overbought conditions ahead of PCE data. Morgan Stanley's top fixed-income manager is scaling back bets against long-term US bonds, while JPMorgan was reportedly evaluating its own stablecoin.
𝗠𝗮𝗿𝗸𝗲𝘁 𝗜𝗺𝗽𝗮𝗰𝘁: The simultaneous bid for gold, Bitcoin, and long-duration Treasuries points to a macro hedge posture — investors appear to be buying both risk assets and insurance simultaneously, a classic late-cycle tension. PCE inflation expected at 3.6% headline and 3.3% core is the near-term catalyst; a hot print could break the Bitcoin rally at $80K and pressure rate-sensitive positioning.
━━━━━���━━━━━━━━━━━━━━
[3/5] PCE Inflation Data and Fed Policy in Focus
Headline PCE is forecast to ease to 3.6% with core holding at 3.3%, and economists are pressing incoming Fed Chair Warsh to clarify his economic views at Jackson Hole. Inflation described as "muted" while spending stalls, but core still well above target — a stagflationary undertone that complicates the Fed's path.
𝗠𝗮𝗿𝗸𝗲𝘁 𝗜𝗺𝗽𝗮𝗰𝘁: This is the day's binary macro event. A core PCE print above 3.3% likely pressures equities and keeps the Fed on hold, reinforcing Morgan Stanley's pivot away from short duration. An in-line or soft print could extend the risk rally and validate the S&P 7,900 year-end target. Warsh's Jackson Hole tone on inflation tolerance is the secondary catalyst to watch.
━━━━━━━━━━━━━━━━━━━━
[2/5] Canada-US Trade War Intensifies as Tariff Tensions Escalate
Canada is uniting in fury against Trump's latest tariff salvo, with a former trade negotiator warning relations are set to get "rockier," while Trump simultaneously moved to ban some foreign energy equipment from the US grid. The backdrop of US maritime plans being sent to Congress signals a broader economic nationalism push extending to shipping and energy infrastructure.
𝗠𝗮𝗿𝗸𝗲𝘁 𝗜𝗺𝗽𝗮𝗰𝘁: CAD and Canadian equities face structural headwinds if tariff escalation continues. Mexico's bonds already trading at speculative-grade spreads suggests North American trade stress is being priced into sovereign risk. Energy equipment bans could raise US grid buildout costs at a moment when data center power demand is surging — a stagflationary input cost risk for the infrastructure build.
Two Alternatives for Thinking about ethereum:native vs. bitcoin:native Risk Reward
We can use the relative performance of the largest ETH vs. BTC DATs as well as relative investor flows into spot ETH vs. BTC ETFs to get a sense of how different parts of equity markets are gauging ETH vs. BTC risk reward.
In the first case, a persistent uptrend remains firmly in place in ETH's largest DAT - $BMNR - vs. BTC's largest - $MSTR . This has been true even while ETHBTC remained rangebound in July and August 2026. When we last saw similar readings in BMNR vs. MSTR, $ETHBTC traded in 0.04-0.05 range.
In the second case, we can look at the relative capital flow dynamics for the largest ETH and BTC spot ETFs. ETH allocations via ETFs have proven much more persistent vs. spot crypto benchmarks. Thus, the aggregate allocation to ETH ETFs compared to BTC ETFs has risen to 22.8%, while Ethereum's market capitalization is under 19% of Bitcoin's. Holding everything else equal, a quick back of the envelope calculation using the 22.8% ETF-based relative market capitalization, implies an ETHUSD price of $2900.
Vox|Macro Prediction Market Synthesis - 2026-08-25 06:00 EST
Macro-relevant interpretations of collective prediction market pricing and evolutions
· Crypto regime shift is the dominant repricing event of the week. Bitcoin's probability of hitting $82,500 in August surged +50.9pp to 51.3% in a single week, while the $85,000 by year-end contract jumped +54pp to 73.5% — the two highest 1-week flow scores in the dataset. Ethereum's $1,750 floor contract collapsed -61pp, meaning markets have aggressively repriced out the bear-case scenario for ETH. Solana's $110 August target moved +31.1pp to 32.6%. This is broad-based crypto revaluation, not a Bitcoin-only move: sophisticated capital is rotating into the asset class across the board, with volume running 3–4× monthly averages on nearly every crypto contract. The Ethereum dip contract's 4.00× VolDev on a -61pp move is particularly telling — this was a heavily contested position that just got forcibly closed.
· Fed hold in September is now near-consensus, but the 2026 rate-hike risk is live and contested. Markets price a 65.5% probability of no change at the September meeting — up +25pp over the past month, making it the strongest 1-month directional move in the rates space. The direction is unambiguous: the hiking cycle is paused. However, the secondary "Fed rate hike in 2026" contract sits at 56.5% with an +8pp 1-week move, signaling that while September is increasingly expected to be a hold, the market has not closed the door on tightening resuming later in the year.
· US-Iran ceasefire is holding but the situation remains fragile and binary. The ceasefire-through-September contract prices 77.5% probability of continuation, while the "end of blockade by September 7" contract sits at only 14.5% — both with 4.00× VolDev spikes, indicating a surge of fresh positioning. The implied narrative: markets expect the ceasefire to persist in form but do not expect a meaningful diplomatic resolution or lifting of the blockade on any near-term timeline. The US-Iran diplomatic meeting by year-end contract fell -14.5pp to 50.5%, consistent with a frozen conflict rather than an active negotiation track.
· Russia is advancing on the Ukrainian front, and markets are pricing territorial capture as near-certain in the near term. The Mykolaivka capture-by-September contract surged +46.5pp to 85.0% in a single week on 3.56× volume — one of the sharpest single-week geopolitical repricings in the dataset. The Kostyantynivka full-capture-by-year-end contract sits at 54.5%, up +7.5pp over the month. These moves together describe a market that has just received new battlefield information and is rapidly updating toward Russian operational success on at least one axis of advance.
· Crypto regulatory clarity is being priced out, not in. The Clarity Act (H.R.3633) signing probability has fallen -23pp over the month to 14.5%, with 1.80× elevated volume — the largest 1-month decline in any contract in the dataset. Despite the simultaneous and dramatic crypto price rally, legislative legitimization of the space is being repriced as increasingly unlikely in 2026. This is a notable divergence: asset prices are surging while the regulatory framework that would institutionalize those gains is losing probability. This creates a structural vulnerability — the rally is happening without the policy backstop the market had previously expected.
· South Carolina's Senate Republican primary is being actively repriced. Ralph Norman's probability of being the GOP nominee jumped +24pp in a week to 34.5% on 2.27× volume. While a state-level primary, a contested Senate seat in a safe Republican state is relevant to the 2026 balance-of-power question — the full "R Senate, R House" contract sits at only 11.5% and is drifting lower (-2pp over the month), suggesting markets are not pricing Republican consolidation of Congress regardless of individual race outcomes.
· AI capability acceleration is being priced as near-certain on a short horizon. The "next Mythos-class model released by September 30" contract moved +12.5pp in a week to 86.5% on 3.11× volume. This is a secondary but macro-relevant signal: rapid frontier model releases affect productivity assumptions, capital expenditure cycles in data infrastructure, and the competitive positioning of major technology economies — all of which feed into longer-duration growth and rate expectations.
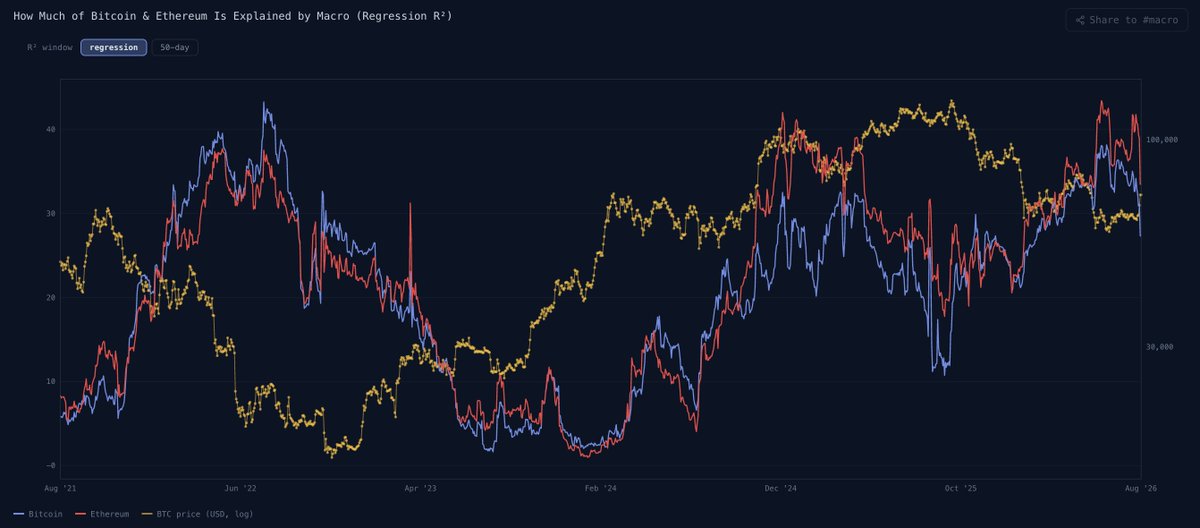
Major macro assets have been explaining a growing and important share of major crypto price action for the past year. This most recent price acceleration represents a notable decoupling, with the crypto move one of the most idiosyncratic of the past year.
Taking the Temperature of the Latest Crypto Rally
The improved risk sentiment in crypto comes in the midst of a protracted, generalized price drawdown. The rally was concentrated in a small share of the largest coins like BTC or ETH. If we look at the top 100 largest coins by market capitalization, most continue to underperform BTC on a week-to-week or month-to-month basis.
Onchain, we are seeing some early signs of a turn in daily active address activity. Moving averages of this metric have stabilized on Ethereum and Bitcoin. Even after the initial spike in activity on Bitcoin associated with coins moving out of tainted Coldcard wallets, we continue to see onchain activity stabilize.
For those who follow this sort of rainbow-chart analysis that purports to dimension and predict $BTC or $ETH price trends in some deterministic way - like this guy @ITC_Crypto who has banned me for pointing this out - this is a reminder that the calibration is incredibly sensitive to the data selected.
If you run point-in-time comparisons which answer the question - 'What would the predicted price be 1-5 years out if I ran this power-law trend analysis in 2013 or 2015?' - you can see how wildly different the rainbows can be.
It's perfectly defensible to be long $BTC or $ETH but not for these kind of reasons.
Vox|Macro News Pulse — 2026-08-19 12:00 EST
Intraday macro developments and news flow ranked by salience and market impact.
[5/5] Bond Market Rout & Treasury Intervention
Long-term US yields have surged to multiyear highs, triggering a sharp sell-off in rate-sensitive assets, with the 10-year Treasury near 4.70% and analysts calling for a move above 5% this year. The Treasury Department has responded by doubling long-term debt buybacks, with Secretary Bessent deploying this tool as a direct signal of concern over the yield surge — while Ken Fisher's firm is reportedly making a $4 billion contrarian bond trade into the move.
𝗠𝗮𝗿𝗸𝗲𝘁 𝗜𝗺𝗽��𝗰𝘁: The dollar is actually falling on the buyback news (Bloomberg: "Dollar Tumbles to Weakest in Three Months"), suggesting markets are reading the intervention as fiscal stress rather than stabilizing confidence — a notable bearish divergence for USD bulls. Chip stocks (PHLX Semi Index down 18% from highs, nearing bear market) remain the most exposed equity sector to yield pressure. Bonds are catching a short-term breather but the structural supply/demand imbalance remains unresolved.
━━━━━━━━━━━━━━━━━━━━
[4/5] AI Infrastructure Buildout — Deals, Debt, and Political Pushback
The AI capex boom is accelerating across multiple vectors: Marvell signed a $12.2 billion share deal with Google, Anthropic-tied data centers secured a $1.3 billion private credit loan, Nebius is raising $4.5 billion in convertible bonds, and Nvidia is brokering Nordic data center deals. However, a significant counter-narrative is emerging as political opposition to data centers grows, with Pennsylvania, New York, and Texas all imposing new restrictions, forcing Meta, Microsoft, and OpenAI into public charm offensives.
𝗠𝗮𝗿𝗸𝗲𝘁 𝗜𝗺𝗽𝗮𝗰𝘁: Marvell popped 6% on its Google deal while broader semis remain under pressure from yields, illustrating a bifurcation between AI-direct beneficiaries and the broader chip complex. The political risk to data center permitting is an underappreciated headwind for hyperscaler capex timelines. Private credit is becoming the marginal funder of AI infrastructure, worth watching for non-accrual risk given headlines flagging rising defaults in that space.
━━━━━━━━━━━━━━━━━━━━
[4/5] Tariff Whiplash — Canada Delay, Target Windfall, Mexico Dispute
Trump delayed 50% Canada tariffs at the last minute after a tentative deal with PM Carney, continuing the pattern of brinkmanship followed by last-minute reprieves. Target's profits doubled in part due to a $1 billion tariff refund from Washington's return program, illustrating how tariff policy is now a direct earnings variable for US retailers. Meanwhile Mexico is contesting a US dumping ruling on strawberries, signaling trade friction is broadening beyond headline partners.
𝗠𝗮𝗿𝗸𝗲𝘁 𝗜𝗺𝗽𝗮𝗰𝘁: TGT surged on its print while Lowe's gave a muted outlook, together painting a picture of a consumer that is bifurcated and tariff-sensitive. The Canada delay is short-term relief for CAD and Canadian equities but the three-day window means uncertainty persists. Soaring diesel prices flagged in the FT newsletter add an inflationary undercurrent that complicates Fed optionality.
━━━━━━━━━━━��━━━━━━━━
[3/5] Moderna/Merck Cancer Vaccine — Biotech Re-Rating Event
Moderna shares more than doubled after a successful late-stage melanoma vaccine trial conducted with Merck, representing one of the largest single-day biotech moves in recent memory and potentially validating mRNA technology's application beyond infectious disease. Merck stock also surged materially on the news.
𝗠𝗮𝗿𝗸𝗲𝘁 𝗜𝗺𝗽𝗮𝗰𝘁: This is a genuine sector catalyst — the FT notes the trial results are promising but still inconclusive for patient outcomes, flagging a risk that the market may be front-running regulatory and commercial timelines aggressively. Watch for read-across into broader oncology and mRNA-platform names. The move also provides a rare positive catalyst in an otherwise risk-off tape driven by bond yields.
━━━━━━━━━━━━━━━━━━━━
[2/5] Middle East Escalation — UAE Severs Iran Economic Ties
The UAE has cut all economic and trade ties with Iran following what it described as Iranian missile strikes on its territory, representing a significant escalation in the US-Iran conflict's regional spillover. Iran risks losing a critical economic lifeline as UAE was a key conduit for sanctions evasion and trade.
𝗠𝗮𝗿𝗸𝗲𝘁 𝗜𝗺𝗽𝗮𝗰𝘁: Crude oil is rising for a fourth consecutive day (WTI ~$85-86) with no ceasefire in sight, and the UAE move materially tightens Iran's economic options while raising Gulf tension. Energy longs remain supported; the combination of oil above $85 and diesel price spikes flagged separately creates a stagflationary input cost headwind that compounds the bond market stress already pressuring equities.