📊 Settled · Day 43
The 761 SPY iron fly we opened → -$21 🔻
SPY closed 757.25 — past our strike, loss was capped.
Equity $8,921 (-10.8%) · 21/43 W. Log: https://t.co/3Q80jr9TT8
Paper, not advice. #0DTE#options
I built an options strategy. Instead of posting a backtest and calling it proof, I'm forward-testing it live, in public — every trade auto-logged to a public Google Sheet. Win or lose, on the record. Here's what it is 🧵
📤 Entered · 2026-11-11 15:52 ET (near close)
Sold a 1-lot SPY iron fly at 760.65:
• short 761 call + 761 put (collect premium)
• long 754 put + 768 call (cap the loss)
Keep $359 if SPY ≈761 by 11/12; max loss $346.
📊 Live log: https://t.co/3Q80jr9TT8
Paper, not advice.
📤 Entered · 2026-11-11 15:53 ET (near close)
Sold a 1-lot SPY iron fly at 760.66:
• short 761 call + 761 put (collect premium)
• long 754 put + 768 call (cap the loss)
Keep $360 if SPY ≈761 by 11/12; max loss $345.
📊 Live log: https://t.co/3Q80jr9TT8
Paper, not advice.
📊 Settled · Day 42
The 753 SPY iron fly we opened → +$190 ✅
SPY closed 750.01 — inside our wings, we keep the premium.
Equity $8,942 (-10.6%) · 21/42 W. Log: https://t.co/3Q80jr9TT8
Paper, not advice. #0DTE#options
📥 $RH — paper entry at the open (2026-11-11)
Entry $133.60 (signal 2026-11-10)
🎯 Target $146.96 (+10%) · 🛑 Stop $124.25 (-7%)
Booked after the close from completed daily bars; a gap through the stop fills at the open.
⚠️ Quant research only. NOT financial advice.
�� Entered · 2026-11-09 15:53 ET (near close)
Sold a 1-lot SPY iron fly at 753.37:
• short 753 call + 753 put (collect premium)
• long 744 put + 762 call (cap the loss)
Keep $491 if SPY ≈753 by 11/10; max loss $414.
📊 Live log: https://t.co/3Q80jr9TT8
Paper, not advice.
📊 Settled · Day 41
The 765 SPY iron fly we opened → -$487 🔻
SPY closed 733.11 — past our strike, loss was capped.
Equity $8,753 (-12.5%) · 20/41 W. Log: https://t.co/3Q80jr9TT8
Paper, not advice. #0DTE#options
Weekly Analyst Target Scan (Nov 06, 2026) [3/3] -- continued
Not financial advice. Research only -- see full disclaimer.
==================================================
SHORT SETUPS: None passed quality filters this week.
Most overvalued S&P 500 names are in raise-wave momentum (don't fade).
Thread note: the full detail for 2 long picks does not fit one 4000-character post, so this is a 3-post thread published at full detail. No pick and no line was dropped for length, and each post carries the deep-dive charts for the picks it describes.
Key insight: signal works in BOTH directions. LONG = price snaps UP to target. SHORT = price reverts DOWN from above-target extreme. Both require the analyst wave to have STALLED, not still accelerating.
Exit rule: monitor accurate banks weekly. Long exit = wave of cuts. Short exit = wave of raises. Don't fight the tape.
Method notes: win rates count ONE observation per episode, not one per day inside the band (the day count and the independent subsample are shown beside it). LONG stops are measured on intraday lows and SHORT stops on intraday highs -- they are different numbers, and a stop hit rate is only published when at least 5 episode entries stand behind it (the n is printed with the rate). Bank accuracy is empirical-Bayes shrunk. Targets set before the company's last SEC material event are flagged and cap the grade. A SHORT setup carries no letter grade: the grade is a long-side score.
DISCLAIMER: Quantitative research and market analysis only. NOT financial advice, not a recommendation to buy, sell, or hold any security. Past patterns do not guarantee future results. Do your own due diligence and consult a licensed financial advisor before any trade.
#FinTwit #StockMarket #SP500
Weekly Analyst Target Scan (Nov 06, 2026) [1/3]
I scanned 499 S&P 500 stocks against Wall Street analyst price targets -- each stock's full published target history from JP Morgan, Goldman, Morgan Stanley, UBS, and others.
89% are below consensus. 2 high-quality picks passed all filters (Grade A/B, 6M win rate >= 60%, avg return >= 10%, >= 4 episodes, no downgrade cycle, no hard EDGAR veto):
1 new, 1 still held from earlier weeks. NEW = never called before (or first call since a gap of 3+ weeks); HELD = called in a recent run and still qualifying. New picks are listed first.
Post 1 of a 3-post thread -- every pick that qualified is in it at full detail, nothing was cut for length. Full disclaimer in the final post of this thread.
Not financial advice. Research only -- see full disclaimer.
1. $DELL (Dell Technologies Inc.) $328.53 -> target $580.34 [NEW]
-43.4% below consensus | 0th percentile | Grade: A+
1M: +24% (100% win) | 3M: +53% (100% win) | 6M: +76% (100% win) | 12M: +123% (100% win)
Sample: 4 6M episodes over 8y (11 in-band days, 3x overlap all-horizon), 95% CI 51-100% on these same 4
Of those, 3 are strictly non-overlapping (independent): 3/3 won = 100% [95% CI 44-100%]
Worst 6M: +23.7% | Worst DD (intraday): -29.0%
Target freshness: 19% of consensus support is POST-DEBT_FINANCING (2026-09-15) | 4 fresh / 17 stale
EDGAR credit stress: 0/100
Registered offerings (424B/FWP shelf takedowns), 2 in the last 180d: 2026-09-09 (FWP/424B2/8-K), 2026-06-10 (8-K/FWP/424B2) -- graded below the thesis-event threshold, so they do NOT reset the target-freshness clock
Analysts RAISING: 24 raises, 1 cuts in 90d
NO CERTIFIED STOP: with only 5 episode entries the data cannot establish any stop between -5% and -30% as statistically safe. Size small.
Long stop hit rates: NOT PUBLISHED -- no level has the 5 episode entries needed to state a rate
Worst observed episode (none lost): 3M +30.5%, 6M +23.7%
Deepest drawdown before recovery: -29.0% (measured on intraday lows)
Watch flag (NOT an exit): 3+ analyst cuts with 0 raises in any 30-day window. Backtested 2012-2026: no measurable edge (63d after firing +0.6pp vs non-fires, 95% CI -0.8 to +2.1). The stop is the exit.
Most accurate banks (shrunk): UBS (65% adj / 65% raw, n=20), Loop Capital (66% adj / 75% raw, n=4), Raymond James (64% adj / 57% raw, n=29)
Accurate banks (90d): 4 raise(s), 0 cut(s)
Smart money (90d): JP Morgan (66% accuracy, n=24) raised to $635; UBS (65% accuracy, n=20) raised to $500; UBS (65% accuracy, n=20) raised to $455
--> Accurate banks are RAISING -- bullish
WATCH: JP Morgan (66% acc, $635), UBS (65% acc, $500) -- if they cut, thesis weakens
RED FLAG: JP Morgan + UBS both cut in same window = exit immediately
Weekly Analyst Target Scan (Nov 06, 2026) [2/3] -- continued
Not financial advice. Research only -- see full disclaimer.
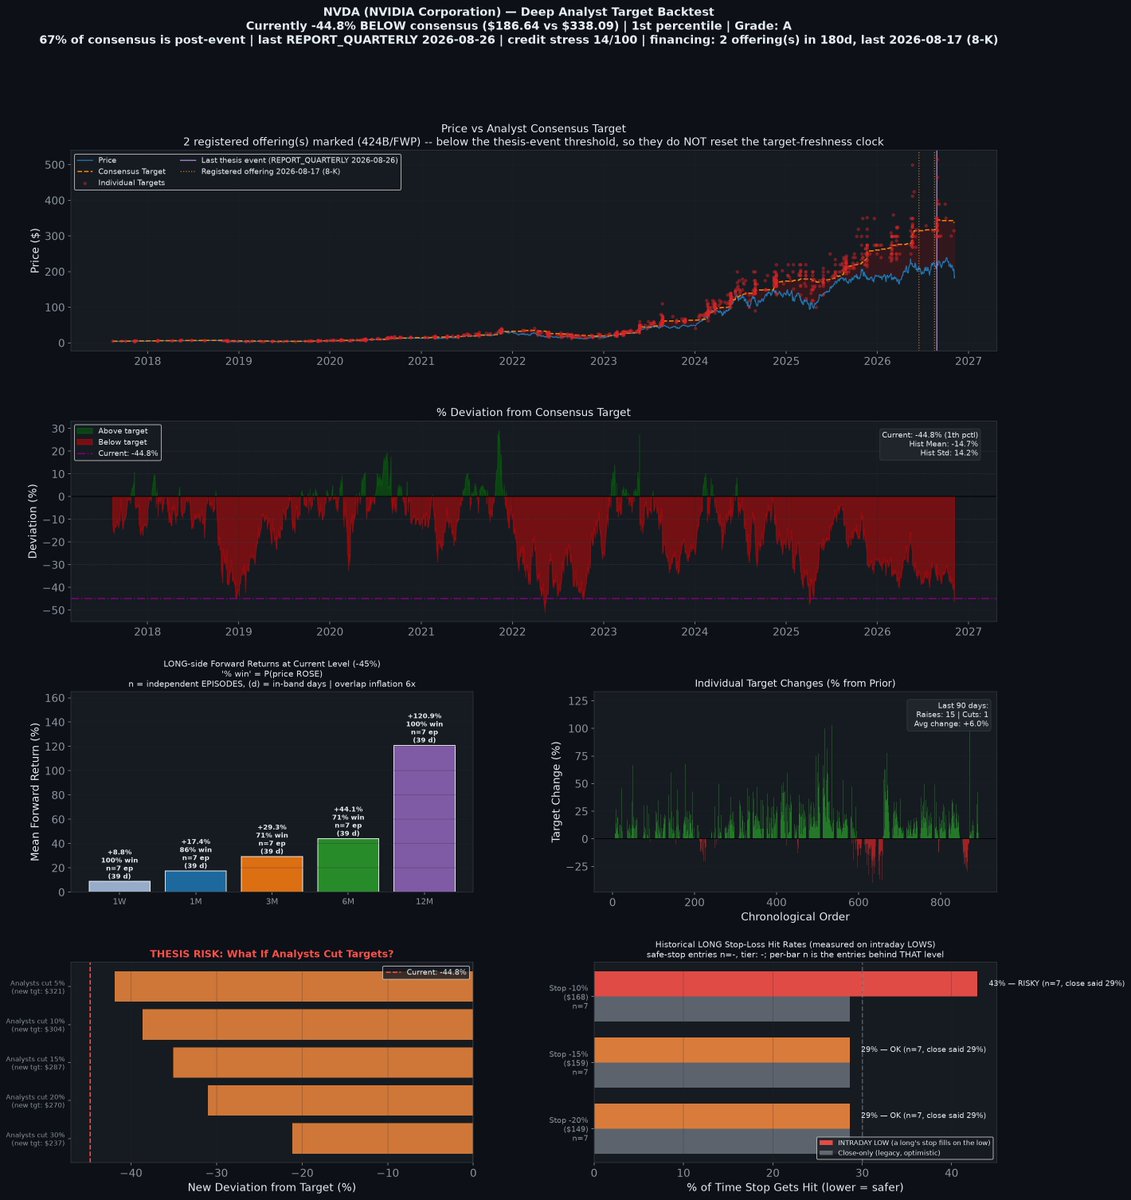
2. $NVDA (NVIDIA Corporation) $186.64 -> target $338.09 [HELD]
-44.8% below consensus | 1st percentile | Grade: A
HELD -- NOT a new call. First called 2026-06-26 at $192.53, now $186.64 (-3.1% since). 15th straight run it has qualified.
Already in it from that first call? Do NOT open it twice -- this is the same position re-published. It is a second chance only for a reader who never entered.
1M: +17% (86% win) | 3M: +29% (71% win) | 6M: +44% (71% win) | 12M: +121% (100% win)
Sample: 7 6M episodes over 9y (39 in-band days, 6x overlap all-horizon), 95% CI 36-92% on these same 7
Of those, 3 are strictly non-overlapping (independent): 2/3 won = 67% [95% CI 21-94%]
Worst 6M: -29.9% | Worst DD (intraday): -41.2%
Target freshness: 67% of consensus support is POST-REPORT_QUARTERLY (2026-08-26) | 20 fresh / 10 stale
EDGAR credit stress: 14/100
Registered offerings (424B/FWP shelf takedowns), 2 in the last 180d: 2026-08-17 (8-K), 2026-06-15 (FWP/424B5) -- graded below the thesis-event threshold, so they do NOT reset the target-freshness clock
Analysts RAISING: 15 raises, 1 cuts in 90d
NO CERTIFIED STOP: with only 8 episode entries the data cannot establish any stop between -5% and -30% as statistically safe. Size small.
Long stop hit rates (intraday LOW): -10%: 43% (n=7), -15%: 29% (n=7), -20%: 29% (n=7)
If setup fails: worst observed: 3M -16.4%, 6M -29.9%
Deepest drawdown before recovery: -41.2% (measured on intraday lows)
Watch flag (NOT an exit): 3+ analyst cuts with 0 raises in any 30-day window. Backtested 2012-2026: no measurable edge (63d after firing +0.6pp vs non-fires, 95% CI -0.8 to +2.1). The stop is the exit.
Most accurate banks (shrunk): Evercore ISI Group (66% adj / 67% raw, n=20), Needham (73% adj / 76% raw, n=34), UBS (78% adj / 82% raw, n=31)
Accurate banks (90d): 5 raise(s), 2 cut(s)
Smart money (90d): UBS (78% accuracy, n=31) raised to $300; Morgan Stanley (76% accuracy, n=48) raised to $300; Needham (73% accuracy, n=34) cut to $300
--> Accurate banks are RAISING -- bullish
WATCH: UBS (78% acc, $300), Morgan Stanley (76% acc, $300) -- if they cut, thesis weakens
RED FLAG: UBS + Morgan Stanley both cut in same window = exit immediately
📤 Entered · 2026-11-04 15:53 ET (near close)
Sold a 1-lot SPY iron fly at 767.51:
• short 770 call + 770 put (collect premium)
• long 760 put + 780 call (cap the loss)
Keep $418 if SPY ≈770 by 11/5; max loss $587.
📊 Live log: https://t.co/3Q80jr9TT8
Paper, not advice.
📊 Settled · Day 40
The 772 SPY iron fly we opened → +$210 ✅
SPY closed 769.36 — inside our wings, we keep the premium.
Equity $9,240 (-7.6%) · 20/40 W. Log: https://t.co/3Q80jr9TT8
Paper, not advice. #0DTE#options
Weekly Analyst Target Scan (Oct 30, 2026) [3/3] -- continued
Not financial advice. Research only -- see full disclaimer.
3. $AXON (Axon Enterprise, Inc.) $427.77 -> target $688.00 [HELD]
-37.8% below consensus | 6th percentile | Grade: B
HELD -- NOT a new call. First called 2026-09-18 at $447.76, now $427.77 (-4.5% since). 5th straight run it has qualified.
Already in it from that first call? Do NOT open it twice -- this is the same position re-published. It is a second chance only for a reader who never entered.
1M: +2% (53% win) | 3M: +6% (47% win) | 6M: +16% (60% win) | 12M: +72% (100% win)
Sample: 15 6M episodes over 8y (100 in-band days, 7x overlap all-horizon), 95% CI 36-80% on these same 15
Of those, 5 are strictly non-overlapping (independent): 3/5 won = 60% [95% CI 23-88%]
Worst 6M: -37.6% | Worst DD (intraday): -46.4%
Target freshness: 22% of consensus support is POST-DEBT_FINANCING (2026-09-21) | 2 fresh / 7 stale
EDGAR credit stress: 53/100
Registered offerings (424B/FWP shelf takedowns), 1 in the last 180d: 2026-09-15 (424B5/8-K/FWP), 2025-12-10 (8-K/8-K/A) -- graded below the thesis-event threshold, so they do NOT reset the target-freshness clock
FLAGS (grade-capping, not disqualifying): TARGETS_PRE_EVENT_STALE
Analysts RAISING: 5 raises, 2 cuts in 90d
NO CERTIFIED STOP: with only 19 episode entries the data cannot establish any stop between -5% and -30% as statistically safe. Size small.
Long stop hit rates (intraday LOW): -10%: 89% (n=18), -15%: 81% (n=16), -20%: 60% (n=15)
If setup fails: worst observed: 3M -27.8%, 6M -37.6%
Deepest drawdown before recovery: -46.4% (measured on intraday lows)
Watch flag (NOT an exit): 3+ analyst cuts with 0 raises in any 30-day window. Backtested 2012-2026: no measurable edge (63d after firing +0.6pp vs non-fires, 95% CI -0.8 to +2.1). The stop is the exit.
Most accurate banks (shrunk): JMP Securities (70% adj / 71% raw, n=14), Barclays (73% adj / 77% raw, n=14), Needham (70% adj / 71% raw, n=29)
Accurate banks (90d): 1 raise(s), 0 cut(s)
Smart money (90d): Barclays (73% accuracy, n=14) raised to $688
--> Accurate banks are RAISING -- bullish
WATCH: Barclays (73% acc, $688) -- if they cut, thesis weakens
RED FLAG: Barclays cuts target = exit immediately
==================================================
SHORT SETUPS: None passed quality filters this week.
Most overvalued S&P 500 names are in raise-wave momentum (don't fade).
Thread note: the full detail for 3 long picks does not fit one 4000-character post, so this is a 3-post thread published at full detail. No pick and no line was dropped for length, and each post carries the deep-dive charts for the picks it describes.
Key insight: signal works in BOTH directions. LONG = price snaps UP to target. SHORT = price reverts DOWN from above-target extreme. Both require the analyst wave to have STALLED, not still accelerating.
Exit rule: monitor accurate banks weekly. Long exit = wave of cuts. Short exit = wave of raises. Don't fight the tape.
Method notes: win rates count ONE observation per episode, not one per day inside the band (the day count and the independent subsample are shown beside it). LONG stops are measured on intraday lows and SHORT stops on intraday highs -- they are different numbers, and a stop hit rate is only published when at least 5 episode entries stand behind it (the n is printed with the rate). Bank accuracy is empirical-Bayes shrunk. Targets set before the company's last SEC material event are flagged and cap the grade. A SHORT setup carries no letter grade: the grade is a long-side score.
DISCLAIMER: Quantitative research and market analysis only. NOT financial advice, not a recommendation to buy, sell, or hold any security. Past patterns do not guarantee future results. Do your own due diligence and consult a licensed financial advisor before any trade.
#FinTwit #StockMarket #SP500
Weekly Analyst Target Scan (Oct 30, 2026) [1/3]
I scanned 499 S&P 500 stocks against Wall Street analyst price targets -- each stock's full published target history from JP Morgan, Goldman, Morgan Stanley, UBS, and others.
89% are below consensus. 3 high-quality picks passed all filters (Grade A/B, 6M win rate >= 60%, avg return >= 10%, >= 4 episodes, no downgrade cycle, no hard EDGAR veto):
None of these is new: all 3 are HELD positions first called in earlier weeks. Each line below gives the first call date and price -- do not open one twice.
Post 1 of a 3-post thread -- every pick that qualified is in it at full detail, nothing was cut for length. Full disclaimer in the final post of this thread.
Not financial advice. Research only -- see full disclaimer.
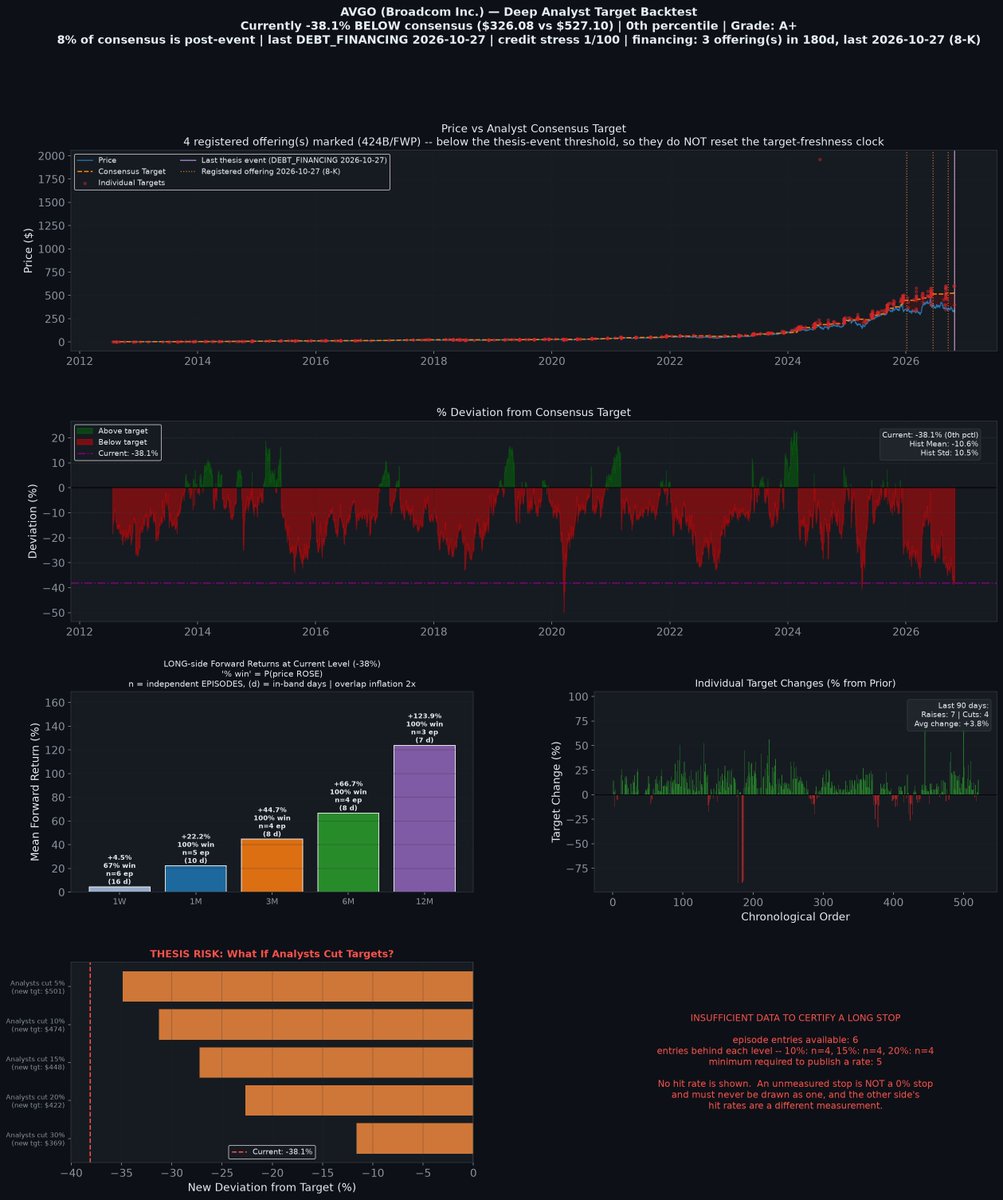
1. $AVGO (Broadcom Inc.) $326.08 -> target $527.10 [HELD]
-38.1% below consensus | 0th percentile | Grade: A+
HELD -- NOT a new call. First called 2026-08-14 at $392.99, now $326.08 (-17.0% since). 10th straight run it has qualified.
Already in it from that first call? Do NOT open it twice -- this is the same position re-published. It is a second chance only for a reader who never entered.
1M: +22% (100% win) | 3M: +45% (100% win) | 6M: +67% (100% win) | 12M: +124% (100% win)
Sample: 4 6M episodes over 14y (8 in-band days, 2x overlap all-horizon), 95% CI 51-100% on these same 4
Of those, 3 are strictly non-overlapping (independent): 3/3 won = 100% [95% CI 44-100%]
Worst 6M: +13.8% | Worst DD (intraday): -33.5%
Target freshness: 8% of consensus support is POST-DEBT_FINANCING (2026-10-27) | 2 fresh / 24 stale
EDGAR credit stress: 1/100
Registered offerings (424B/FWP shelf takedowns), 3 in the last 180d: 2026-10-27 (8-K), 2026-09-18 (424B3) -- graded below the thesis-event threshold, so they do NOT reset the target-freshness clock
Analysts RAISING: 7 raises, 4 cuts in 90d
NO CERTIFIED STOP: with only 6 episode entries the data cannot establish any stop between -5% and -30% as statistically safe. Size small.
Long stop hit rates: NOT PUBLISHED -- no level has the 5 episode entries needed to state a rate
Worst observed episode (none lost): 3M +19.5%, 6M +13.8%
Deepest drawdown before recovery: -33.5% (measured on intraday lows)
Watch flag (NOT an exit): 3+ analyst cuts with 0 raises in any 30-day window. Backtested 2012-2026: no measurable edge (63d after firing +0.6pp vs non-fires, 95% CI -0.8 to +2.1). The stop is the exit.
Most accurate banks (shrunk): Goldman Sachs (77% adj / 80% raw, n=15), Susquehanna (92% adj / 100% raw, n=19), Deutsche Bank (74% adj / 75% raw, n=21)
Accurate banks (90d): 1 raise(s), 0 cut(s)
Smart money (90d): Morgan Stanley (70% accuracy, n=43) raised to $505
--> Accurate banks are RAISING -- bullish
WATCH: Morgan Stanley (70% acc, $505) -- if they cut, thesis weakens
RED FLAG: Morgan Stanley cuts target = exit immediately
Weekly Analyst Target Scan (Oct 30, 2026) [2/3] -- continued
Not financial advice. Research only -- see full disclaimer.
2. $CIEN (Ciena Corporation) $320.72 -> target $517.13 [HELD]
-38.0% below consensus | 1st percentile | Grade: B
HELD -- NOT a new call. First called 2026-10-23 at $320.26, now $320.72 (+0.1% since). 2nd straight run it has qualified.
Already in it from that first call? Do NOT open it twice -- this is the same position re-published. It is a second chance only for a reader who never entered.
1M: +9% (81% win) | 3M: +14% (71% win) | 6M: +27% (85% win) | 12M: +78% (92% win)
Sample: 13 6M episodes over 15y (74 in-band days, 6x overlap all-horizon), 95% CI 58-96% on these same 13
Of those, 6 are strictly non-overlapping (independent): 4/6 won = 67% [95% CI 30-90%]
Worst 6M: -10.1% | Worst DD (intraday): -27.7%
Target freshness: 67% of consensus support is POST-REPORT_QUARTERLY (2026-09-03) | 10 fresh / 5 stale
EDGAR credit stress: 7/100
Registered offerings (424B/FWP shelf takedowns), 1 in the last 180d: 2026-06-11 (8-K), 2025-01-21 (8-K) -- graded below the thesis-event threshold, so they do NOT reset the target-freshness clock
Watch: 10 cuts, 4 raises in 90d
NO CERTIFIED STOP: with only 18 episode entries the data cannot establish any stop between -5% and -30% as statistically safe. Size small.
Long stop hit rates (intraday LOW): -10%: 54% (n=13), -15%: 23% (n=13), -20%: 15% (n=13)
If setup fails: worst observed: 3M -20.3%, 6M -10.1%
Deepest drawdown before recovery: -27.7% (measured on intraday lows)
Watch flag (NOT an exit): 3+ analyst cuts with 0 raises in any 30-day window. Backtested 2012-2026: no measurable edge (63d after firing +0.6pp vs non-fires, 95% CI -0.8 to +2.1). The stop is the exit.
Most accurate banks (shrunk): Citigroup (80% adj / 86% raw, n=23), BMO Capital (74% adj / 82% raw, n=11), Evercore ISI Group (76% adj / 85% raw, n=14)
Accurate banks (90d): 1 raise(s), 0 cut(s)
Smart money (90d): Evercore ISI Group (76% accuracy, n=14) raised to $550
--> Accurate banks are RAISING -- bullish
WATCH: Evercore ISI Group (76% acc, $550) -- if they cut, thesis weakens
RED FLAG: Evercore ISI Group cuts target = exit immediately