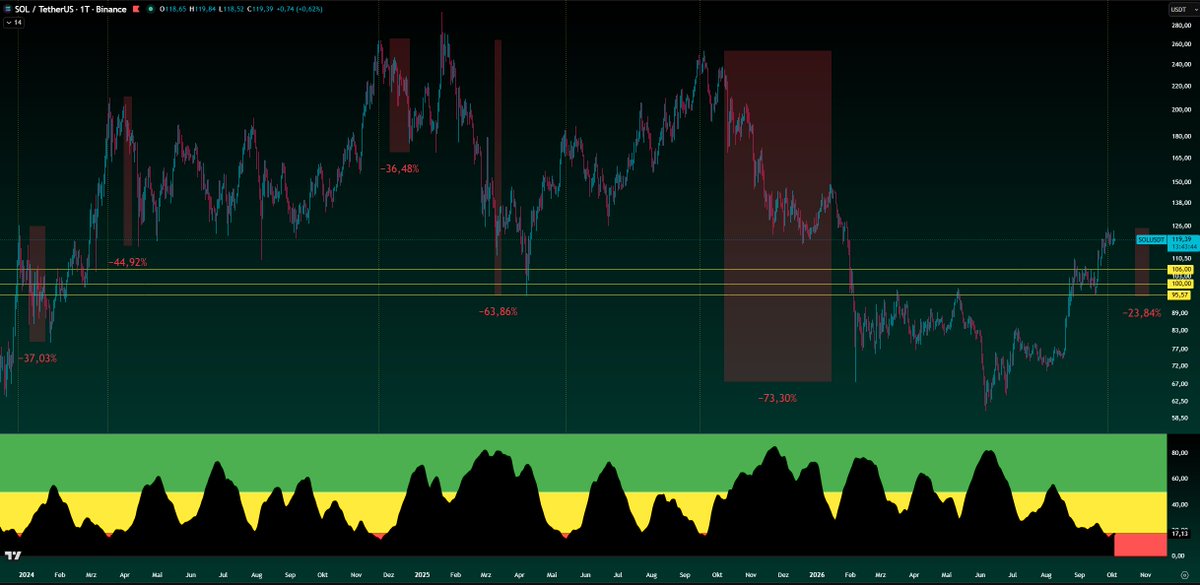
Measured from the last candle in the blue TEM zone, Solana needed 17 days back then until it first touched the yellow zone.
After that it found its last local bottom 71 days later. From the last candle in the green TEM zone it then took 39 days to the top, and that was roughly 68%.
We’re seeing the exact same setup in 2026.
Candle in the blue TEM, 21 days later the first touch of the yellow zone. After 66/69 days came the local bottom and from the last green TEM candle we’re up around 68% again.
All in all it’s 110–111 days from the last relevant TEM zone to the top.
SOL entered also the overheated zone on the higher timeframe, a rare sign that SOL is about to see a huge correction.
The second picture starts from 2023 and ends in 2026.
solana:So11111111111111111111111111111111111111112
Measured from the last weekly candle inside the green zone of the TEM, ETH found its peak within 35 days.
The top occurred exactly after 35 days (on the weekly timeframe), and the attempt to break out that week resulted in a lower high.
The first level I see for Ethereum is $2,500, with a maximum pullback to $2,200.
I expect market weakness over the next two weeks and for Bitcoin to drain liquidity from most altcoins.
I also showed patterns for Solana and Bitcoin that predicted the tops.
As long as it hasn't been invalidated, it remains valid.
Could it be that simple?
ethereum:native
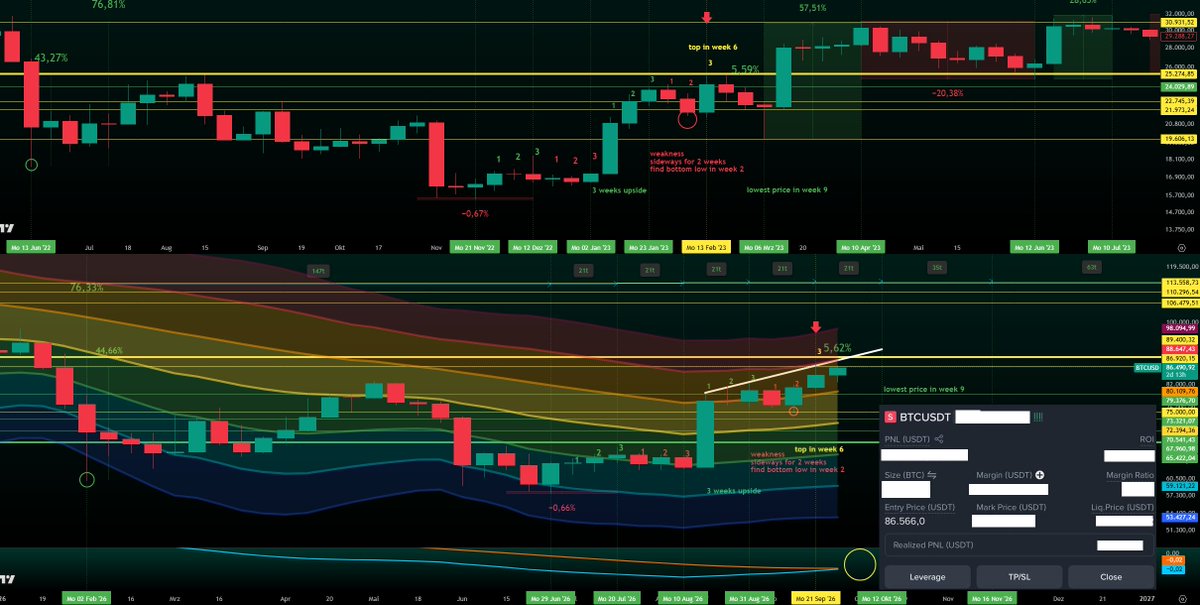
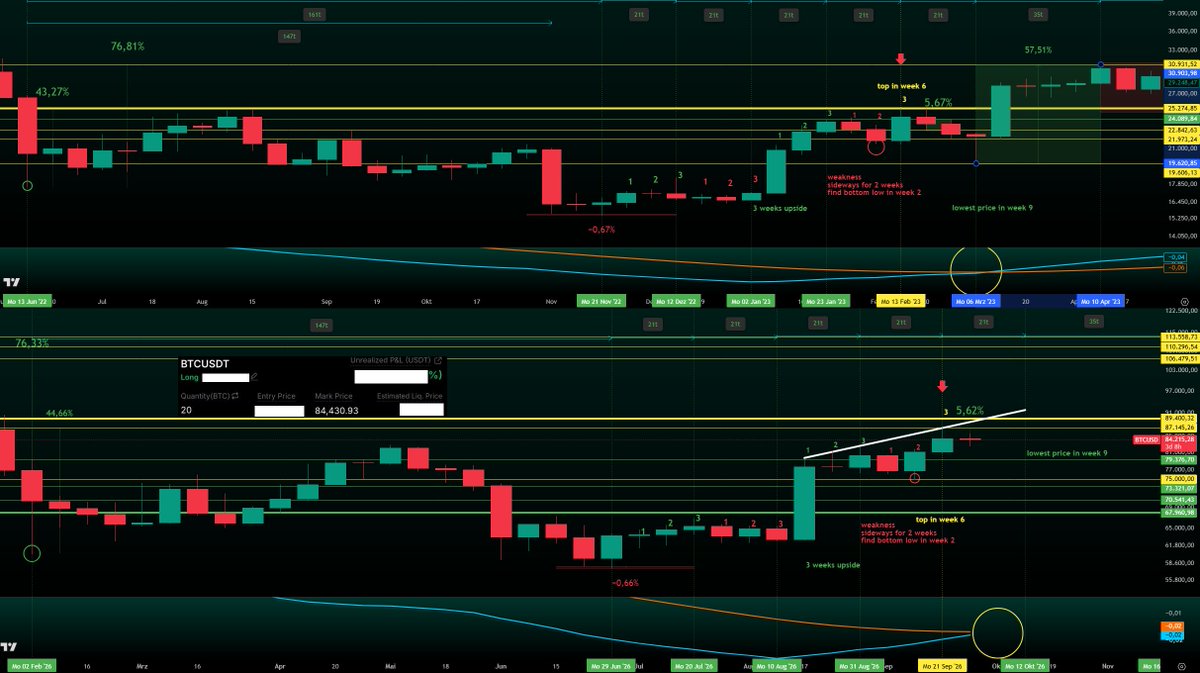
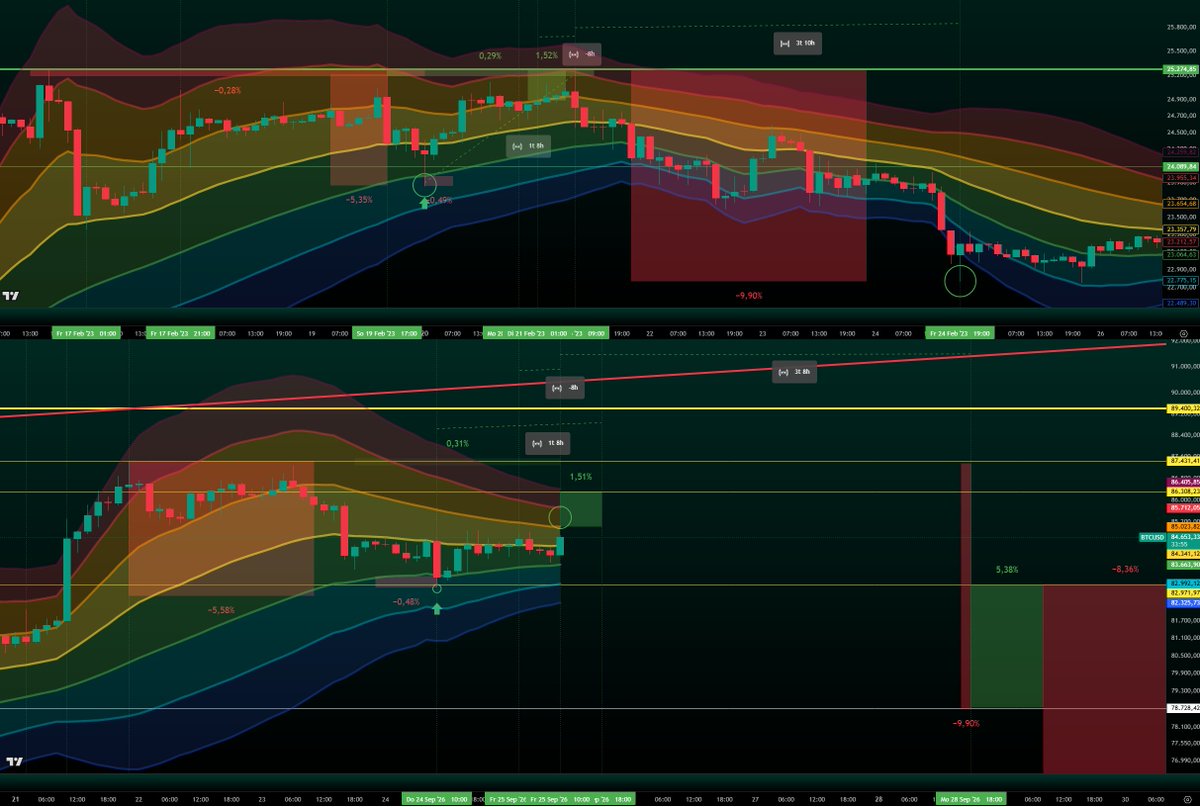
Bitcoin rejected after a 5,6% pump, exactly like 2023.
A clear reason for me to enter the short trade and close my long positions.
I am very bullish and i will start to build my swing long position soon, because i expect the bullish crossover between 5.10 and 12.10. ⌛️
Clean entry, clean exit.
Do not miss any live trades and join XAPA's WORLD
https://t.co/6atyr1dSg7
bitcoin:native
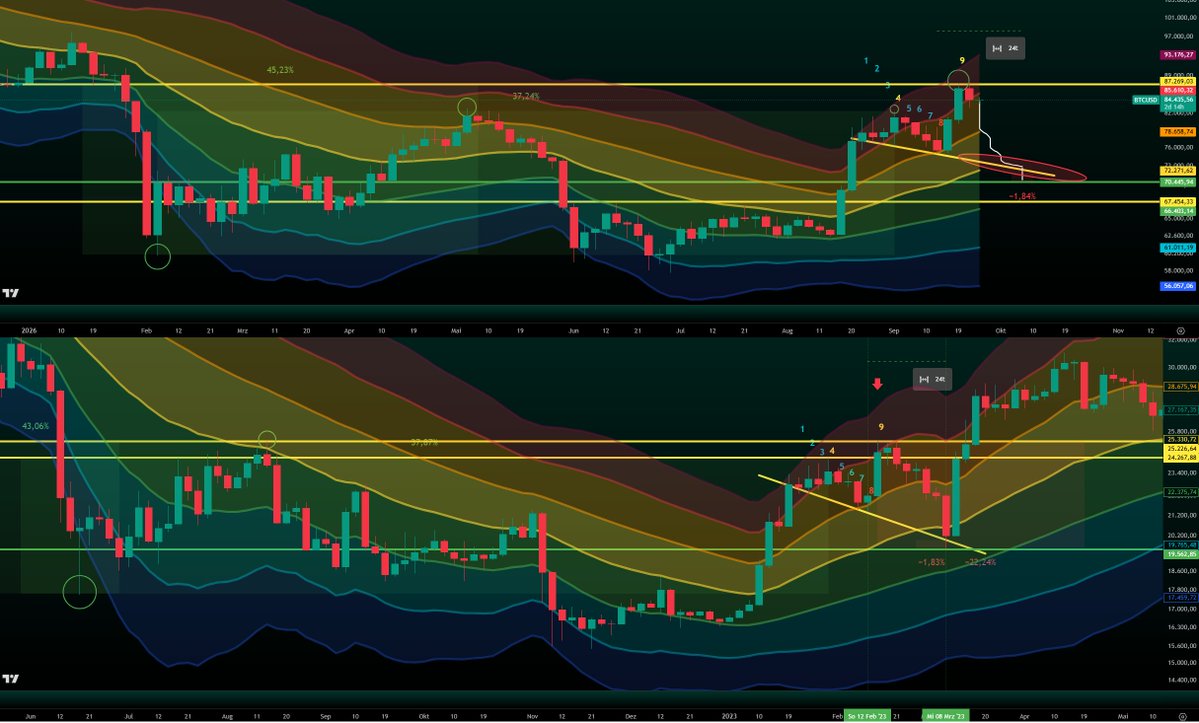
The HTF weekly pattern has played out exactly so far. Drawdowns are clearly smaller, so I don’t expect Bitcoin to go below $75,000.
I’m extremely bullish, but rational!
First the area around $87,000 has to be taken.
Once that’s done, the path almost inevitably leads toward $89,000, with momentum up to $91,000, where I expect a rejection.
Once that happens, I expect the low in the week 9.
A higher high above $87,300 would completely change the read on this pattern and would have to be treated differently.
After all this unnecessary noise, Bitcoin will rise toward $100,000 and print a new all-time high by next year.
I’ll close the 20 Bitcoin long between $87,000 and $89,000.
The chart says more than 1,000 words.
Every dip is an opportunity, a serious one.
This is a gift for our future. 🌹
bitcoin:native
If you have a plan, stick to it.
Valhalla or hell.⌛️
"
If the pattern repeats 1:1, Bitcoin would likely sit around $78–79k next week, then pump into $82/83k.
Key level to watch is the 50 weekly SMA (currently $78.2k). If BTC finds support there, the path toward $100k stays open.
If Bitcoin rejects at the previous May high, I think the 50 weekly EMA will be the next big test for Bitcoin (currently $76,500). "
bitcoin:native
Nailed. 🔨
Don’t end up as exit liquidity.
Today you’re gonna see the final pump, before Bitcoin dumps at the start of next week.
See you next week. ⌛️
bitcoin:native
Good morning ☕️
After Bitcoin printed the wick below the green TEM zone, I said we could grind sideways toward $85–87k from there. ✅
In 2023, 8 hours before the peak, BTC touched the dark orange zone and printed the high 8 hours later.
If the pattern repeats 1:1, measured from the dark yellow box, the high could be $86,300.
I expect today’s move to be the last and final pump, until the daily close. ⌛️
There is also a chance that $87,330 was the top. 🚨
What I’m expecting after the last pump?
If the pattern repeats 1:1, Bitcoin would likely sit around $78–79k next week, then pump into $82/83k.
Key level to watch is the 50 weekly SMA (currently $78.2k).
If BTC finds support there, the path toward $100k stays open.
If Bitcoin rejects at the previous May high, I think the 50 weekly EMA will be the next big test for Bitcoin (currently $76,500).
If Bitcoin reclaims the $86,000–$87,300 zone, I will open a short position.
If Bitcoin drops toward $78,000-$79,000, I will open a long position and rebuild my swing long down to $70,500, with a max target of $67,500.
This is a high-timeframe (1W) pattern! Delays or deviations may occur on lower timeframes than 1W.
bitcoin:native
Dear bears, the bear market is over and i appreciate your patience and your money. 🐻
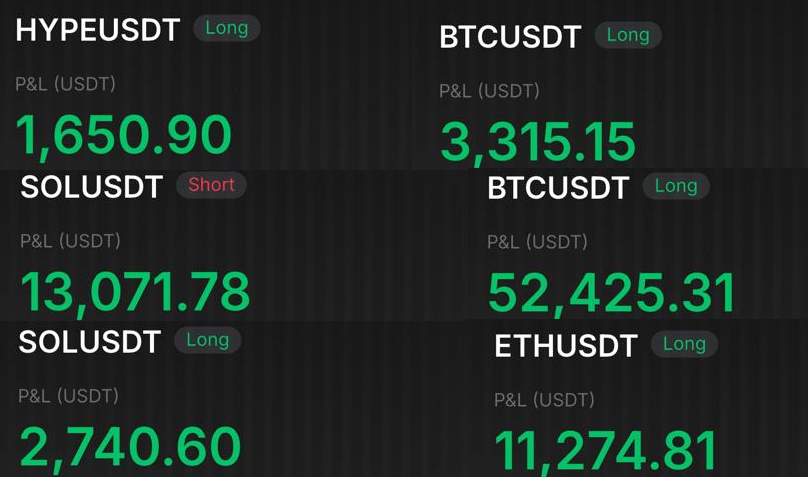
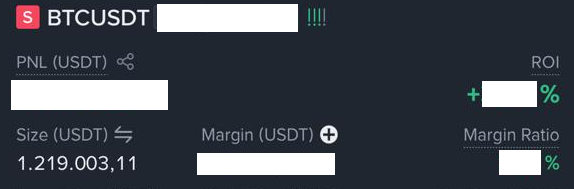
Took $100,000 off the table as realized profit from the long.
I previously closed the long position for a $290,000 profit.
Together with the $100,000, I’m simply at $390,000.
It’s all public, by the way.
Trade what you see, not what you think. 💯
The rejection zone remains $82,300–$83,800.
If that rejection holds, selling continues and price drops toward $70,500.
That is still the base case.
A smaller long position stays open in case the rejection fails and Bitcoin drives hard into $85k–$86k.
The next high could form between today and Monday. ⌛️
The $85k–$86k zone is the exact percentage extension, but only if the 2023 pattern repeats by percentage.
In 2023 Bitcoin rejected at its former high.
That is exactly the scenario I expect, the May high gets tested and a rejection takes place.
Rule number one: always protect your capital. 🎯
We’re in the early stage of a bull run.🖐️
Another trade, another win. ✅
bitcoin:native
I was right, once again. 🎯
Bitcoin hit $82,000.
Voilà. 🌹
As soon as the black bar left the overheated zone on the Paranoia Indicator, it pumped and Bitcoin made a new local high in about 20 hours.
If the pattern repeats, a rejection could occur at $82,000/$83,000 and we could see Bitcoin this week between $78,000 and $83,000 before it drops back toward $70,500.
Pump and dump.
If it rejects here, I’m looking for $73,300–$70,500 between Sept 28 and Oct 7.
Once Bitcoin breaks through that rejection with power, I’m very confident $87,000–$88,000 is the next target.
It doesn't necessarily mean it has to happen again!
Since this is a high-timeframe (1W) pattern, delays or deviations may occur on lower timeframes than 1W.
bitcoin:native
Everyone’s hunting for a reason again, Clarity Act, headlines, whatever excuse fits.
The HTF pattern was already there.
I refined it on the LTF so you could see it yourself, a clean copy-paste!
After the $82k rejection I said the target was the $75k zone, max $73k, within two weeks, then a pump back to $80k+.
Bitcoin doesn’t care if the Clarity Act passes, and it doesn’t need anyone.
If you’re still looking for news after the move, you never saw it.
The breakout in my previous video was marked for 2-4pm.
Rule number 1: Stick to your plan.
Voilà. 🎯
I've warned several times in Discord when I exit the trade and when I get back in.
It took a full 3 attempts before Bitcoin finally found support.
I now expect the move toward $80,000 to continue, followed by a dump to $70,500–$71,000. ⌛️
https://t.co/6atyr1dSg7
bitcoin:native
After the pump, the crowd finally found their perfect narrative again.
“CFTC sends crypto rules to the White House for review as Congress stalls on the Clarity Act.”
The pattern was already there before the news.
The actual breakout is marked by the green circle, exactly like in 2023.
We’re almost in the overheated zone, on the 2H timeframe, similar to 2023.
We’ve either dumped right as the black bar entered the red zone, or we’ve sat in the overheated zone for multiple days, which then pulls the black bar on higher timeframes into the red zone as well.
That means we can still see multiple pumps.
From $82,300 to $83,800 I’m expecting a strong rejection.
Once Bitcoin breaks through that rejection with power, I’m very confident 87–88k is the next target.
If it rejects here, I’m looking for $73,300–$70,500 between Sept 28 and Oct 7.
It doesn't necessarily mean it has to happen again!
Since this is a high-timeframe (1W) pattern, delays or deviations may occur on lower timeframes than 1W.
bitcoin:native