This video that covers our work showing how SARS-CoV-2 spreads in the brain and can cause #LongCovid is from almost 2 years ago. Unbelievable to see so little progress was made in this area... #CovidIsNotOver
COVID isn’t just behind us—it’s leaving a mark on everyone it touches. If you’ve had COVID two or three times, you’re 40% more likely to face serious health issues like dementia, heart disease, or stroke. Every infection brings you closer to a future where your health is at risk. And this isn’t just happening to you—it’s happening to everyone. We must be accountable. Mask up, demand better protections, and call out inaction. Contact your Congressperson today. Your health—and the health of everyone around you—depends on it.
July 26th update:
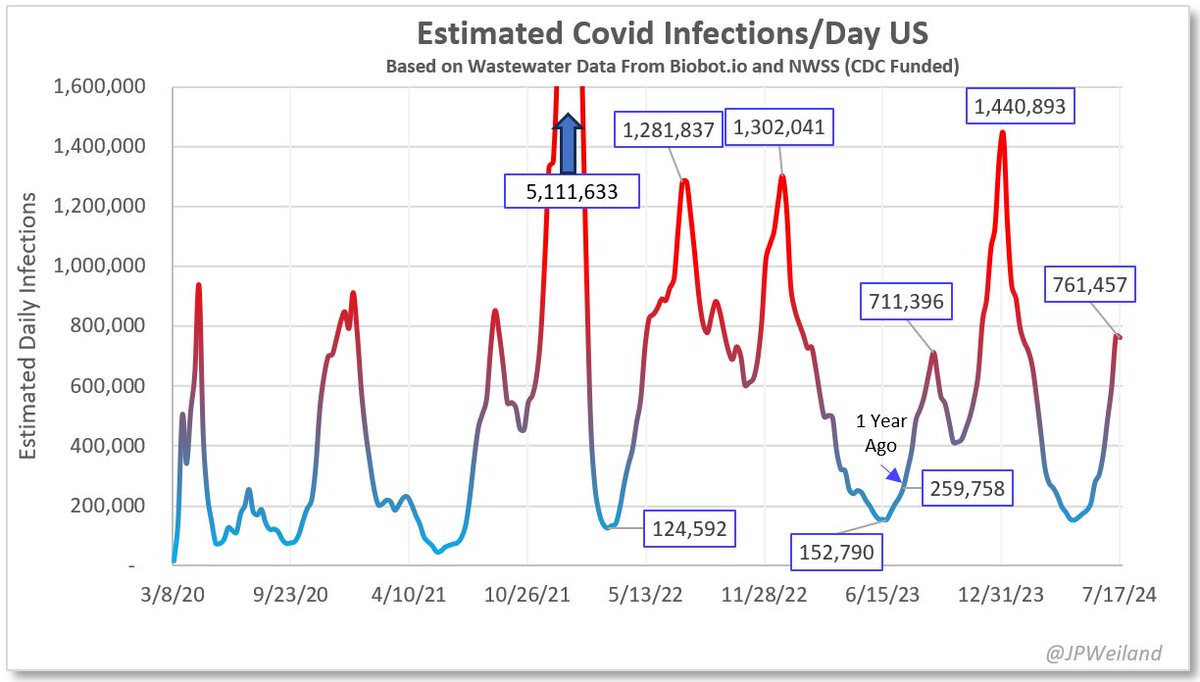
Infections flat this week after weeks of increases. This may or may not be the absolute peak, as KP.3.1.1 will become dominant in the first week of August.
🔸760,000 new infections/day
🔸1 in every 44 people currently infected
🔸37% higher than 12 month avg.
Did something Trump or Biden said at tonight's debate leave you wondering, “Is that true?”
Send it our way at [email protected] or text it to (727) 382-4727, and we’ll investigate.
1/7
PMC COVID-19 Forecast, Week of Jan 15, 2024
🔹1.2-1.5 million daily U.S. infections the next month
🔹41.2 million total infections the next month
🔹66.7 million total infections over the next 2 months
These infection rates are 30% higher than a year ago. Yet, expect considerable minimizing. Many people believe that once the peak day has passed, it's smooth sailing, what I would call "Descent Neglect."
Take an analogy: More people die, supposedly, going down Mt. Everest than going up. With COVID surges, people also underestimate how bad the 2nd half of surge mountain is likely to be. They overestimate how spiky or leptokurtic a a surge tends to be. Transmission will go down gradually, meaning extremely high transmission the next 4-6 weeks especially.
This may be fueled by a misunderstanding of how quickly transmission declines, defense mechanisms to temporarily and artificially reduce anxiety, short-term political or capital interests, or a combination of these factors.
#DescentNeglect
2/
The winter peak should arrive between Jan 3 and Jan 17. The model estimates a peak of 1.7 to 2.2 million infections per day.
If unlucky, 1 in 20 people will be infectious, and it will be the 2nd largest wave. If lucky, more like 1 in 30, and the 4th largest wave.
Consider optimistic and pessimistic scenarios not captured by these models.
Optimism:
A rosy scenario would be that the peak occurs a week earlier at a slightly lower level (1.6-1.7 infections/day like last winter or the preceding summer). The level of acceleration in transmission argues against that, in favor of a higher peak, but Biobot is reporting some unusual regional variation (much lower transmission in the U.S. South and West). Moreover, historical patterns of how transmission should or should not accelerate cannot account for existing variation on population-level immunity due to variation in prior exposure history, recency of vaccination, and how well the current vaccine matches disseminating subvariants relative to prior vaccines. Finally, Biobot wastewater sites could be overreporting, and levels could get corrected downward. Each of these factors is highly plausible, but the “rosy” scenario remains quite bleak and suggests the pandemic remains far from “over.”
Pessimism:
Also, consider more pessimistic scenarios. Current vaccination rates remain extremely low, and several other countries are reporting atypically high acceleration via wastewater data. Placing plausible hypothetical values in the model, it is difficult to imagine a scenario where the U.S. reaches 2.5 million infections/day. Sometimes, people draw graphs showing a continued acceleration like BA.1, but such models seem to reflect imagination rather than data. The data do not suggest an evidence for a BA.1-level surge.
1/
PMC COVID-19 Tracker, Dec 18, 2023
We are headed into potentially the 2nd largest COVID surge all-time in the U.S.
If #wastewater levels follow historic trends, we will reach 2 million infections/day at peak surge with 4.2% of the population actively infectious on Jan 10.
COVID-19: Pediatric Diabetes, Lung Damage, Brain Impact, Newborns, and Higher Hospitalization Rates
Studies show kids are also at risk of long-term consequences from infection and especially those <5 for higher rates of hospitalization than most adults. Let's take a look.🧵1/