Prometheus Markets is a global forex and CFD broker delivering transparent pricing, advanced technology and lightning-speed execution with spreads from 0.0 pips
4/4
🔍 A decisive break below $4,150 might expose the $3,950–$4,030 support zone. Above, $4,350–$4,400 remains the key hurdle before $4,700 comes back into focus.
Support or breakdown — what do you think?
#GoldTrading#Markets
1/4
Gold starts the week under pressure, trading near $4,158 after a >2.4% slide. Higher energy-driven inflation risks and expectations of further Fed tightening continue to weigh on XAU/USD. 📉
#Gold#XAUUSD#Trading
3/4
⚙️ Technically, $4,150 is the key area. Support here aligns with two major trendlines. If buyers defend it, XAU/USD could retest $4,350–$4,400, where the 200 EMA and former support create strong resistance.
#TechnicalAnalysis#XAUUSD
4/4
⚠️ Intervention risk remains part of the USD/JPY picture. Further yen weakness could bring renewed attention from Tokyo, while price action around 157.300–156.850 might determine whether the pullback extends.
What are you watching?
#ForexTrading
1/4
📉 USD/JPY reversed from the 159.000 area after renewed yen-related remarks from Japanese authorities. The move also broke the uptrend structure in place since 11 September, putting 157.300 back in focus.
#USDJPY#Forex
3/4
📊 Support sits near 156.850. RSI is testing the lower edge of its neutral zone, while both moving averages remain higher. That divergence could mean the current decline still lacks full momentum confirmation.
#Trading#JPY
4/4
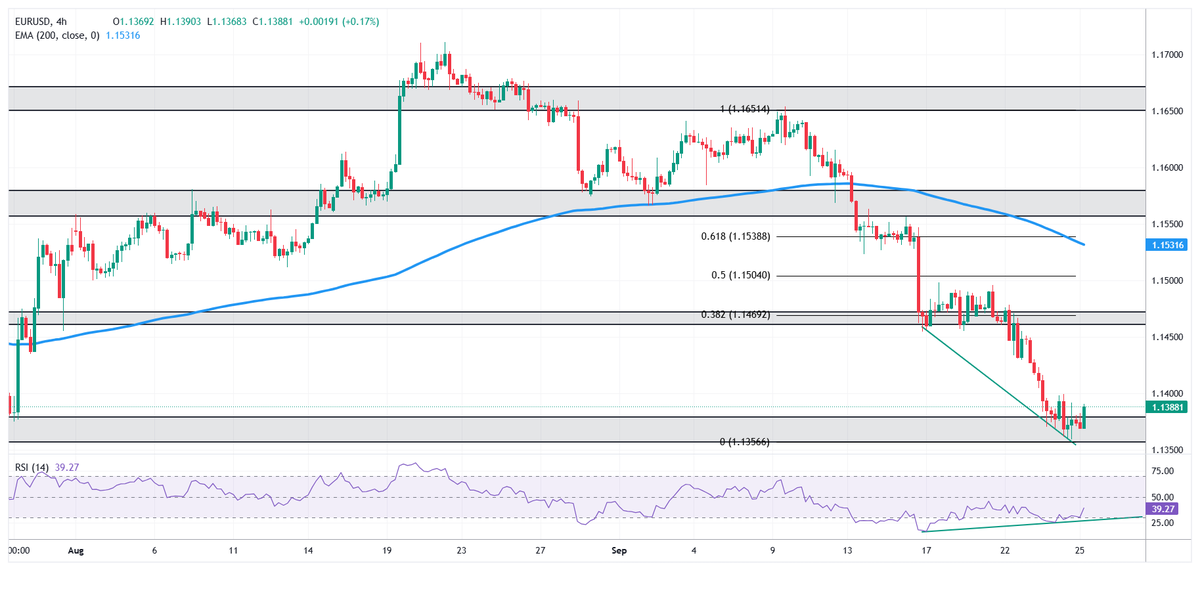
If 1.1350–1.1380 holds, EUR/USD could test 1.1460–1.1470, then 1.1538 near the 200 EMA. A clean break below support might reopen the broader downtrend. One level now matters most. 🔍
#Trading
Which way next?
1/4
EUR/USD is testing 1.1350–1.1380 after the dollar’s strongest seasonal run in over a decade. A hawkish Fed, firm US data and higher rate expectations keep pressure on the pair. 📉
#EURUSD#Forex
Can buyers hold?
3/4
Technically, EUR/USD remains in a clear downtrend—but RSI is diverging. Price is making lower lows while RSI prints higher lows near key support. That could point to fading downside momentum. 📊
#TechnicalAnalysis
Bounce or break?
4/4
RSI + MAs remain near the upper edge of neutral territory, so momentum has not fully confirmed a reversal. Bitcoin could either extend lower or return into the value area.
Which scenario are you watching?
#BitcoinTrading#Markets
1/4
📉 Bitcoin has broken below its short-term rising trend line after the latest rally. Profit-taking and shifting Fed expectations could keep volatility elevated.
The key question now: can BTC reclaim lost ground?
#Bitcoin#BTC
3/4
Resistance is concentrated above: POC at $86,270, profile high at $86,900, and trend peak near $87,300. If BTC rebounds, this cluster could become a major test.
Would you watch this zone? 📊
#BTCUSD#TechnicalAnalysis
4/4
📊 The breakout came with stronger volume, but confirmation remains incomplete. Production trends, LNG demand and inventory levels could shape the next move as traders assess whether price can hold above the triangle.
What are you watching? 👇
#XNGUSD#Trading
1/4
XNG/USD pushes above a converging triangle after US gas production fell to an 11-week low. Strong volume supported the breakout, while higher LNG flows add another demand factor. 📈
#NaturalGas#XNGUSD#Trading
3/4
⚙️ If XNG/USD slips back inside the profile, attention could shift to the $2.880 POC and $2.860 profile low. Below that, $2.820 remains a key support area. RSI is firm, but moving averages are still catching up.
#PriceAction#NaturalGas