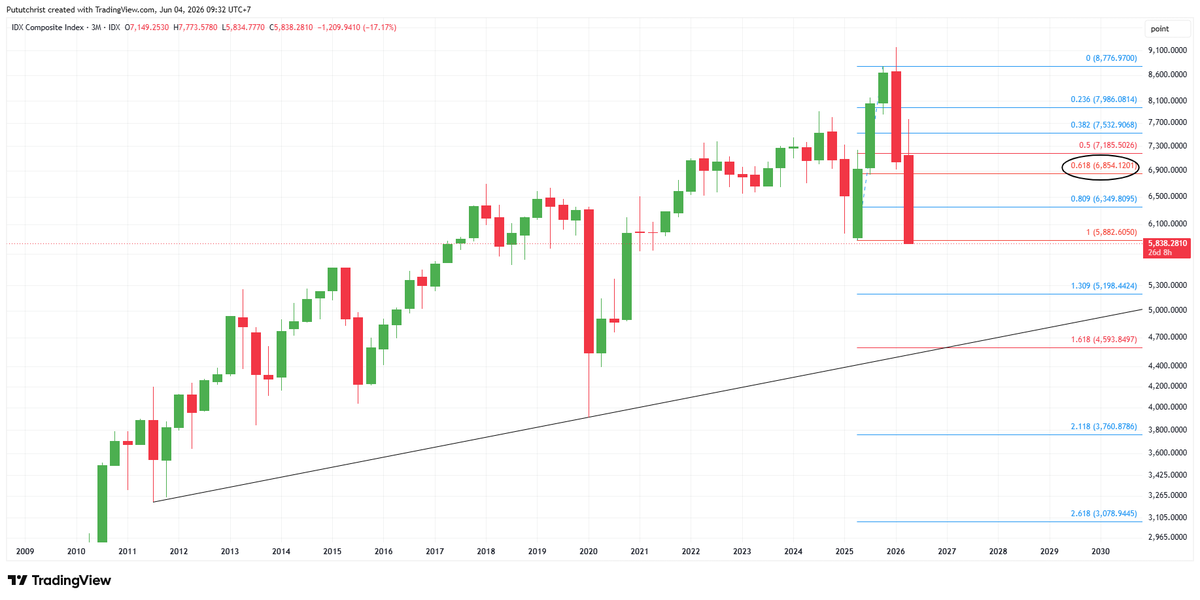
#IHSG target turun 5732 done, jika akhir Juni nanti IHSG gagal ditutup diatas 6854, maka probabilitas untuk turun lebih dalam semakin besar, dari chart 3 bulanan terlihat ada target turun di 4593-5198.
Target turun IHSG di 6218 lunas, masih ada potensi untuk turun lagi di 5732 namun masih nunggu konfirmasi candle mingguan, dari chart mingguan nanti terlihat akan lanjut turun atau berusaha switch trend ke bullish/uptrend
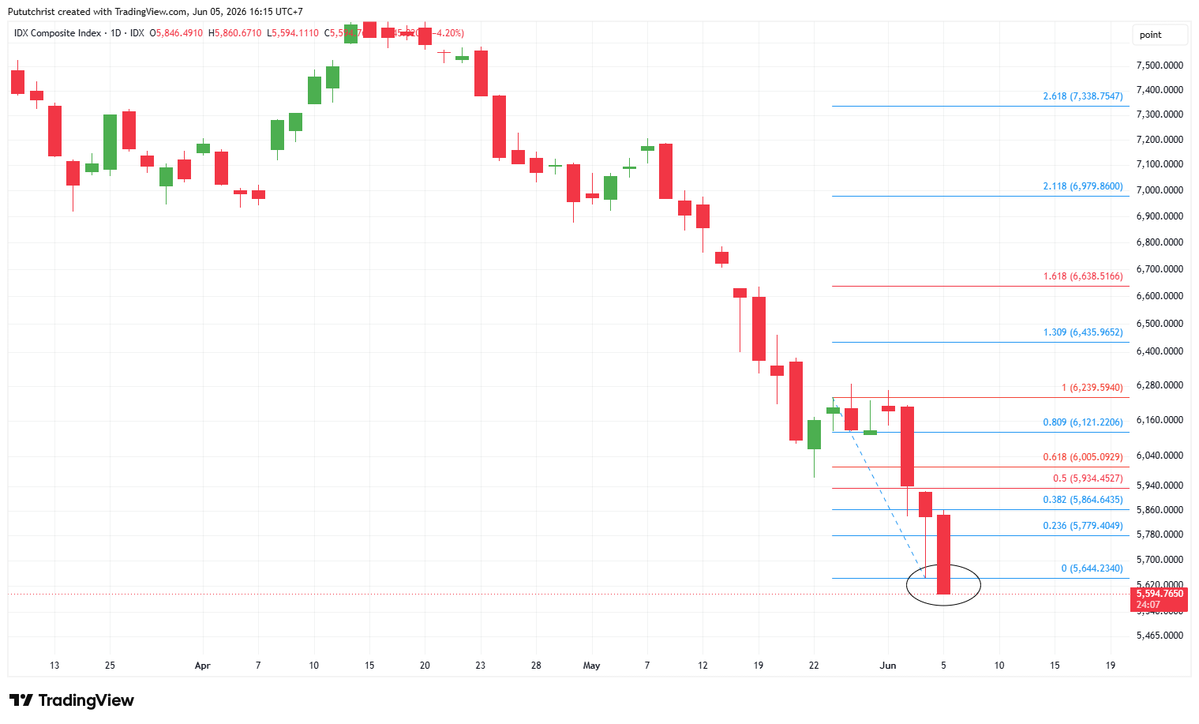
Closing candle daily IHSG cukup bagus, ada potensi untuk retrace naik dahulu, syaratnya candle daily berikutnya harus mampu menembus 6005, jika sanggup maka target naiknya adalah 6638, di area ini juga terdapat resisten weekly di 6564, serta last gap down 6705
@Nelly_yu Jika penutupan harga mingguan tidak mampu melampaui harga 6564 potensi untuk turun bisa sampai 4593-5198, tapi kalau mampu menembus 6564 maka bisa naik ke 7772-8382
Closing candle daily IHSG cukup bagus, ada potensi untuk retrace naik dahulu, syaratnya candle daily berikutnya harus mampu menembus 6005, jika sanggup maka target naiknya adalah 6638, di area ini juga terdapat resisten weekly di 6564, serta last gap down 6705
#IHSG target turun 5732 done, jika akhir Juni nanti IHSG gagal ditutup diatas 6854, maka probabilitas untuk turun lebih dalam semakin besar, dari chart 3 bulanan terlihat ada target turun di 4593-5198.
Roadmap USDIDR chart 3 bulanan sudah dekat target 1.618 di 18500, biasanya di area ini akan ada koreksi dulu. Untuk timeframe 12 bulanan trend-nya Rupiah masih akan melemah dengan target 22500
Krisis moneter 97-98 benar-benar game changer bagi kurs USD/IDR, memang dlm rentang waktu 28 tahun kurs melemah & menguat bergantian, tapi trend besarnya tetap melemah, jika menguat ke 14067, 11744, bahkan ke 10505 (mungkin nggak ya?) boleh simpan sedikit....
Target turun IHSG di 6218 lunas, masih ada potensi untuk turun lagi di 5732 namun masih nunggu konfirmasi candle mingguan, dari chart mingguan nanti terlihat akan lanjut turun atau berusaha switch trend ke bullish/uptrend
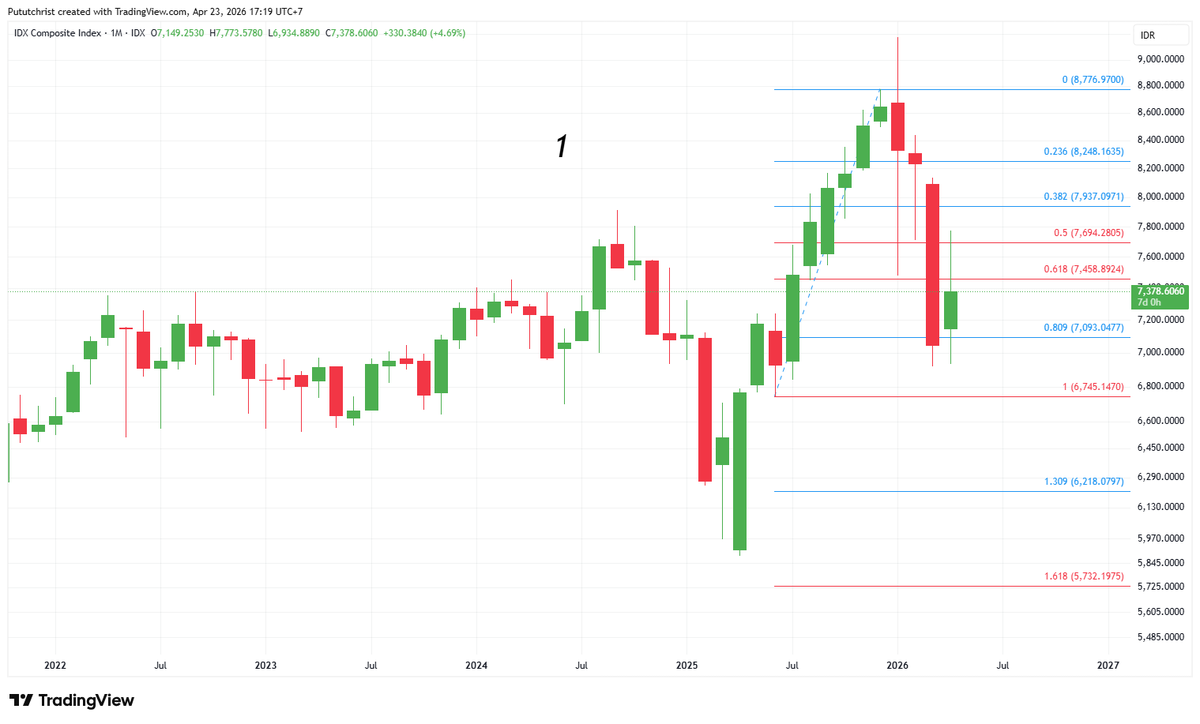
IHSG Monthly chart sudah ada konfirmasi lanjutan downtrend, target masih sama 5732-6218, Roadmap ini bisa gagal jika IHSG naik diatas 7694.
Noted :
- Konfirmasi awal : Body Candle harus break level 0.618
- Konfirmasi lanjutan : Body/ekor Candle sentuh level 1
The last time an El Niño this strong hit, it killed 50 million people. That was 3 to 4% of the entire world population. Scale that to today and you're looking at 250 million equivalent.
The 1877 Super El Niño triggered simultaneous droughts across India, China, Brazil, and East Africa. Crops failed on four continents at the same time. The famine lasted three years. Researchers have called it "arguably the worst environmental disaster to ever befall humanity."
NOAA's latest update gives a two-in-three chance this one reaches strong or very strong by fall. European models are even more aggressive. Sea surface temperatures need to exceed 2°C above normal to qualify as "super." The trajectory is pointing directly at that threshold.
Here's what makes 2026 structurally different from every previous Super El Niño: there are two independent supply shocks converging on the same crop cycle.
The Iran war has shut down roughly a third of the world's seaborne fertilizer trade through the Strait of Hormuz. US fertilizer supply was at 75% of normal in mid-March, right when the Corn Belt needed it most. Fertilizer prices hit their highest level since 2022. That input shortage is already baked into the 2026 growing season.
The El Niño yield shock operates on a 6 to 12 month lag. India is forecasting below-normal monsoons for the first time in three years. Indonesia and Malaysia carry 90% of global palm oil, and El Niño production declines in those countries take 6 to 24 months to peak. Every strong El Niño in the past 55 years has reduced global cocoa production.
So the fertilizer shortage weakens the crops El Niño is about to stress, and the El Niño yield collapse hits in 2027 on fields that were already under-fertilized in 2026. Two shocks with nearly identical lag structures, converging on the same harvest window.
The difference between 1877 and 2026: we can see this one coming six months out. The commodity futures curve is barely pricing either shock. Whether that's rational discounting or willful denial depends entirely on what the Pacific Ocean does between now and October.
IHSG Monthly chart sudah ada konfirmasi lanjutan downtrend, target masih sama 5732-6218, Roadmap ini bisa gagal jika IHSG naik diatas 7694.
Noted :
- Konfirmasi awal : Body Candle harus break level 0.618
- Konfirmasi lanjutan : Body/ekor Candle sentuh level 1
"IHSG analisanya turun tapi kok bisa tahu akan retrace naik dahulu?"
Multiple timeframe analisis jawabannya.
Jadi pada saat IHSG msh di 8300 di timeframe Monthly sdh saya plot Fibonacci-nya & ternyata di akhir Maret candle breakdown, ini konfirmasi awal downtrend (Gambar No 1)
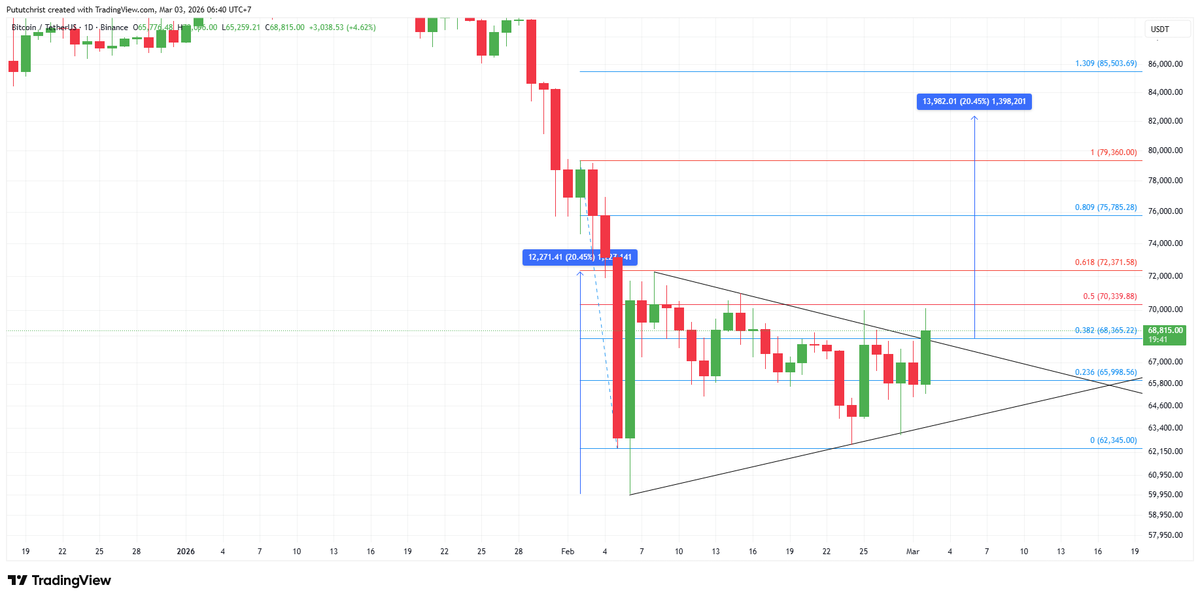
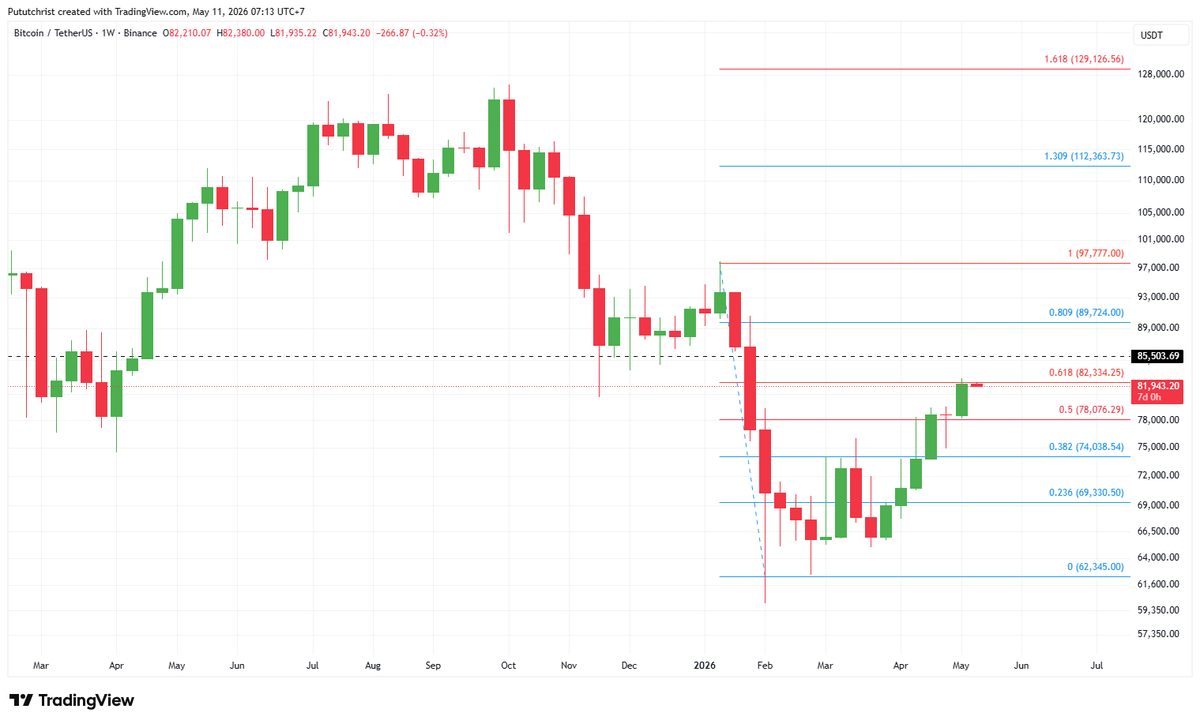
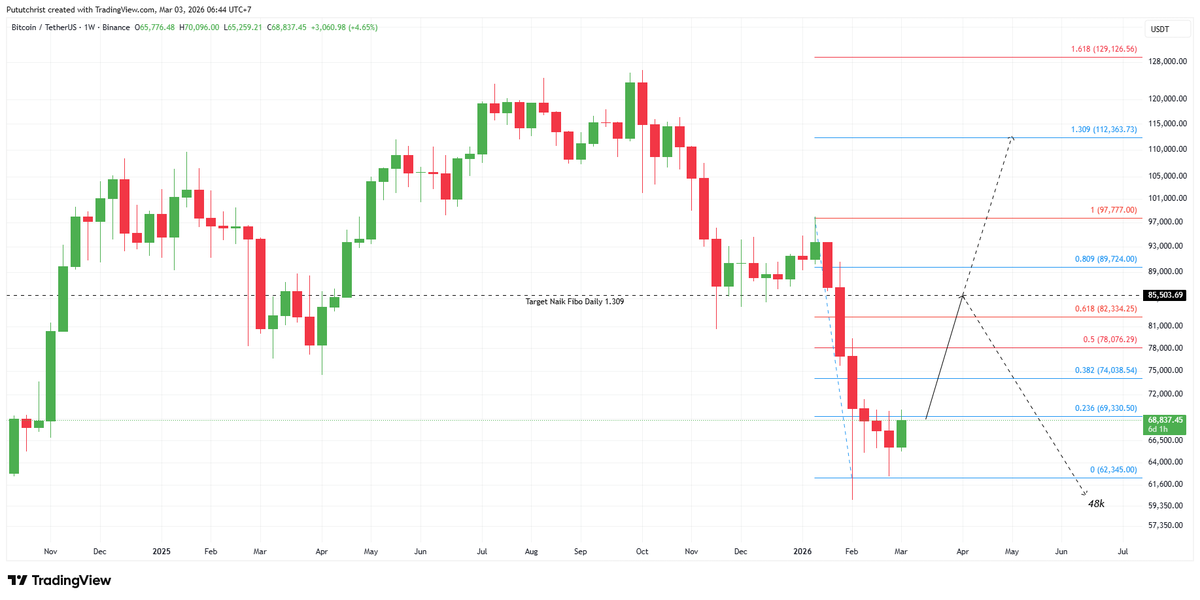
BTC daily chart breakout pola triangle-nya dengan potensi target naik 82-85k, tentunya wajib breakout 72.4k untuk konfirmasi tambahan, level 82-85k ini krusial karena bisa jadi level switching dari bear ke bull, diarea tsb ada resisten weekly-nya (Fibo 0.618 weekly)