BIG NEWS🚨Grafana Pyroscope 1.0 just dropped! 🔥
-✅ Petabyte-scale ingest 📊
-✅ Low Overhead 🙌
-✅ Easy Upgrade 🛠️
#continuousprofiling has never been better!
Check it out blog post and upgrade guide! 👉
https://t.co/o2G3ir0RVZ
Hey folks, on Thursday July 3rd at 8a PT/11 ET/5p CEST is the @PyroscopeIO community call. Bryan Huhta is going to talk about the #Pyroscope tools in the @Grafana MCP server and some of what’s new since the last call. Come join us!
https://t.co/bcucZIigeA
Today, Yandex has open-sourced Perforator, a continuous profiling tool that we use to analyze the performance of most services, including large ones:
https://t.co/ksBJlSzT9R
Shout-out @PyroscopeIO. This `ok_or`, that should have been an `ok_or_else`, was taking 30ms on virtually every request during JWT validation.
Shaving 30ms off every request, on the first day of continuous profiling, is pretty awesome.
New year, and Pyroscope is BACK with our community calls!
📅 Next Call: Jan 14th, 16:30 UTC+1
⏱ Duration: 60 min
🔗 Link: https://t.co/K0RFybtCkw
Agenda:
✨ 2024 Feature Highlights
🎛 Explore-Profiles: Seamless Grafana experience
📡 receive_http: Profiling via Grafana Alloy
Love a good #AMA? Next week, we've got an exciting one with @rperry_ talking about #Grafana Pyroscope: https://t.co/U49Bj0wD9g
What We’ll Cover
🧩 The Observability Puzzle: Go beyond logs and metrics to pinpoint root causes at the code level.
💰 Cost-Saving Stories: Learn how companies saved $1M+ by catching inefficient code in seconds.
👋 Hands-On Demo: Watch #Profiling in action and see how easy it is to start with Grafana Cloud.
Bring your questions!
New year, and Pyroscope is BACK with our community calls!
📅 Next Call: Jan 14th, 16:30 UTC+1
⏱ Duration: 60 min
🔗 Link: https://t.co/K0RFybtCkw
Agenda:
✨ 2024 Feature Highlights
🎛 Explore-Profiles: Seamless Grafana experience
📡 receive_http: Profiling via Grafana Alloy
We just added a new option to push profiling data to Grafana Alloy as an intermediary between your applications and the Pyroscope backend!
Great for centralizing your secrets 🤫🔒and other processing!
Check out the example below!
https://t.co/IYJxi6inNF
🚀 Introducing a new "explore profiles" UI inside Grafana! Now you can explore continuous profiling data a more intuitive, user-friendly interface. Dive into performance bottlenecks with ease using our queryless experience for faster insights!
https://t.co/NKkxNvLtvk
Flame graph analysis shouldn't be complicated. That's why we're introducing Flame graph AI in #Grafana Cloud!
Flame graph AI uses #LLMs to assist with flame graph data interpretation so you can identify bottlenecks, root causes & suggested fixes faster. https://t.co/yy6QEwIWpg
🚀 Check out this talk from Roblox 🎮 about building a powerful runtime diagnostic system with! 🌟With 70M daily users in a very latency-sensitive industry they were able to achieve huge CPU and throughput gains with #pyroscope. Profiling FTW🔥!
https://t.co/aZU9b0e0h4
Flamegraphs are extremely valuable for using profiling data to cut costs, debug latency, and resolve incidents, but you have to learn how to read them first!
Marie Cruz explains in a super simple way how to read a flamegraph below 📖🔥👇
https://t.co/7p4kNlybJX
Loser trees + profiling! Algorithms without performance profiles are like driving without a speedometer. Accelerate responsibly with Bryan Boreham’s insights on loser trees at GopherCon 2023! 🚗💨
🌳 Ever heard of a loser tree?
Grafana Labs distinguished engineer @bboreham explains exactly what they are — and how they can help optimize application performance — in his GopherCon 2023 talk. https://t.co/UfcEpoV5P6
Profiling is on a ROLL! 🎲 OpenTelemetry's latest milestone has made profiling the newest tool in your o11y toolkit✨
📖 blog: https://t.co/zqOreVPrgE
🎧 podcast: https://t.co/a277g9Kmvu
If your o11y could talk it'd be begging for you to start incorporating profiling ASAP!
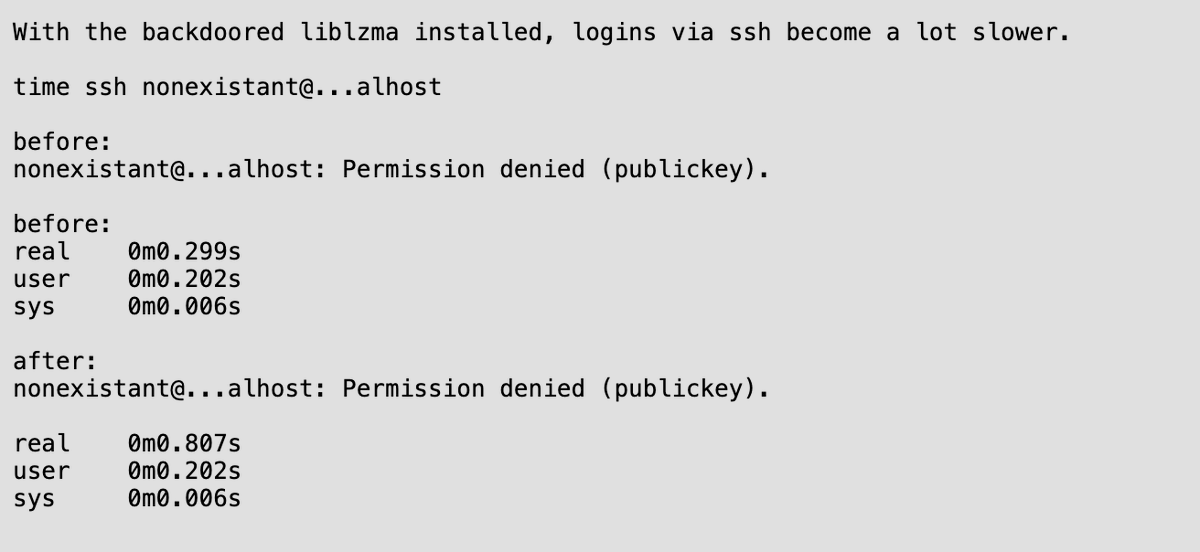
The xz backdoor was initially caught by a software engineer at Microsoft. He noticed 500ms lag and thought something was suspicious.
This is the Silver Back Gorilla of nerds. The internet final boss.