$SPY, /ES
New Trading Platform (being built).
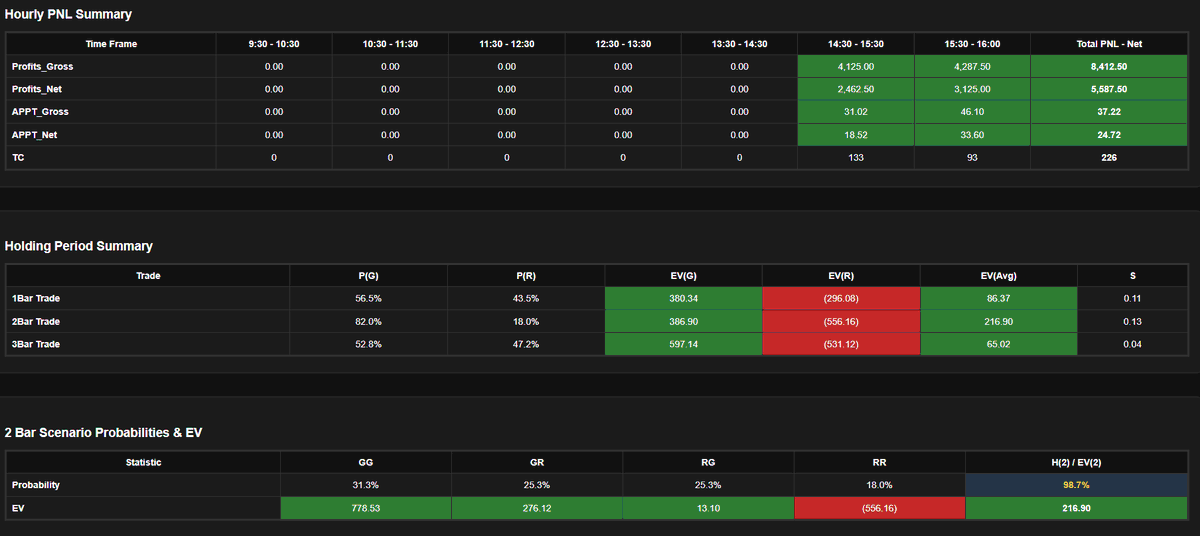
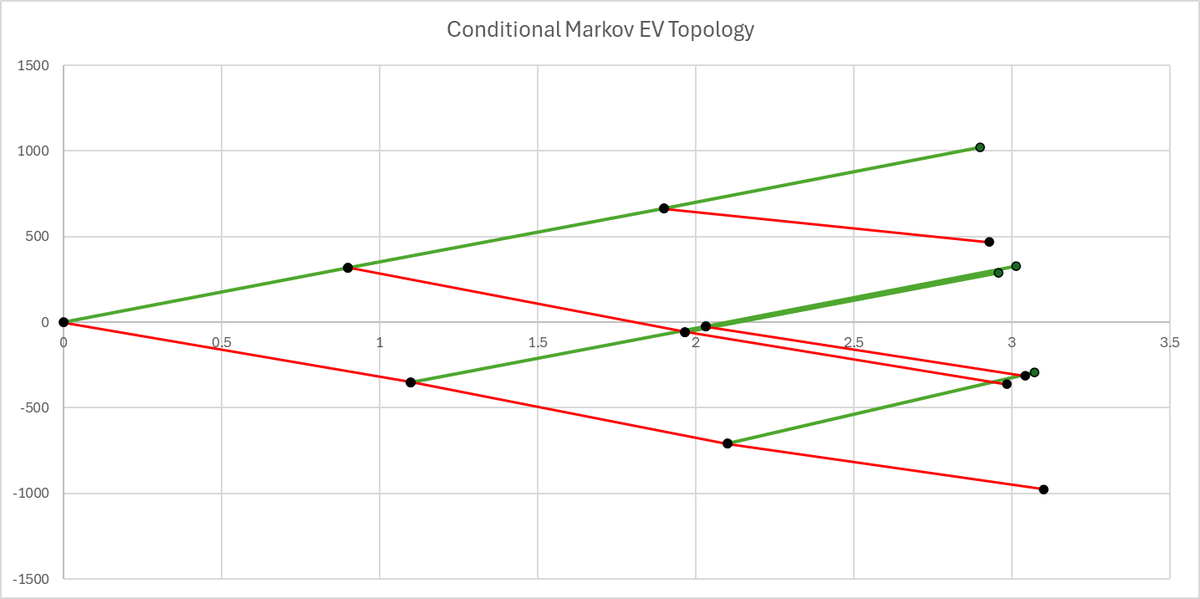
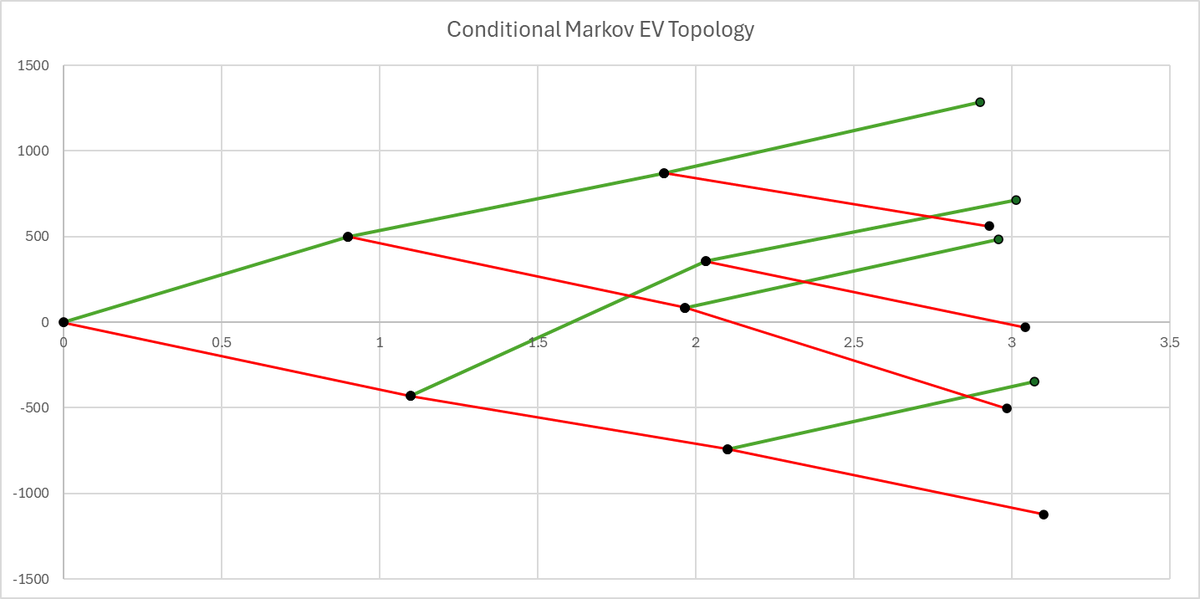
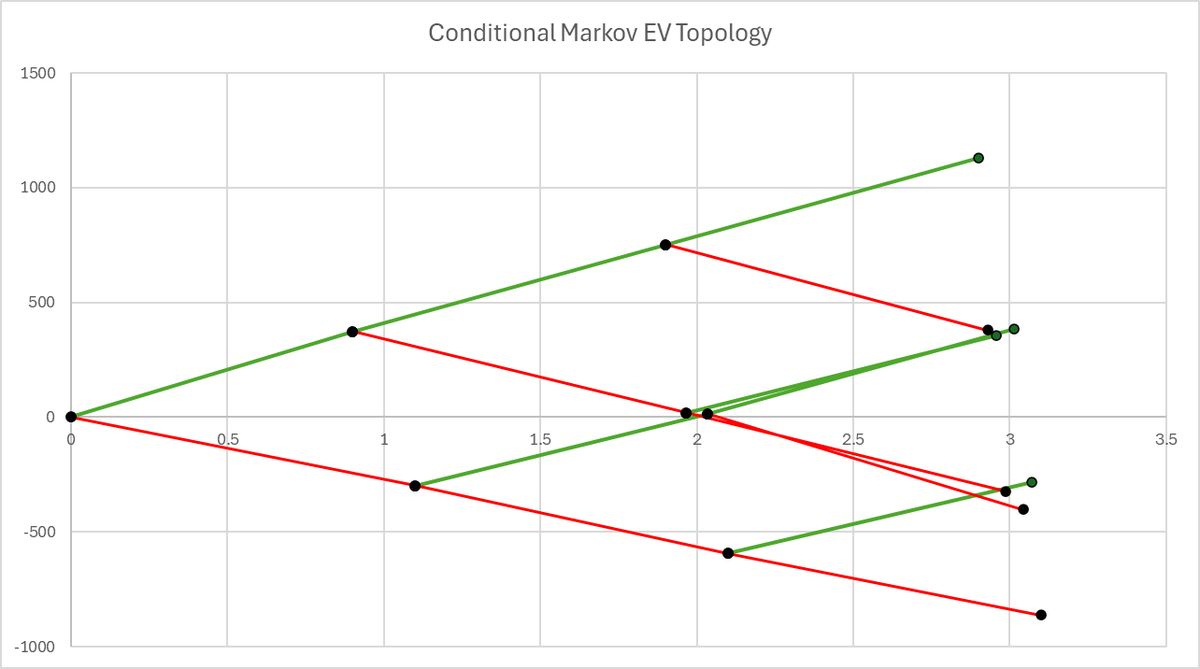
Breaks down Signal(x) by Hourly PNL, Holding Period Probabilities, Expected Value(EV) & Markov Path Probabilities & EV.
$SPY, /ES
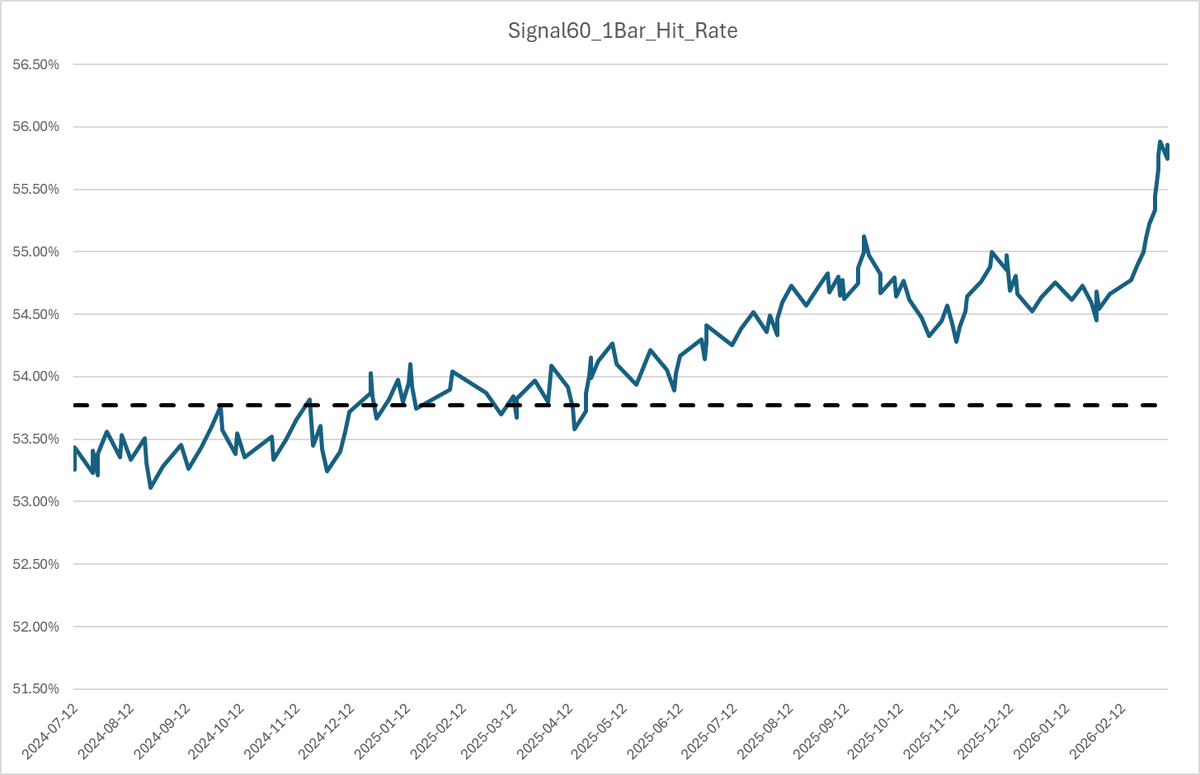
Deploying new short signal that has exploded in profitability, momentum short signal.
Conditional risk reward and Markov Transitional Stats support testing now with real dollars.
$SPY, /ES
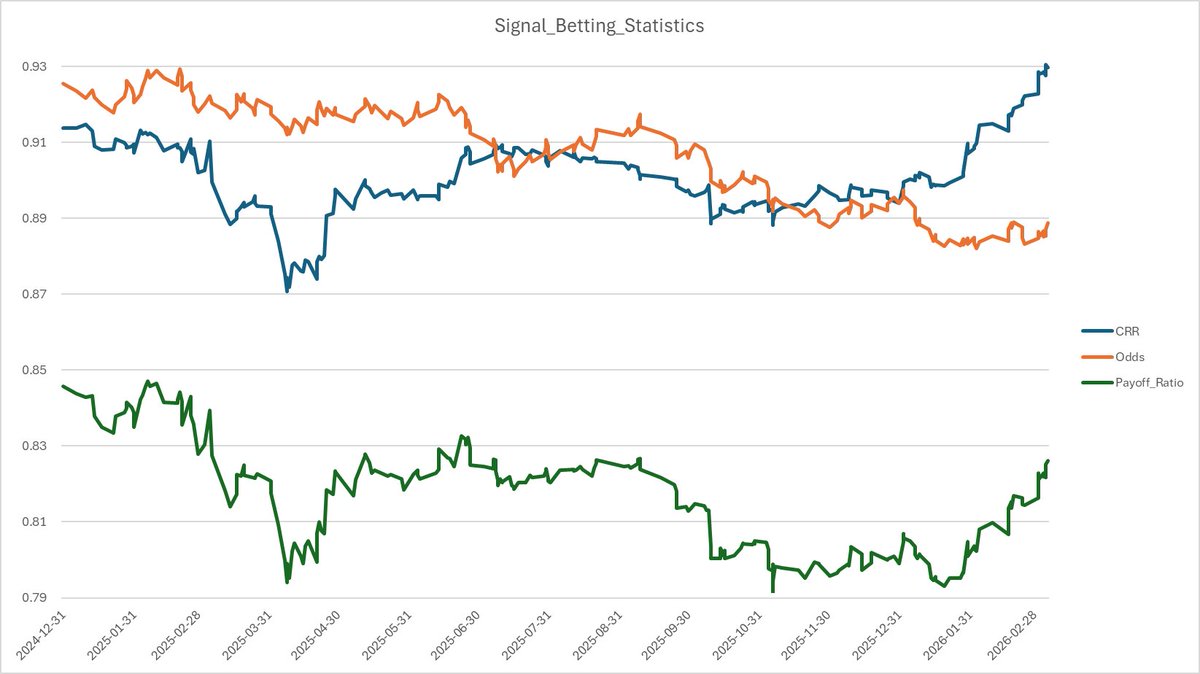
The Stats Underlying 75% or 3:1 Hit Rate Signals
I read a lot of research / posts around 3:1 odds trades.
The truth is that those trades exist. However, trading those signals requires a deep understanding of conditional risk reward underlying those trades and strict position sizing.
Through coding thousands of signals, the data is the same for all 3:1 odds trades, the offsetting data is 1:3 conditional risk reward data (average wins / average losses). Whenever I see folks claiming 75% hit rates, they always fail to mention tail risk in average losses. The average loss is always at least 3x your average wins and thus making money on 3:1 type odds means bet size has to be the same with every single trade.
Consistent sizing underlying all signals is often the key to the difference between profitable and unprofitable traders. I have frequently turned profitable algorithms unprofitable by sizing tail risk exposure.
$SPY, /ES
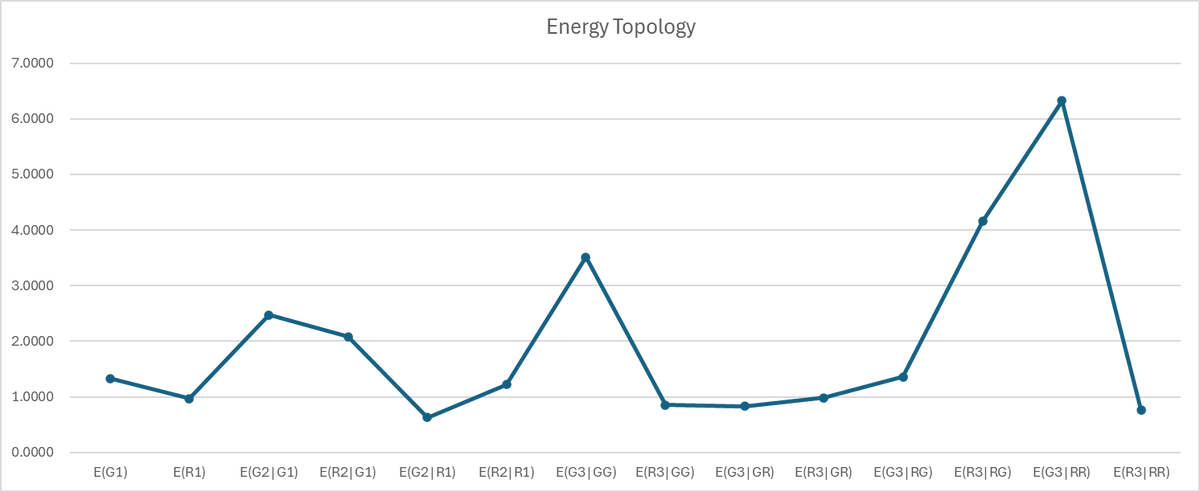
A trading platform tool that breaks-down a trade by CMFE, Markov Path Probabilities, Condition Risk Reward, Odds, Payoff_Ratio, Hit-Rate, Equity Curve & Energy Topology.
$SPY, /ES
This is one of those rare Quant Signals that needs no summary... Just two charts tell the entire story of how much institutional structure this signal holds.
$SPY, /ES
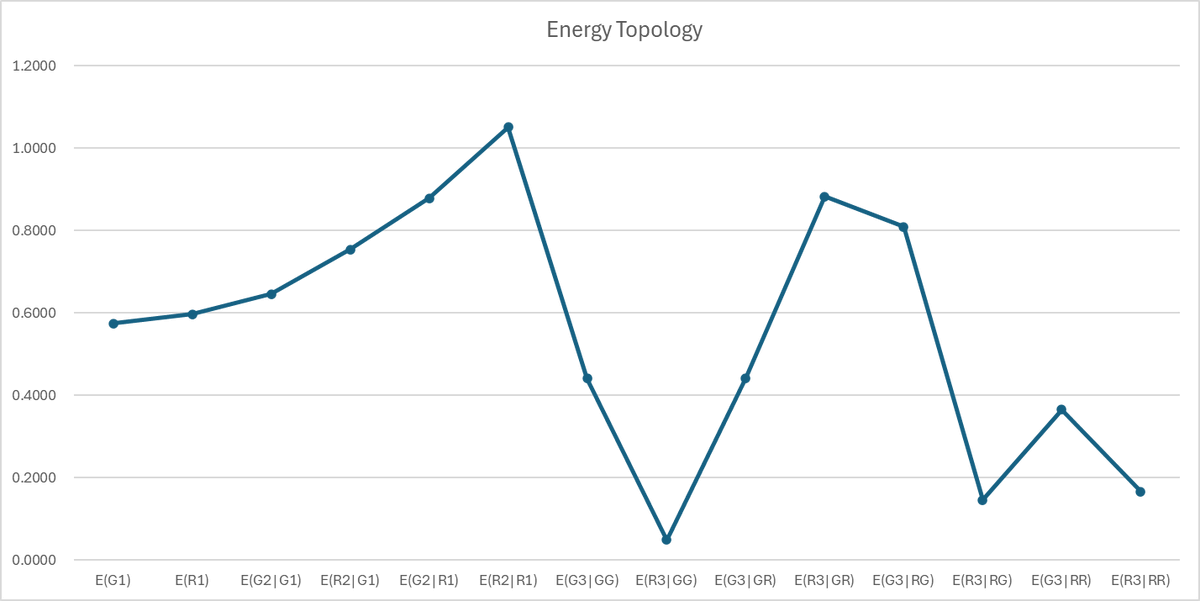
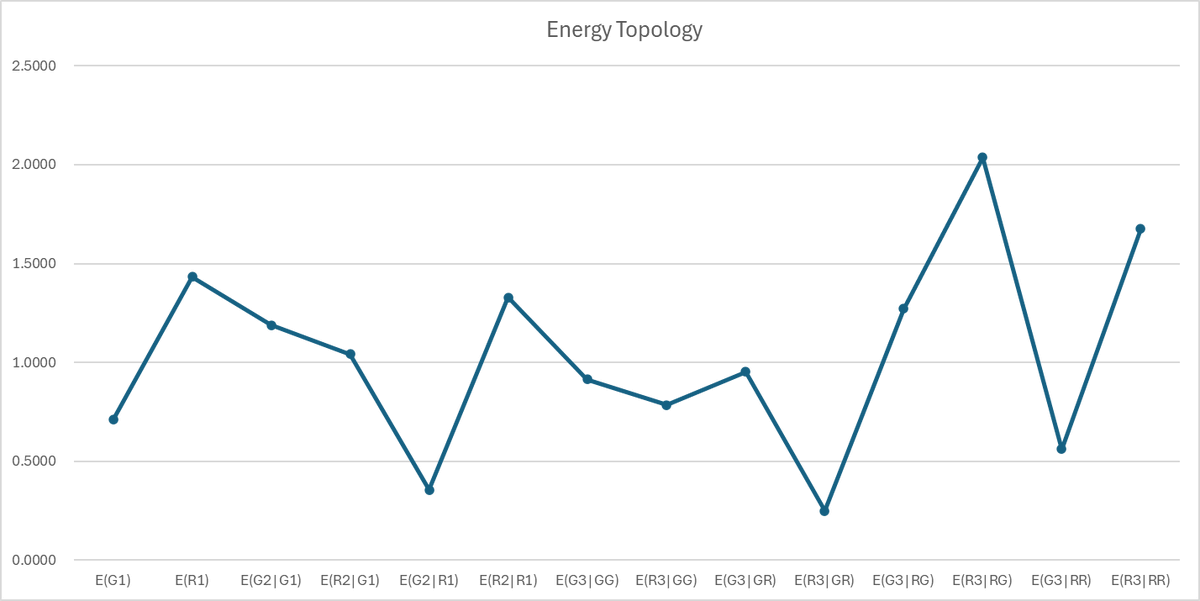
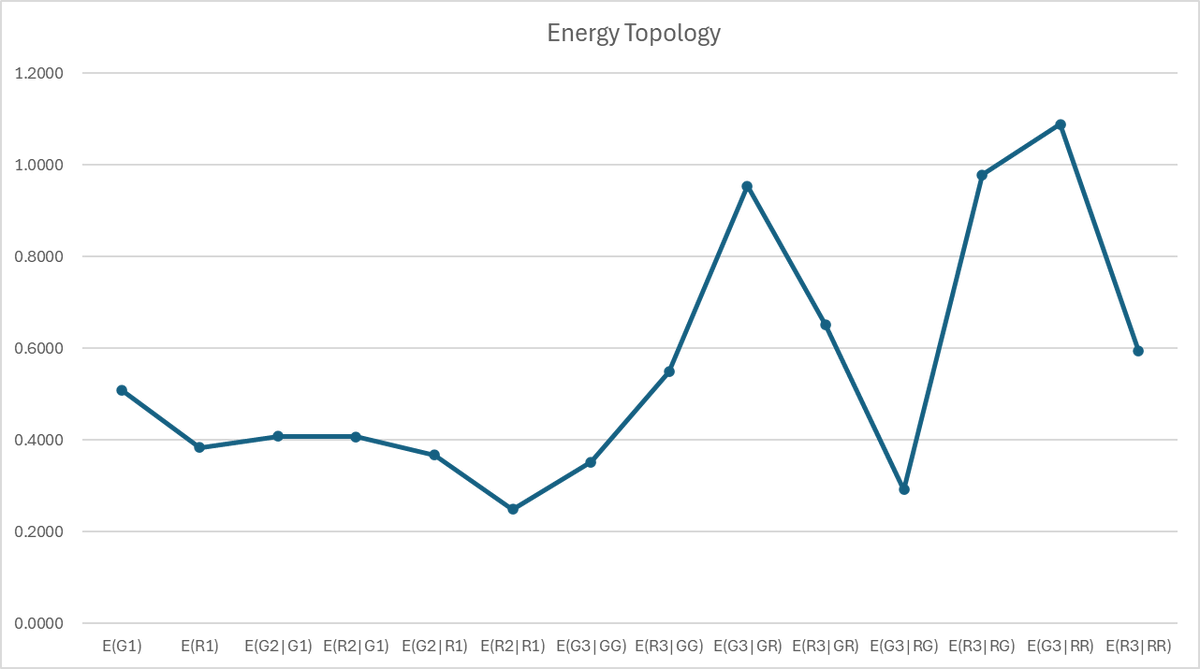
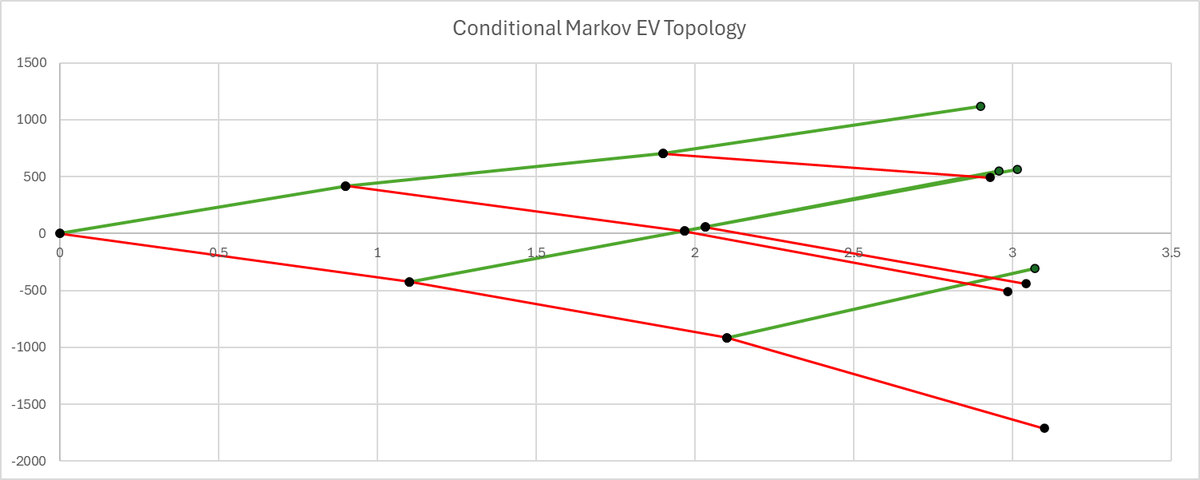
Energy Topology + Conditional Markov EV Topology Charts
Two tools to deconstruct trade set-up regimens.
Adding conditional marginal free edge scores to conditional states highlights asymmetric payoff opportunities.
$SPY, /ES
When Quantitative Research Leads to Immediate Capital Deployment... The Energy Topology says it all!
Signal 47 operates in a structurally coherent, downside-activated trend regime characterized by meaningful entry-level drift, elevated signal quality, and non-trivial informational separation at activation. Unlike timing filters or regime triggers, the signal exhibits genuine unconditional edge alongside latent state structure, as reflected in positive KL divergence and high discriminability. Variance scaling is near-IID with mild stabilization, providing a favorable diffusion environment for sustained directional exposure.
Conditional dynamics are dominated by a powerful post-R1 activation channel. Initial downside realization induces a transition into a high-coherence, low-noise corridor with exceptionally positive CMFE, elevated energy, and convex EV expansion. The R1→G2/R2 manifold functions as a stable attractor for trend persistence, while the complementary recovery branch collapses into a weakly dissipative region. Post-G1 continuation remains positive but secondary, confirming that primary alpha is generated through downside-triggered regime entry rather than symmetric momentum.
EV path decomposition reveals pronounced conditional convexity, with expected value after R1 materially exceeding unconditional and post-G1 EV, establishing the signal as a true downside-activated momentum engine. Information geometry confirms that this structure reflects genuine latent state formation rather than variance artifacts or mechanical skew.
Alpha generation arises from systematic detection of forced-flow and liquidation-driven regime transitions that precede sustained directional movement. The signal functions as an institutional-grade trend ignition system embedded in high-frequency data. Optimal deployment requires tolerance for early adverse movement, aggressive state-contingent escalation following R1, and sustained holding through activated regimes. Premature monetization or symmetric management destroys the convex payoff geometry.
$SPY, /ES
Someone asked me what I do for a living and I finally was able to eloquently describe my daily pursuit of returns as the following:
I model intraday log returns as a state-dependent stochastic process with conditional drift, diffusion, and entropy structure estimated from Markov path frequencies.
I don't look at patterns, I am estimating the transition kernel of a stochastic process where edge lives in conditional imbalances and finding non-IDD in the process.
Finally, a description everyone can understand!
$SPY, /ES
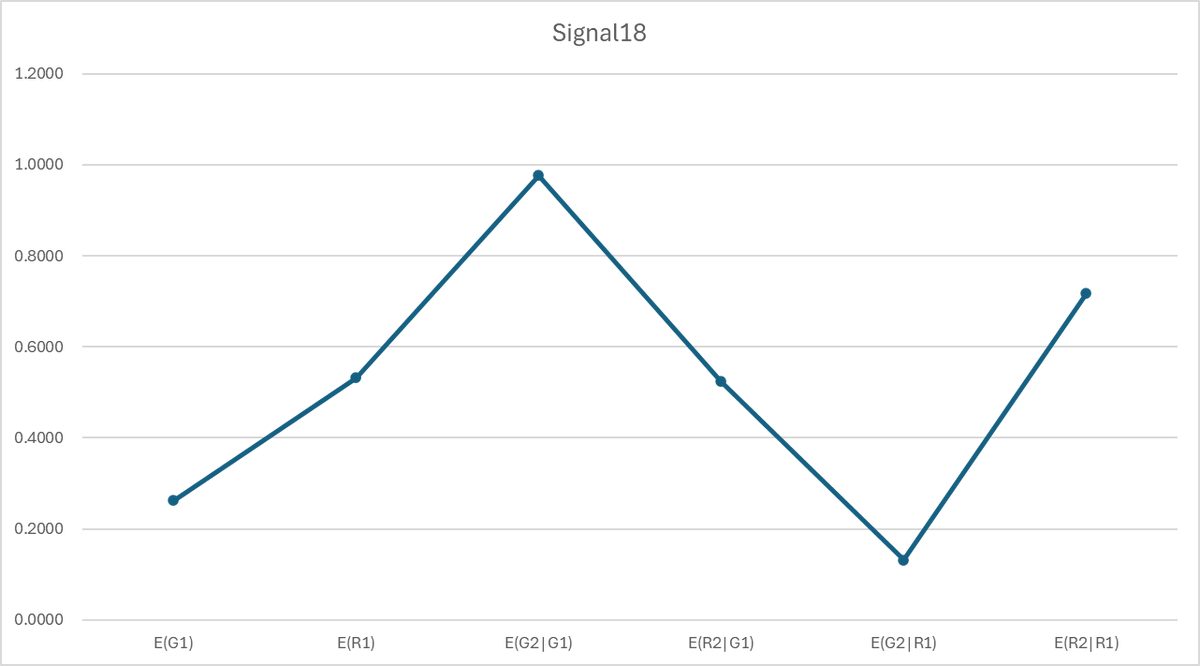
Signal 18 Energy Topology
Signal Conclusion - Short Signal
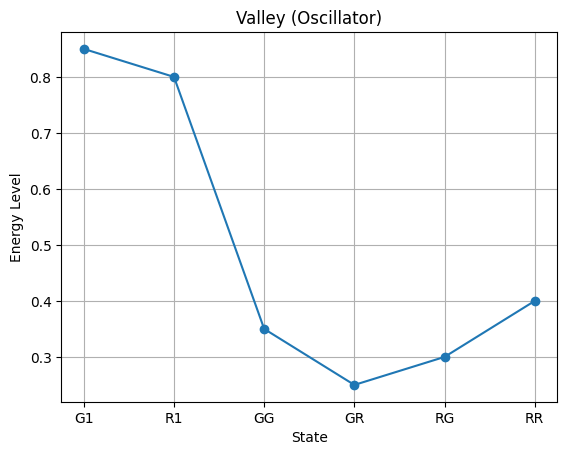
This signal operates in a near–maximum entropy regime, indicating weak symbolic predictability but persistent hidden structure in conditional amplitudes. Variance scaling is strongly sub-IID (K₂ < 1), implying active stabilization and inventory control consistent with institutional execution. Energy topology exhibits a damped oscillatory profile with a GG peak and RG trough, characteristic of a controlled diffusion process with negative feedback. CMFE is negative on both gates, with stronger adverse drift following strength, consistent with systematic distribution and sell-side dominance. The EV tree is highly dispersive but exhibits rapid decay beyond the first bar, confirming that edge is front-loaded and deteriorates under extension. Optimal policy is short-biased, emphasizing early extraction and selective scaling, while avoiding horizon expansion due to structural mean reversion and compensated continuation.
$SPY, /ES
Trading without looking at charts has helped me stay firmly at the intersection of Stochastic Processes, Information Theory, Statistical Decision Theory, Statistical Physics and Optimal Control and has helped stay in a mechanical process free of emotion.
Institutional flow, rebalancing, algorithms, momentum, mean reversion can be boiled down to math. Rules based trading through a decision tree framework has been a real game changer for my process.
$SPY, /ES
When trading shifted from looking at "patterns" to energy topology and conditional states I was able to separate emotions from PNL.
Energy Topology / Physics Example...
$SPY, /ES
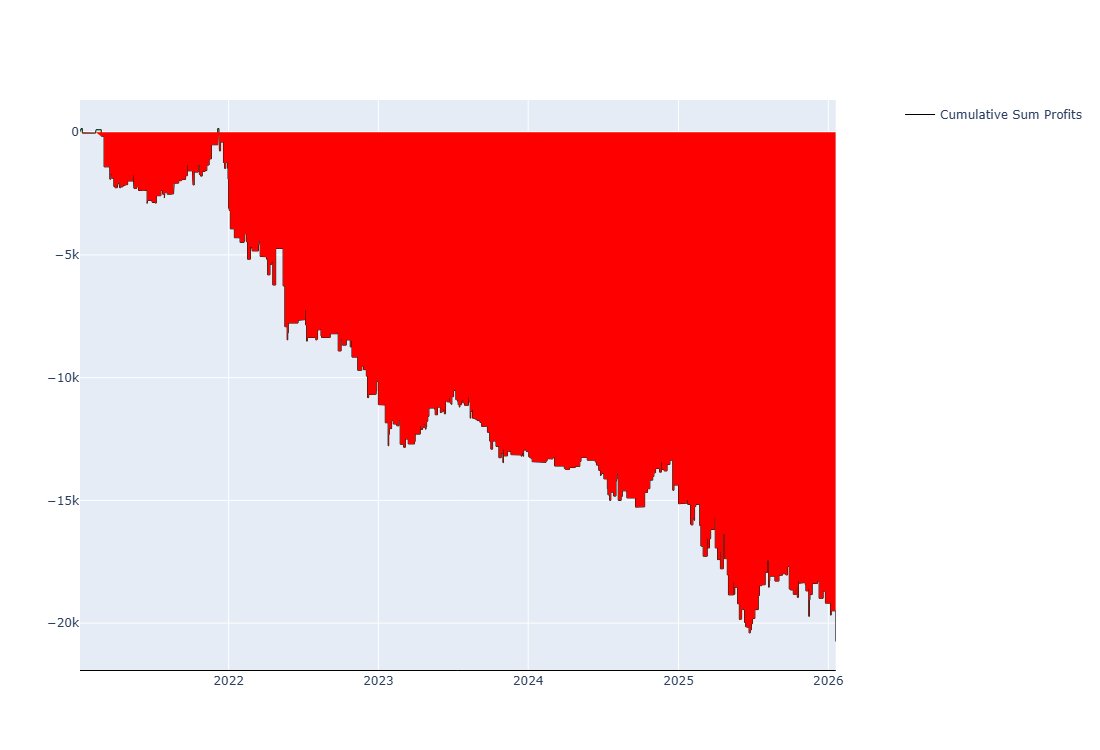
Equity Curve of Short Signal
Signal Summary
This signal operates in a latent distribution regime characterized by high discriminability under near maximum entropy. Negative drift scales efficiently under moderate variance expansion, while conditional dynamics exhibit strong asymmetry. Elevated conditional energy and sharply negative CMFE following bar 1 downside movement indicates liquidation cascade. Conversely, upside path movement exhibits positive CMFE and EV repair. This signal supports confirmation-based short pyramiding.
$SPY, /ES
You often hear traders talk about chop... "I got chopped up today..." In order words... pattern trading (sequence memorization) doesn't recognize conditional variance per state.
Trading in a near maximum Entropy state with Asymmetric Volatility Skew = "Chop"
Anyone saying they got chopped up trading is trading in a state with no Edge but adverse randomness that is likely hostile (high sigma).
No different than throwing darts in the dark on a boat in the middle of a storm and you are placing bets that you are going to hit the target!
$SPY, /ES Futures
Pattern Trading vs. Distribution Trading
Pattern trading is sequence memorization, not modeling. Pattern trading doesn't recognize that the same pattern can live inside radically different volatility regimes.
Distribution trading operates in state space. Edge lives in distribution imbalance through frequency and or conditional path asymmetric payoffs.
$SPY, /ES
A quiet reminder that when you find Edge in a trade that is quantifiable, you don't need cleverness to survive, you need discipline to not mess it up.
$SPY, /ES
I was chatting with an individual the other day and he said, "trading has a far degree of art in it..."
I obviously disagreed, but It wasn't until I understood the following statement did I feel trading was (in statistic terms) statistically significantly more science than art.
When your quant research identifies mean scaling and/or variance scaling, it is simple... your trading physics, not patterns.
$SPY, /ES
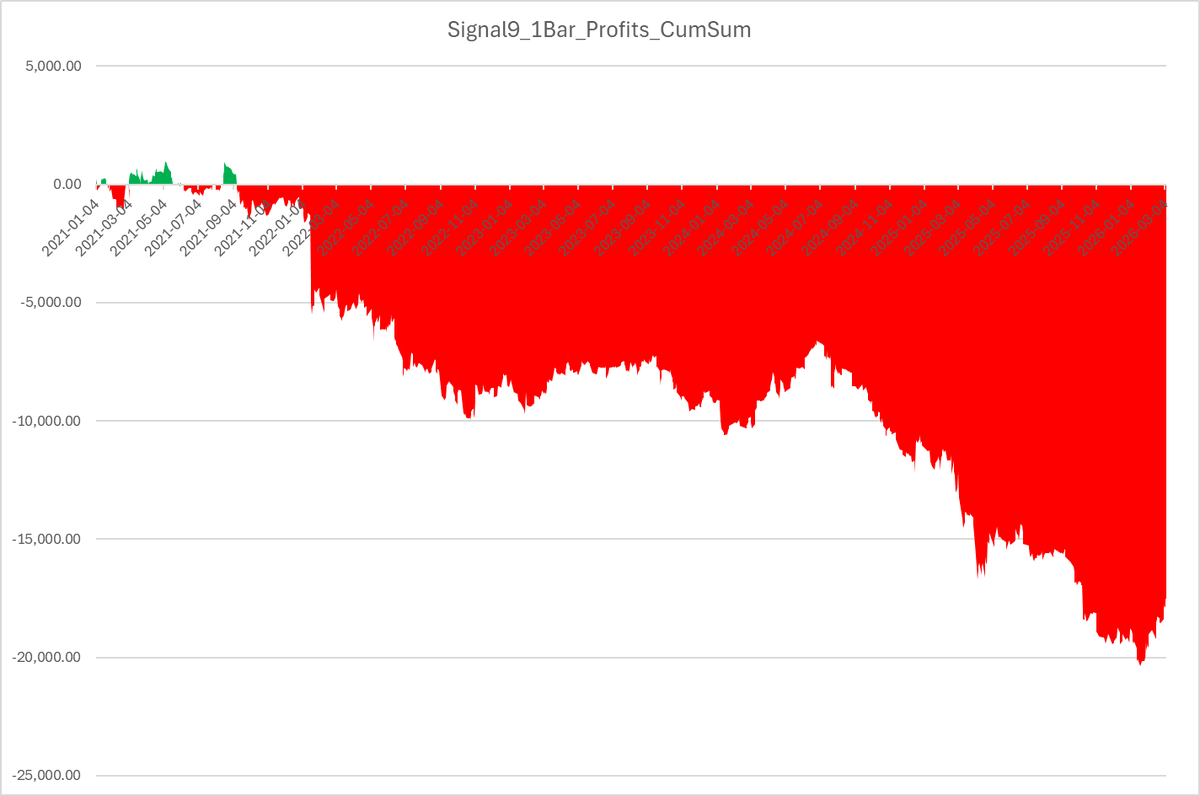
Below is what looks like a pretty good equity curve for a short signal, however, this short signal rarely produces positive profits when applied in real trading.
What is one metric quant signal trades look at more than Sharpe or Equity Curves?
K(n) or Variance Scaling vs. iid Noise.
The text-book definition is iid is the "null hypothesis" of markets (no memory, no structure). K(n) tells us whether our signal violates that null.
*I consistently lost money trading this signal until I calculated K(n).
Next post... why K(n) can disprove equity curves and improve your trade quality set-up by not falling for the trap of nice equity curves.