🎯 📊 DATA ANALYST MOCK INTERVIEW (WITH ANSWERS)
🧠 1️⃣ Tell me about yourself
✅ Sample Answer:
“I have around 3 years of experience working with data. My core skills include SQL, Excel, and Power BI. I regularly work with data cleaning, transformation, and building dashboards to generate business insights. Recently, I’ve also been strengthening my Python skills for data analysis. I enjoy solving business problems using data and presenting insights in a simple and actionable way.”
📊 2️⃣ What is the difference between WHERE and HAVING?
✅ Answer:
WHERE filters rows before aggregation
HAVING filters after aggregation
Example:
SELECT department, COUNT(*)
FROM employees
GROUP BY department
HAVING COUNT(*) > 5;
🔗 3️⃣ Explain different types of JOINs
✅ Answer:
INNER JOIN → only matching records
LEFT JOIN → all left + matching right
RIGHT JOIN → all right + matching left
FULL JOIN → all records from both
👉 In analytics, LEFT JOIN is most used.
🧠 4️⃣ How do you find duplicate records in SQL?
✅ Answer:
SELECT column, COUNT(*)
FROM table
GROUP BY column
HAVING COUNT(*) > 1;
👉 Used for data cleaning.
📈 5️⃣ What are window functions?
✅ Answer:
“Window functions perform calculations across rows without reducing the number of rows. They are used for ranking, running totals, and comparisons.”
Example:
SELECT salary, RANK() OVER(ORDER BY salary DESC)
FROM employees;
📊 6️⃣ How do you handle missing data?
✅ Answer:
Remove rows (if small impact)
Replace with mean/median
Use default values
Use interpolation (advanced)
👉 Depends on business context.
📉 7️⃣ What is the difference between COUNT(_) and COUNT(column)?
✅ Answer:
COUNT(*) → counts all rows
COUNT(column) → ignores NULL values
📊 8️⃣ What is a KPI? Give example
✅ Answer:
“KPI (Key Performance Indicator) is a measurable value used to track performance.”
Examples: Revenue growth, Conversion rate, Customer retention
🧠 9️⃣ How would you find the 2nd highest salary?
✅ Answer:
SELECT MAX(salary)
FROM employees
WHERE salary < ( SELECT MAX(salary) FROM employees );
📊 🔟 Explain your dashboard project
✅ Strong Answer:
“I created a sales dashboard in Power BI where I analyzed revenue trends, top-performing products, and regional performance. I used DAX for calculations and added filters for better interactivity. This helped stakeholders identify key areas for growth.”
🔥 1️⃣1️⃣ What is normalization?
✅ Answer:
“Normalization is the process of organizing data to reduce redundancy and improve data integrity.”
📊 1️⃣2️⃣ Difference between INNER JOIN and LEFT JOIN?
✅ Answer:
INNER JOIN → only matching data
LEFT JOIN → keeps all left table data
👉 LEFT JOIN is preferred in analytics.
🧠 1️⃣3️⃣ What is a CTE?
✅ Answer:
“A CTE (Common Table Expression) is a temporary result set defined using WITH clause to improve readability.”
📈 1️⃣4️⃣ How do you explain insights to non-technical people?
✅ Answer:
“I focus on storytelling. Instead of technical terms, I explain insights in simple business language with visuals and examples.”
📊 1️⃣5️⃣ What tools have you used?
✅ Answer:
SQL, Excel, Power BI, Python (basic/advanced depending on you)
💼 1️⃣6️⃣ Behavioral Question: Tell me about a challenge
✅ Answer:
“While working on a dataset, I found inconsistencies in data. I cleaned and standardized it using SQL and Excel, ensuring accurate analysis. This improved the dashboard reliability.”
Double Tap ♥️ For More
Once you find a company that fits, do not apply immediately
Open Claude and paste this prompt👇
“Go to [company website] and tell me what they do, who their target user is, what problems they are solving, and where someone with my background could add the most value.”
Paste your experience at the end
Claude will give you everything you need in seconds.
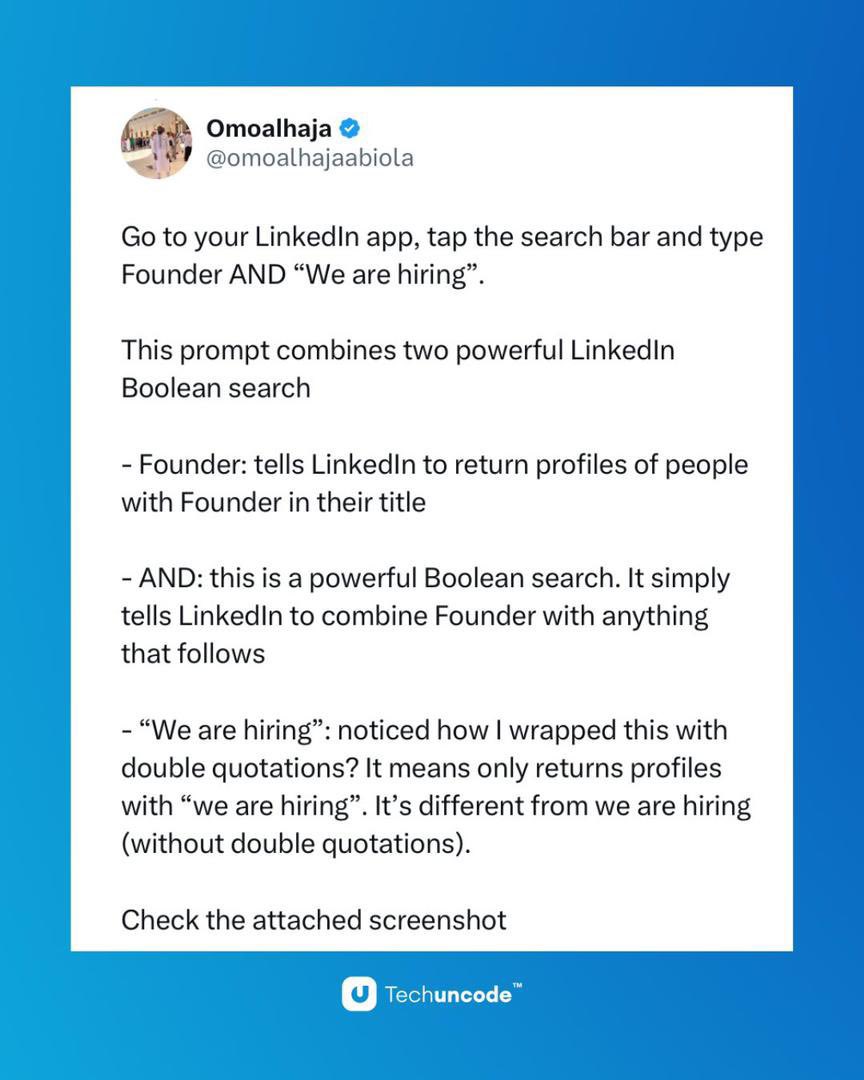
To ensure that you connect with people who are hiring data analysts on LinkedIn.
Do this 👇👇👇
1. Log in to LinkedIn: Open LinkedIn and log into your account.
2. Enter the Search Query:
- Click on the search bar at the top of LinkedIn.
- Type in the following Boolean search query: "We are hiring" AND "data analytics"
3. Filter by People:
- After the results load, look at the filter options directly below the search bar.
- Click on People to ensure you’re only viewing LinkedIn profiles, rather than posts, companies, or jobs.
4. Apply Optional Filters (Recommended for Targeted Search):
- Click on All Filters on the right side of the filter options.
- Under Location, select specific locations like United States, United Kingdom, or Canada to target users in those regions.
- You can also explore other filters, such as Industry (e.g., Information Technology, Financial Services) to focus on relevant fields, or Current Company if you want to connect with individuals from specific organizations.
5. Review Profiles:
- Scroll through the list of profiles to identify those who are actively hiring for data analytics roles.
- Open profiles that interest you to review their details, such as their job title, company, and recent activity (look for hiring posts).
6. Connect with a Personalized Message:
- Click Connect on a selected profile.
- Add a note to personalize your connection request. Here’s an example message:
Hi [First Name],
I noticed you’re hiring in data analytics, and I’m very interested in connecting and learning more about potential opportunities. Thanks, and looking forward to connecting!
7. Track and Follow Up:
- After connecting, keep a list of the hiring managers or recruiters you’ve connected with.
- Consider following up with a brief, polite message if they accept your connection request.
The single best investment I’ve made in my communication skills is Dan Shapero’s 30-minute ‘Communicating with Executives’ course on LinkedIn Learning. Best ROI of time and money I’ve ever experienced. His practical advice on context switching has been invaluable when navigating diverse stakeholders and complex multilateral conversations
The accounts that made my data thinking sharper are not the ones with the most followers.
Here are the data analysts and practitioners worth following on X in 2026, and specifically why each one.
⟶ @Alex_TheAnalyst (~78K)
Best for: SQL career content, portfolio advice, beginner-to-expert pathways.
Why: His resource posts are genuinely useful. Not generic. He shows his actual work.
Best post type to watch: his “how I would approach this problem” format.
⟶ @jessica_xls (~70K)
Best for: Data career reality, Nigerian diaspora perspective, honest job market takes.
Why: She names the things most career accounts avoid. Good signal-to-noise ratio.
Best post type: her personal story posts anchored to specific outcomes.
⟶ @__mharrison__ (~164K)
Best for: Python opinion, technical takes with commercial framing.
Why: He disagrees with things. That is rare and useful in a field full of consensus content.
Best post type: his short, blunt takes on Python tools and AI realities.
⟶ @bernardmarr (~139K)
Best for: AI and data strategy framed for business leaders.
Why: If you want to understand how executives think about data. read how he explains it to them.
Best post type: his “what this actually means for your organisation” format.
⟶ @KirkDBorne (~189K)
Best for: Trend spotting, data science frontier, cross-domain thinking.
Why: NASA background, genuine breadth. Good for seeing where the field is moving before it arrives.
Best post type: his systems thinking posts.
⟶ @SeattleDataGuy
Best for: Data engineering career reality. No hype.
Why: He talks about the actual experience of building pipelines. not the tutorial version.
Best post type: his “things nobody tells you about data engineering” format.
⟶ @BecomingDataSci
Best for: Non-traditional paths into data. Real transitions.
Why: If you are moving into data from a different background. this account understands that journey.
Follow these for signal, not noise. Turn off notifications for everyone except the two or three whose thinking consistently challenges yours.
@baddengineer I first stayed the Quickmart area
Then nikasonga huko juu past joylamd but close to the road
+254 719 597113 maybe talk to him
He does proper hunts and is reliable
INSTEAD OF WATCHING NETFLIX TONIGHT.
Spend 1 hour with this.
Claude AI FULL COURSE that teaches you how to BUILD and AUTOMATE anything.
The people who watch this tonight will wake up tomorrow with a new skill.
Watch it and Bookmark it now.
Instead of telling Claude, "write code." To build your portfolio website,
Here is a good prompt you can give to it to help you create one:
Portfolio prompt
Create a modern, responsive personal portfolio website for a data analyst/data scientist.
## INPUT DATA
I will provide:
1. My CV (extract name, bio, skills, experience, education, tools, and achievements from it)
2. Three Medium article links: ( depending on where you have your projects, list them and inserts the links)
## GOAL
Build a clean, professional portfolio website that highlights my analytical skills, storytelling ability, and real-world project impact. The website should be optimized for recruiters, hiring managers, and collaborators.
## DESIGN STYLE
- Minimalist, modern, and elegant
- Use a tech/data aesthetic (subtle grids, charts, or abstract data visuals)
- Color palette: dark mode or soft neutral tones with one accent color
- Typography: clean sans-serif (professional and readable)
- Smooth scrolling and subtle animations (fade-ins, hover effects)
## WEBSITE STRUCTURE
### 1. HERO SECTION
- My name
- Title (e.g., Data Analyst | Data Scientist | Business Intelligence Analyst)
- Short 1–2 sentence value proposition (derived from CV)
- CTA buttons:
- "View Projects"
- "Download CV"
### 2. ABOUT SECTION
- Short professional summary (from CV)
- Key strengths (data storytelling, analytics, visualization, etc.)
- Tools & technologies (icons preferred: Python, SQL, Power BI, Excel, etc.)
### 3. PROJECTS SECTION (MAIN FOCUS)
Create 3 project cards, each with:
- Project title
- Short summary (problem → approach → insight)
- Key tools used
- 1–2 key insights or outcomes
- Button: "Read Full Case Study" (links to Medium article)
Projects:
(List your projects)
Each project should look like a case study preview, not just a link.
### 4. EXPERIENCE / SKILLS SECTION
- Extract from CV
- Highlight measurable impact where possible
- Include both technical and analytical skills
### 5. CV SECTION
- Provide a downloadable CV button
- Optionally show a short preview
### 6. CONTACT SECTION
- Email
- LinkedIn
- Medium profile
- Optional: GitHub
## FUNCTIONAL REQUIREMENTS
- Fully responsive (mobile, tablet, desktop)
- Fast loading
- Clean navigation (sticky navbar)
- Accessible (good contrast, readable text)
## OUTPUT FORMAT
- Generate complete HTML, CSS, and optional JavaScript
- Code should be clean, well-structured, and ready to deploy
- Use semantic HTML
- Include comments for easy customization
## OPTIONAL ENHANCEMENTS
- Add a “Featured Insight” highlight from one project
- Add subtle data visual elements (charts/graphs style design)
- Add hover animations on project cards
## IMPORTANT
- Do NOT use placeholder lorem ipsum
- Use actual content extracted from my CV
- Make the tone professional, confident, and results-oriented
- Prioritize clarity and storytelling over decoration
INSTEAD OF WATCHING NETFLIX TONIGHT.
Spend 1 hour with this.
Claude AI FULL COURSE that teaches you how to BUILD and AUTOMATE anything.
The people who watch this tonight will wake up tomorrow with a new skill.
Watch it and Bookmark it now.
When you’re asked, “Tell me about yourself” during a job interview.
Here’s a list to use (top 3):
1. Universal, for any role
“I’m someone who’s very organized, reliable, and focused on doing quality work.
I’ve spent the last [X] years working in [field/type of role], where I’ve been responsible for [1–2 relevant responsibilities]. In that time, I’ve learned how to [key skill tied to the job] and work effectively with different people and priorities.
Right now, I’m looking to grow in a role where I can contribute consistently, keep improving my skills, and add value to a team like yours.”
2. Stronger version (to stand out)
“I’m a detail-oriented and dependable professional who enjoys solving problems and keeping things running smoothly.
In my previous role, I worked on [specific tasks], where accuracy and communication were important. I’m known for being someone people can rely on and for staying calm under pressure.
I’m excited about this opportunity because it aligns with my strengths, and it’s a place where I can continue developing while contributing meaningfully.”
3. If they want it very short (some interviewers do)
“I’m a reliable, organized professional with experience in [area]. I enjoy learning, improving processes, and contributing to a team. I’m now looking for a role where I can apply my skills and continue growing.”
4. What to avoid
- Childhood stories
- Hobbies (unless directly relevant)
-“I’m passionate about everything.”
- Repeating your CV line by line
- Saying what you want without what you offer
5. Pro tip (interview-level polish)
End with something that bridges to them:
“That’s why this role caught my attention.”
It invites the interviewer to continue.
Next time an interviewer asks what your salary expectations are;
https://t.co/Hv7uMut0Xz
Data Analysts!!
The next time you’re looking for a dirty dataset to clean to practice your data cleaning skill, use this prompt to generate the data from Ai.
Save for later.
“You are a data generator simulating real-world datasets for data analysis practice.
Create a dataset with the following specifications:
1. Domain / Context:
- [INSERT DOMAIN: e.g., e-commerce, healthcare, banking, education, logistics]
2. Dataset Size:
- Generate [X] rows
3. Columns (with data types and meaning):
- Provide [10–20] columns including a mix of:
- Numerical (integers, floats)
- Categorical (nominal + ordinal)
- Text fields
- Dates/timestamps
- IDs (some structured, some inconsistent)
4. Intentional Data Quality Issues (VERY IMPORTANT):
Introduce realistic “dirty data” problems such as:
- Missing values (random + patterned)
- Duplicate rows and duplicate IDs
- Inconsistent formats (e.g., dates: DD/MM/YYYY vs MM-DD-YY)
- Typographical errors in categorical values
- Mixed units (e.g., kg vs lbs, USD vs NGN)
- Outliers and extreme values
- Invalid entries (e.g., negative ages, impossible dates)
- Inconsistent capitalization and whitespace issues
- Corrupted or partially truncated text fields
- Columns with mixed data types
5. Relationships:
- Include at least 2–3 meaningful relationships between variables
- Add some noise that weakens perfect correlations
6. Output Format:
- Provide the dataset as a table (CSV format preferred)
- Include column headers
7. Additional Context:
- Briefly describe what each column represents
- Mention key data issues intentionally inserted (but do not fix them)
8. Difficulty Level:
- Make this dataset suitable for intermediate to advanced data cleaning and exploratory data analysis
Important:
- Do NOT make the dataset perfectly clean
- Prioritize realism over neatness
- Ensure the dataset looks like something collected from real operations”
Most remote job boards show you the same 500 listings everyone else sees.
Fortunately, Reddit has thousands of unadvertised roles if you know how to look.
Here's how to find them:
INSTEAD OF WATCHING NETFLIX TONIGHT.
Spend 1 hour with this.
Claude AI FULL COURSE that teaches you how to BUILD and AUTOMATE anything.
The people who watch this tonight will wake up tomorrow with a new skill.
Watch it and Bookmark it now.
Dashboard is not Data Analysis‼️‼️
There are steps involved in Data Analysis, and I want to walk you through all of them.
This is what the process actually looks like. 🧵
Retweet for others.