Estou vendo gringos postando mapas de cidades isométricas... Po, acho que fica bem melhor em 3D
Fiz esse daqui recentemente pra um projeto #30DayMapChallenge
Holy sh*t. Cities have been digging up streets blind for decades, smashing cables with excavators and wasting billions on emergency repairs because utility companies still run on last-century blueprints...
But everything is shifting now. I hooked up a local geodetic model and RTK tracking straight to a smartphone to scan underground utilities in real-time right through the camera.
Right under the asphalt in real-time, you can see everything:
1. power cables -> exact position
2. hidden pipes -> depth down to the centimeter
3. underground voids -> in AR mode
4. GPS error -> fixed via RTK Fixed
Now this thing highlights the utility grid right under your feet in real time, eliminating any surprises during excavation.
Remember, urban infrastructure was built on paper maps from fifty years ago. Your roads deserve precision.
The real race in tech right now is integrating digital twins of the physical world into augmented reality. Massive databases surprise no one anymore, so software now needs to see straight through walls and asphalt.
So check yourself, it takes only a few minutes. Full step-by-step below, save this.
Una joven de 21 años fue ultrajada en Barreiras, Bahía (Brasil), el jueves 29 de octubre alrededor de las 5:30 am mientras caminaba hacia el gimnasio.
El agresor Cássio da Silva Santos, de 27 años, la abordó por detrás, "le tocó" y la obligó a acompañarlo fingiendo que eran pareja hasta el barrio "Villa de los Funcionarios" donde la llevó debajo de un árbol para cometer la agresión.
Cámaras de seguridad captaron el momento exacto del acoso y cómo la víctima fue coaccionada con la amenaza de un arma; tras el ataque ella fue atendida por el servicio de emergencias y trasladada al Hospital del Oeste.
El sospechoso fue detenido en flagrancia esa misma mañana en el barrio San Pedro por la Policía Militar, que encontró en su casa las mismas prendas que usaba en el video; el caso generó indignación en todo Brasil y la investigación continúa a cargo de la Delegación Especial de Atención a la Mujer.
11 million volunteers have unknowingly built one of the world’s most valuable AI datasets.
Most people think of OpenStreetMap as a free alternative to Google Maps. A new paper in Scientific Reports argues it has become something much bigger: the shared geographic layer that multiple AI systems can build on.
The researchers combined OpenStreetMap with satellite imagery, demographic data and environmental records to tackle four completely different urban planning problems. They classified land use, detected buildings, predicted traffic and forecast air quality, all within a single framework.
Instead of forcing one large model to do everything, they used specialist models for each task. A CNN classified land use, a U-Net mapped building footprints, an LSTM predicted traffic, and a hybrid CNN-RNN forecast air pollution. The common thread wasn’t the models. It was the map underneath them.
The results were strong. Land use classification reached 91.6% accuracy, building detection reached 94.0%, traffic prediction achieved an error of just 3.6 vehicles per hour, and air quality forecasts were within 2.3 µg/m³.
What’s pretty remarkable is where that map came from.
OpenStreetMap wasn’t built by a government agency or a technology company. More than 11 million volunteers have spent years mapping roads, buildings, footpaths, parks, bus stops and cycle lanes. Every edit adds another piece of structured geographic data that AI systems can learn from.
That changes the economics of urban AI. Instead of relying on expensive proprietary mapping databases that are updated on commercial schedules, researchers can build on a living dataset that evolves every day as contributors map the world around them.
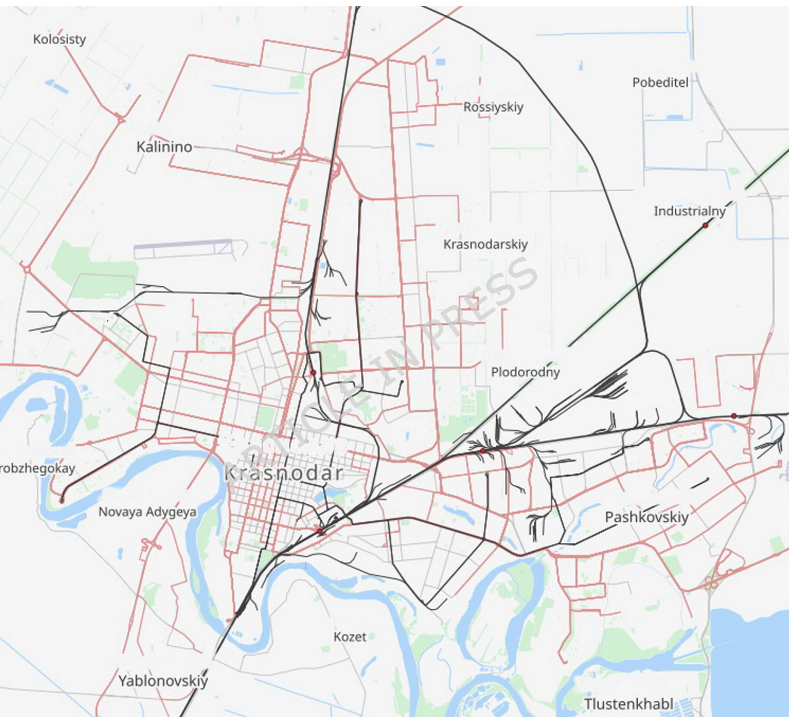
The study focused on Krasnodar, but the framework was designed to transfer to other cities with different layouts and data quality. The individual models may change over time. The shared geographic foundation is likely to remain.
People often describe foundation models as systems trained on text, images or code. Geography may deserve a place on that list.
As more of the physical world becomes machine-readable, maps stop being navigation tools, and become infrastructure for AI.
Link to full paper: https://t.co/0BVKcJarXz
Not all forests are equal, and now we can map the difference. 🌳
Meet Forest Typology (ForTy): a 10m map of natural, planted, and farmed forests to help identify deforestation and protect the forests that matter most. 🧵
I built an app that shows how rain floods different parts of Lagos.
Search your area and see where the water collects and how deep it gets, hour by hour, in 3D.
Lekki, VI, Ikoyi, Lagos Island, Yaba and more.
Try it: https://t.co/W1YYwaXb1u
ESRI, but free and open source:
make, style, and analyze maps from raster, vector, mesh, and point cloud data, then export as image, PDF, or SVG. Runs 200+ native processing algorithms.
You've watched the planet change in Google Earth Timelapse. Now you can build with the imagery behind it in the Earth Engine Data Catalog.
For the first time, all 39 annual global mosaics from 1984 to 2022 are open data, alongside the full methodology
Read the full announcement : https://t.co/i7ZvUEa1KH