GOLD |
#Xauusdgold#ForexTrading
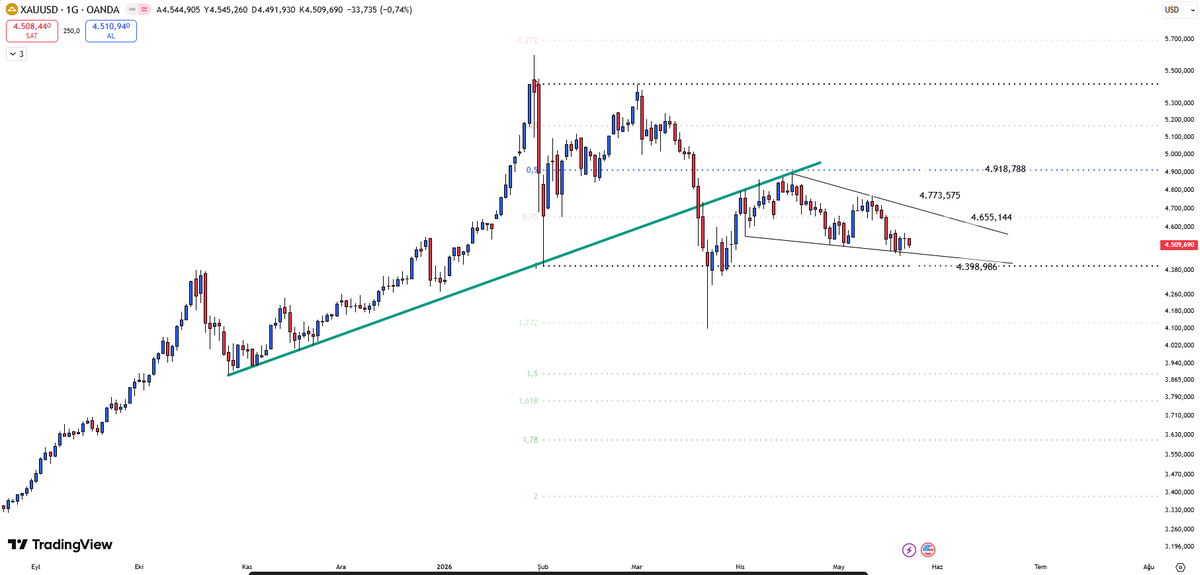
✅SUPPORT 1: $4398
✅SUPPORT 2: $4267
⛔️RESISTANCE 1: $4655
⛔️RESISTANCE 2: $4773
On #gold, a wedge is forming. We should keep an eye on it, and if a breakout occurs, a trade should be taken. Whether it breaks to the upside or downside will depend on how #WARSH behaves toward financial markets over the next few months and how the oil supply shock evolves.
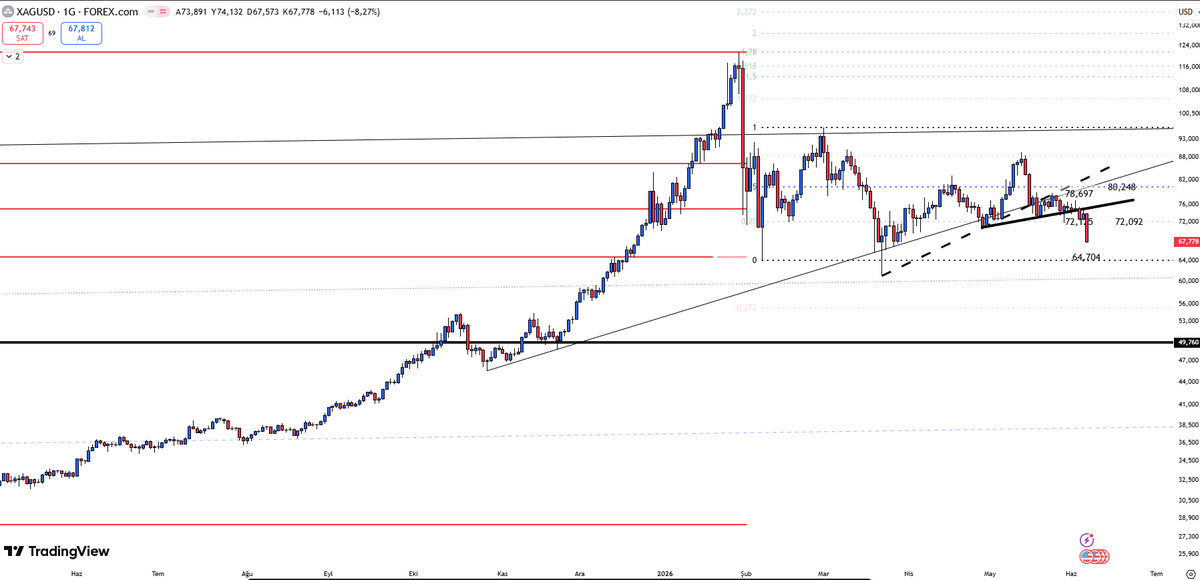
SILVER | $64,70
#Xagusd#ForexTrading
✅SUPPORT 1: $64,70
✅SUPPORT 2: $61,07
⛔️RESISTANCE 1: $72,09
⛔️RESISTANCE 2: $75,00
On #silver, the lower boundary of the range is likely to be tested, which comes in around $64.70. A break below this level would increase downside risks. While projecting a precise target at this stage would be premature, $61.00 could act as an intermediate support level.
SILVER | $64,70
#Xagusd#ForexTrading
✅SUPPORT 1: $64,70
✅SUPPORT 2: $61,07
⛔️RESISTANCE 1: $72,09
⛔️RESISTANCE 2: $75,00
On #silver, the lower boundary of the range is likely to be tested, which comes in around $64.70. A break below this level would increase downside risks. While projecting a precise target at this stage would be premature, $61.00 could act as an intermediate support level.
GOLD | $4130
#Xauusdgold#ForexTrading
✅SUPPORT 1: $4267
✅SUPPORT 2: $4128
⛔️RESISTANCE 1: $4398
⛔️RESISTANCE 2: $4524
On gold, as I mentioned two weeks ago, the 4,398 level has been broken, accelerating the downside momentum. The measured target of this formation is around $4,130, with $4,267 acting as an intermediate support level along the way. Be cautious when opening new positions and avoid rushing into trades.
NASDAQ |
#Nasdaq#usa
✅SUPPORT 1: $29.730
✅SUPPORT 2: $29.200
⛔️RESISTANCE 1: $30.219
⛔️RESISTANCE 2: $30.881
On Nasdaq, we started the day with some selling pressure. If 29,730 fails to hold, we may see the pullback deepen.
POUND-DOLLAR |
#eurusd#ForexTrading
✅SUPPORT 1: 1.3465
✅SUPPORT 2: 1.3430
⛔️RESISTANCE 1: 1.3515
⛔️RESISTANCE 2: 1.3550
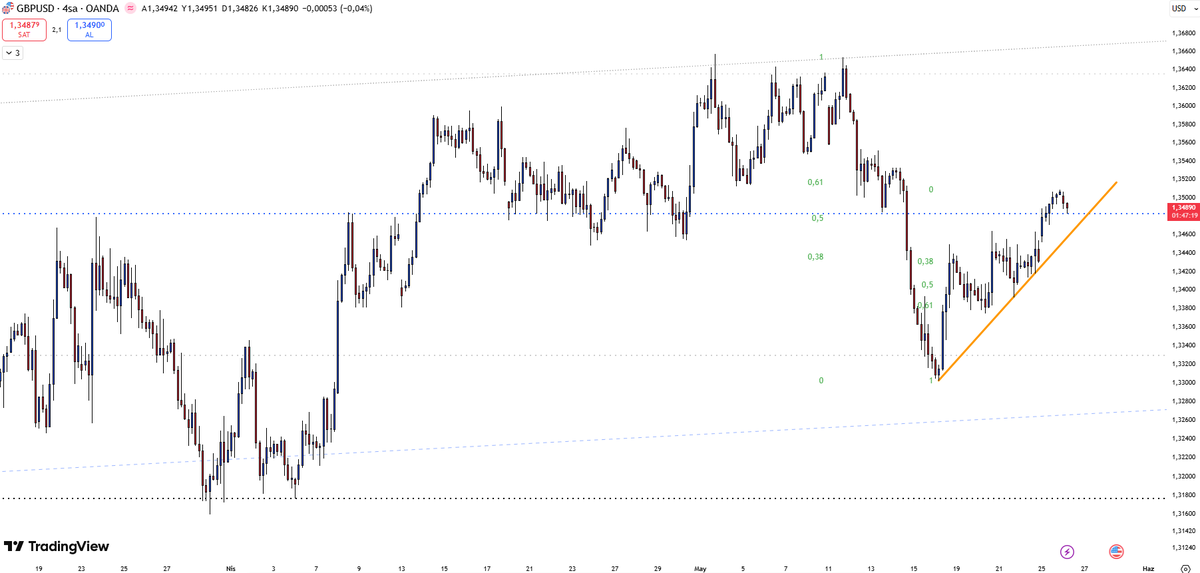
On GBP/USD, the 1.3480–1.3465 band is critical. Below it, we could see 1.3430 being tested. On the upside, 1.3515 remains a key resistance level.
EURO-DOLLAR |
#eurusd#ForexTrading
✅SUPPORT 1: 1.1600
✅SUPPORT 2: 1.1525
⛔️RESISTANCE 1: 1.1655
⛔️RESISTANCE 2: 1.1703
On EUR/USD, as I said, 1.1655 is a critical resistance level, and it worked on Monday. Above it, we may expect a move toward 1.1703. On the downside, the 1.1600 weekly volume gap level is the first critical support.
BRENT OIL |
#OilMarket#IranWar#oil
✅SUPPORT 1 : $91,78
✅SUPPORT 2: $88,20
⛔️RESISTANCE: $96,83
On #Brent, $96.82 is the key resistance level, and any break above it could pave the way toward $98.60. On the downside, $91.78 remains a key support level. Below that, we need to monitor the $88.20 level closely.
SILVER |
#Xagusd#ForexTrading
✅SUPPORT 1: $74,5
✅SUPPORT 2: $72,17
⛔️RESISTANCE 1: $78,67
⛔️RESISTANCE 2: $80,24
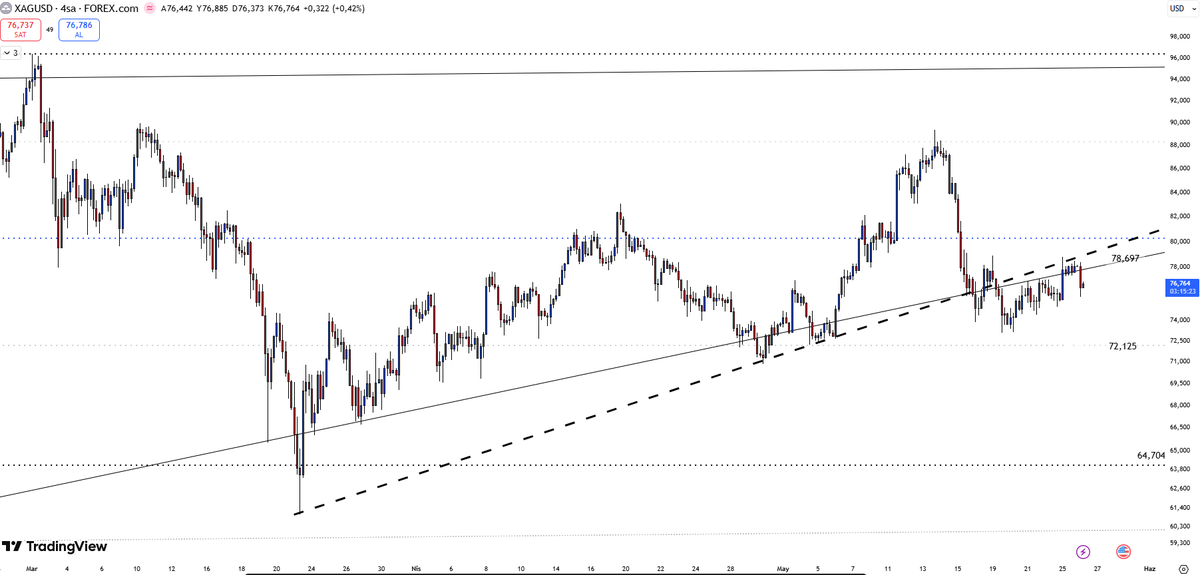
On #silver, the short-term uptrend line is now acting as resistance. The first level that needs to be surpassed to maintain momentum is 78.67. After that, the 80.24 resistance level remains intact. On the downside, 74.5 is the first support level. Below that, 72.17 is the key level , unless it holds, selling pressure could deepen.
GOLD |
#Xauusdgold#ForexTrading
✅SUPPORT 1: $4509
✅SUPPORT 2: $4463
⛔️RESISTANCE 1: $4575
⛔️RESISTANCE 2: $4613
On #gold, after rebounding from the lower boundary of the wedge, an inverse head-and-shoulders pattern formed. As long as the price stays above the $4,509 weekly volume gap, higher prices remain possible. Unless it does, the first downside target would be $4,463. On the upside, the 0.382 retracement level worked well, and we first need to break above that level.
NASDAQ |
#Nasdaq#usa
✅SUPPORT 1: $29.730
✅SUPPORT 2: $29.200
⛔️RESISTANCE 1: $30.219
⛔️RESISTANCE 2: $30.881
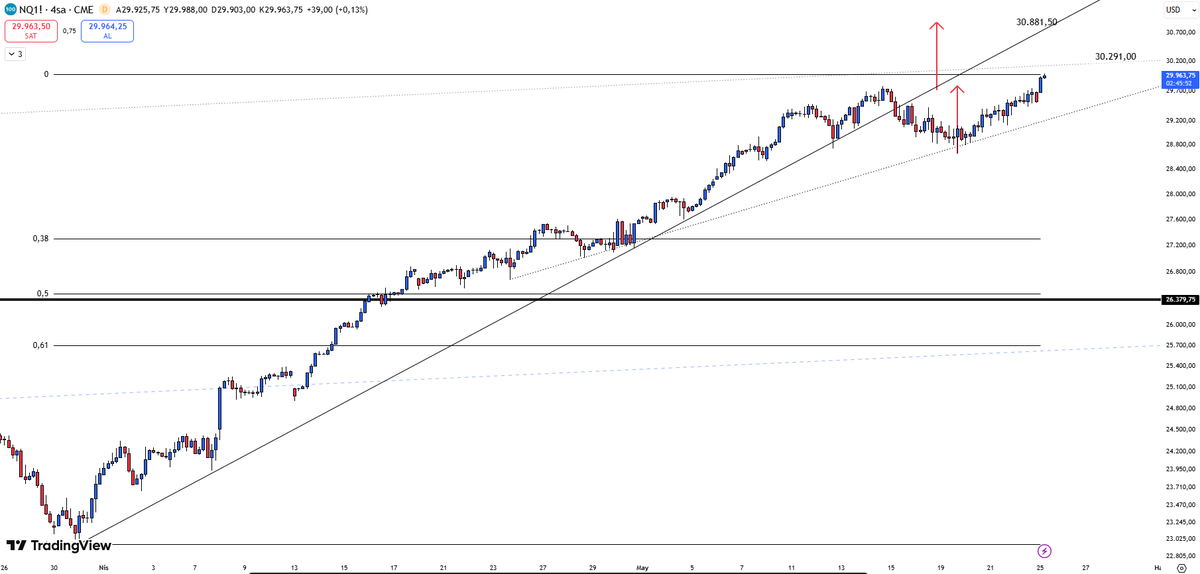
On Nasdaq, we are seeing an uptrend fueled by the U.S. benefiting from its position as a net oil exporter following the Iran war. The most notable point is that, on the 4-hour chart, the medium-term trend was broken and replaced by a new, less steep uptrend. Today, the key level on the upside is 30,291. On the downside, below 29,730, we should watch the 29,200 level closely.
BIST 100 |
#bist100#Borsaİstanbul
✅SUPPORT 1: 12.820
✅SUPPORT 2: 11.350
⛔️RESISTANCE 1: 14.300
On BIST 100, the index has failed to maintain momentum above the 0.5 extension level of the long-term channel. On the downside, we need to monitor the 12,820 level to preserve the short-term uptrend. Below that, we will likely see a test of 11,351. On the upside, 14,300 remains the critical resistance level.
BRENT OIL |
#OilMarket#IranWar#oil
✅SUPPORT 1 : $94.60
✅SUPPORT 2: $91.68
⛔️RESISTANCE: $96,83
I did not expect it to work that quickly, but we need to stick to technical analysis :)
BRENT OIL |
#OilMarket#IranWar#oil
✅SUPPORT 1 : $96.82
✅SUPPORT 2: $91.68
⛔️RESISTANCE: $103.35
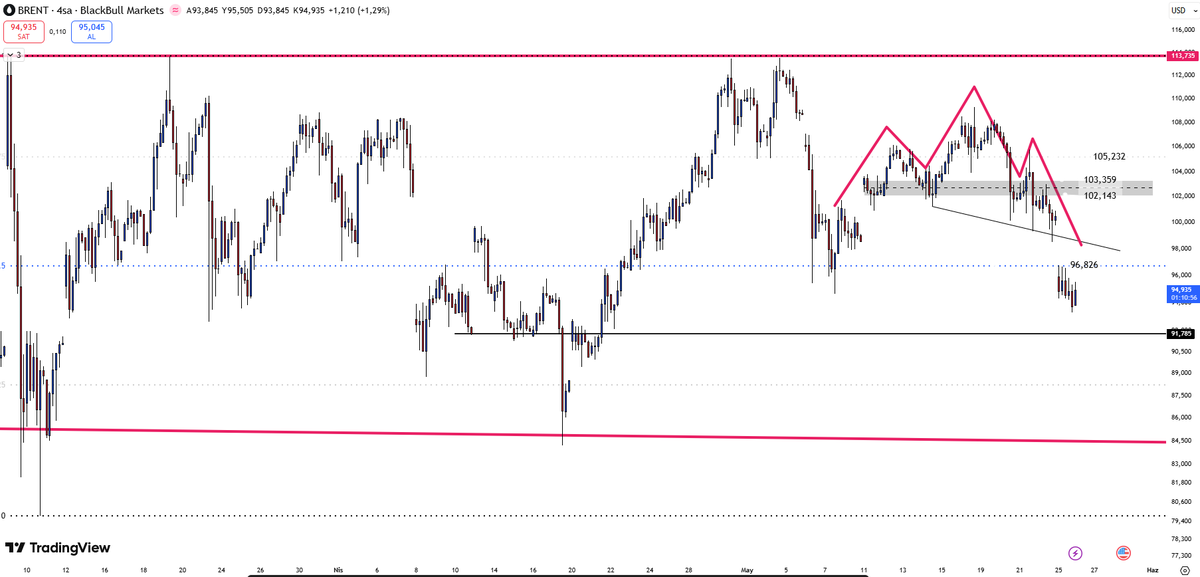
On #Brent, we need to take a closer look at the 4H timeframe. We can see a clear range where the price has been fluctuating between $80 and $113. What stands out the most to me is the head-and-shoulders formation that has been developing since May 12. If it plays out, we may see oil move back toward $90 again.
US DOLLAR INDEX |
#dxy#fed
✅SUPPORT 1: 98,75
✅SUPPORT 2: 98,57
⛔️RESISTANCE 1: 99,50
⛔️RESISTANCE 2: 100,60
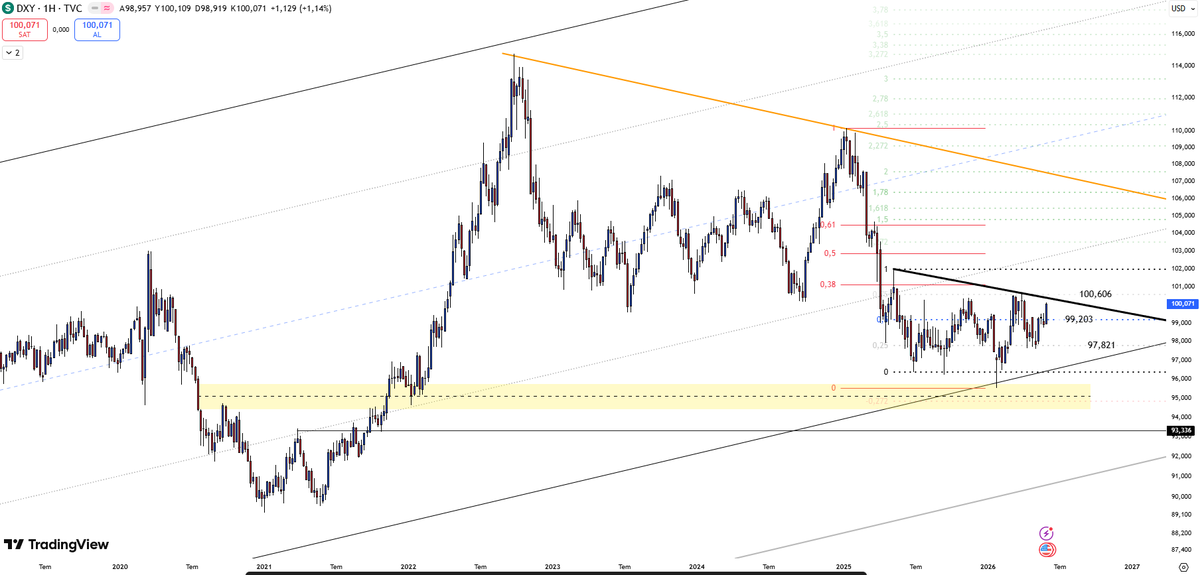
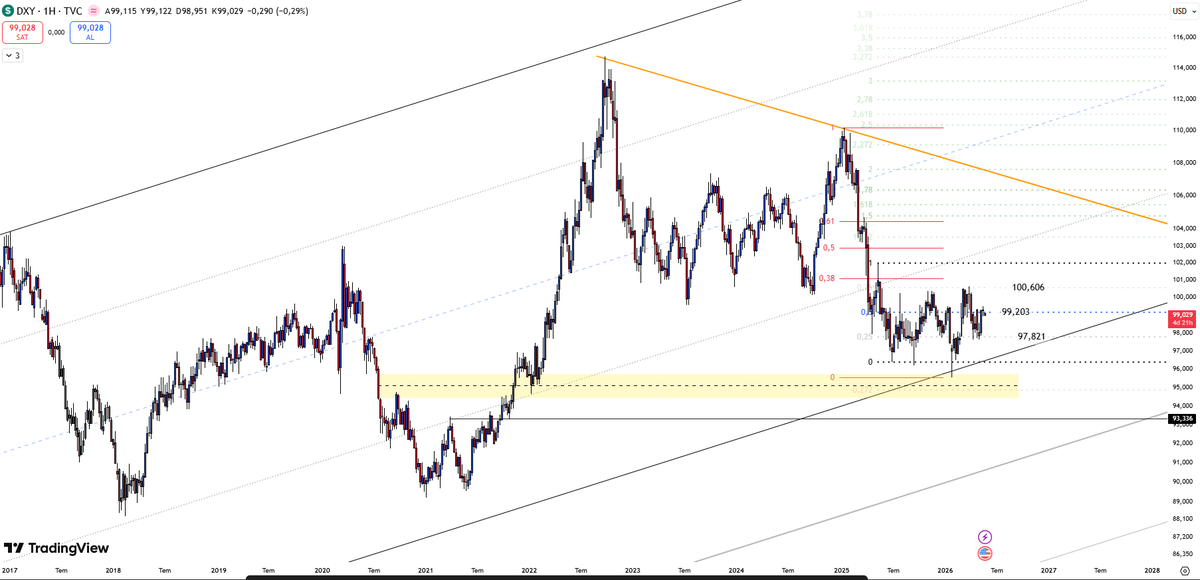
On DXY, we can clearly see a double-bottom formation developing. The validation zone lies within the 99.20–99.50 range. Above that, we may see DXY move toward the 100.60 level, potentially supported by geopolitical developments related to Iran that favor the #US . On the downside, the 98.75–98.57 zone remains the first major support preventing DXY from falling toward 97.82.
EURO-DOLLAR |
#eurusd#ForexTrading
✅SUPPORT 1: 1.1524
✅SUPPORT 2: 1.1440
⛔️RESISTANCE 1: 1.1655
⛔️RESISTANCE 2: 1.1740
On EUR/USD, we are seeing a range within a range. After breaking below the midpoint of the smaller range, the next target should be 1.1520. Below that, the 1.1450–1.1395 zone remains critical. We should closely monitor how growth projections in Europe evolve over time.
US 10 YEAR NOTES |
#TBOND#FED#US10Y#USTREASURY
✅SUPPORT 1 : %4,46
✅SUPPORT 2: %4,30
⛔️RESISTANCE: %4,575
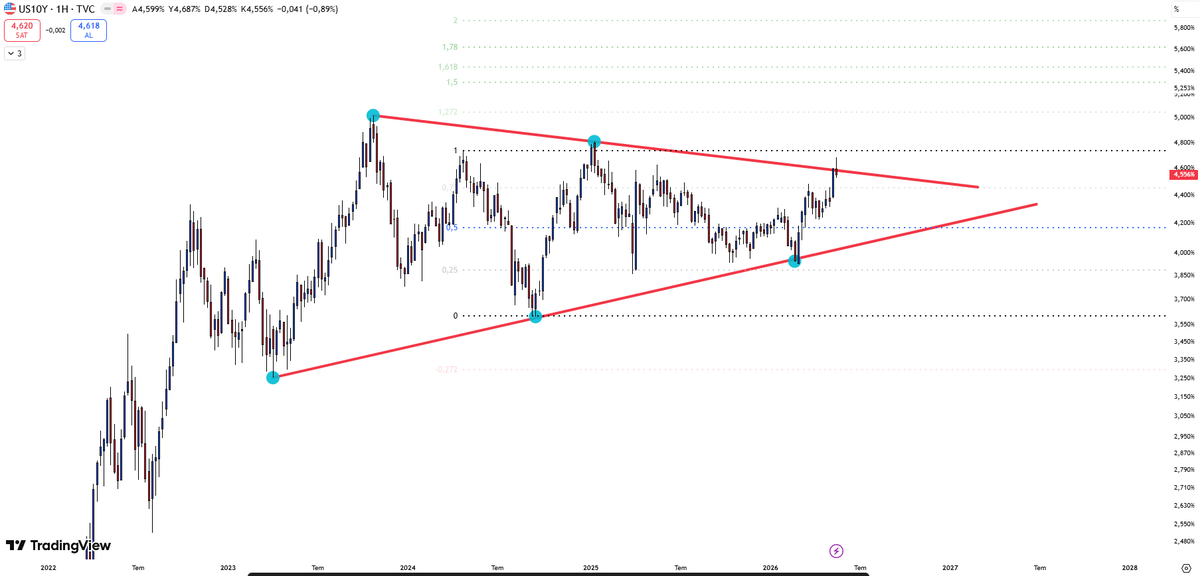
On U.S. 10-year Treasury bonds, we saw a modest decline after the sharp rally that occurred last week. Of course, it is difficult to comment on bonds without mentioning geopolitics and fiscal policy, but from a technical perspective, if this triangle is broken, we may see yields move through the 5% threshold sooner rather than later.
SILVER |
#Xagusd#ForexTrading
✅SUPPORT 1: $72,09
✅SUPPORT 2: $64,70
⛔️RESISTANCE 1: $80,24
⛔️RESISTANCE 2: $88,40
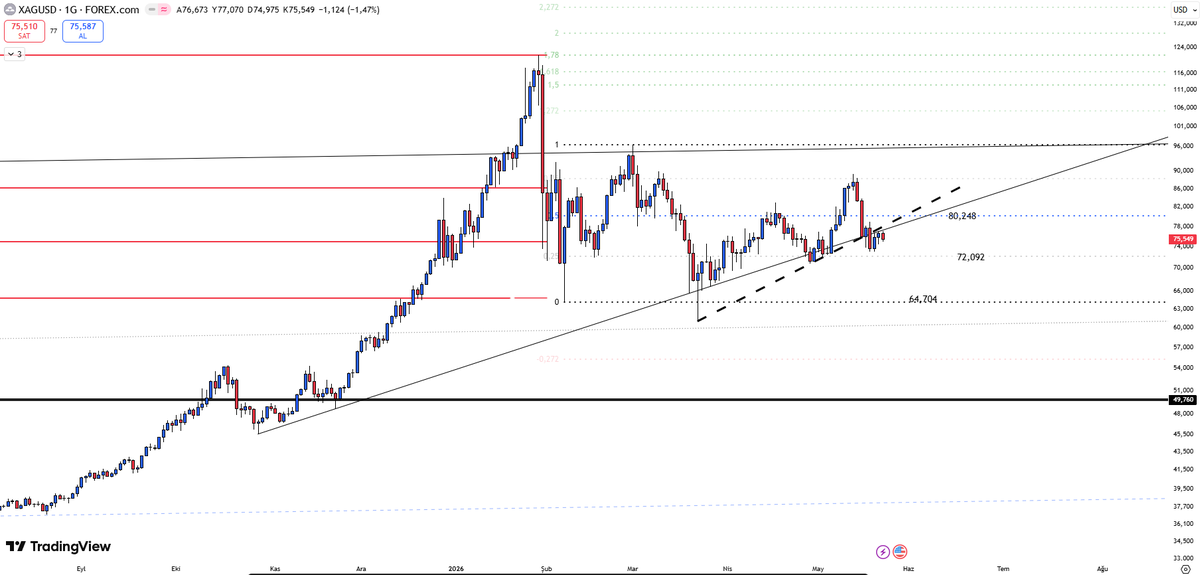
On #silver, after a parabolic rally, we are witnessing a range-bound market between $96 and $64. Considering the breach of two short-term uptrends, the only way for silver to move higher is for 72.27 to hold. Unless it does, 64.70 is not that far away.