Dow Jones analysis update
$DJI is holding above key support near 49,900, where several technical levels converge:
• 27.2% Fibonacci retracement of the April 2025–August 2026 advance
• Declining support connecting the lows since July 2026
• Potential August–November flag pattern
A close below 49,900 could expose the 48,600–47,600 support zone, near the 4-year channel boundary and the 27.2% retracement of the 2022–2026 advance. Short-term bearish, long-term bullish?
Full analysis: https://t.co/0dVheSuhlC
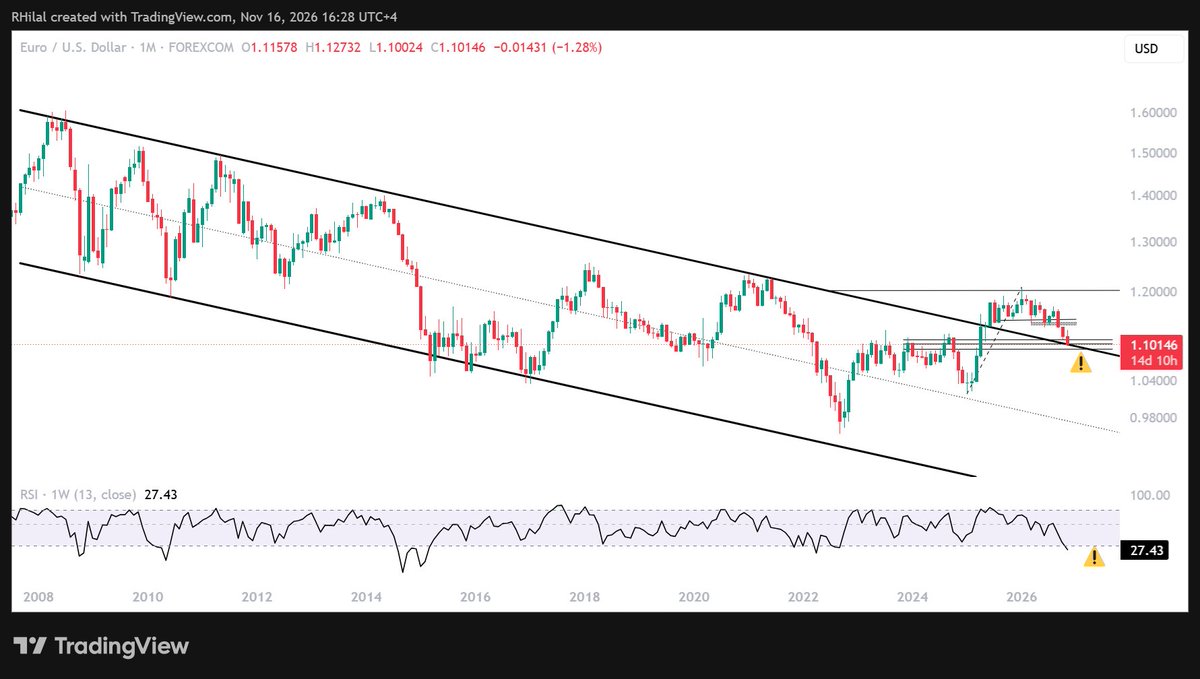
$DXY is climbing toward 104, while $EURUSD continues to test its 18-year support near 1.0930–1.09.
A hawkish Fed tilt may be getting priced in. The euro’s reaction at this support may help define whether the broader move signals trend continuation or reversal risks.
Latest article: https://t.co/fjzyFoqhoo
FED'S WALLER CALLS FOR 50-BASIS-POINT RATE HIKE IN DECEMBER
Federal Reserve Governor Christopher Waller argues the Fed should consider a 50-basis-point rate hike in December rather than splitting tightening into 25-basis-point increases in December and January.
Waller cited three consecutive 0.3% monthly core CPI readings, implying annualized inflation near 3.5%, well above the Fed's 2% target.
He warned that delaying tightening could weaken the market signal.
“My view is then you have to go 50 in December to put it in place and get it done.”
His comments reinforce expectations of a more aggressive Fed tightening cycle.
FED'S WALLER CALLS FOR 50-BASIS-POINT RATE HIKE IN DECEMBER
Federal Reserve Governor Christopher Waller argues the Fed should consider a 50-basis-point rate hike in December rather than splitting tightening into 25-basis-point increases in December and January.
Waller cited three consecutive 0.3% monthly core CPI readings, implying annualized inflation near 3.5%, well above the Fed's 2% target.
He warned that delaying tightening could weaken the market signal.
“My view is then you have to go 50 in December to put it in place and get it done.”
His comments reinforce expectations of a more aggressive Fed tightening cycle.
$NVDA is in focus ahead of today’s US market open after reporting better-than-expected earnings.
- Revenue: $115.8B, up 103% y/y
- Non-GAAP gross margin: 74.9%, up 1.4 percentage points y/y
- Q4 revenue outlook: approximately $130B
- Data Center revenue: $107.6B, up 110% y/y
On the chart, price is testing a key confluence zone:
- The measured target of the May–October double top
- A year-long resistance level that may now be acting as support
- The 38.2% Fibonacci retracement of the 2022–2026 advance
- Weekly RSI at oversold levels last seen in 2022 and 2018
Full analysis:
https://t.co/NQdBuELFPc
Key technical setups I’m watching this week:
- $DXY testing 9-month resistance
- $EURUSD testing an 18-year support level turned resistance
- $GBPUSD testing the lower boundary of its year-long consolidation
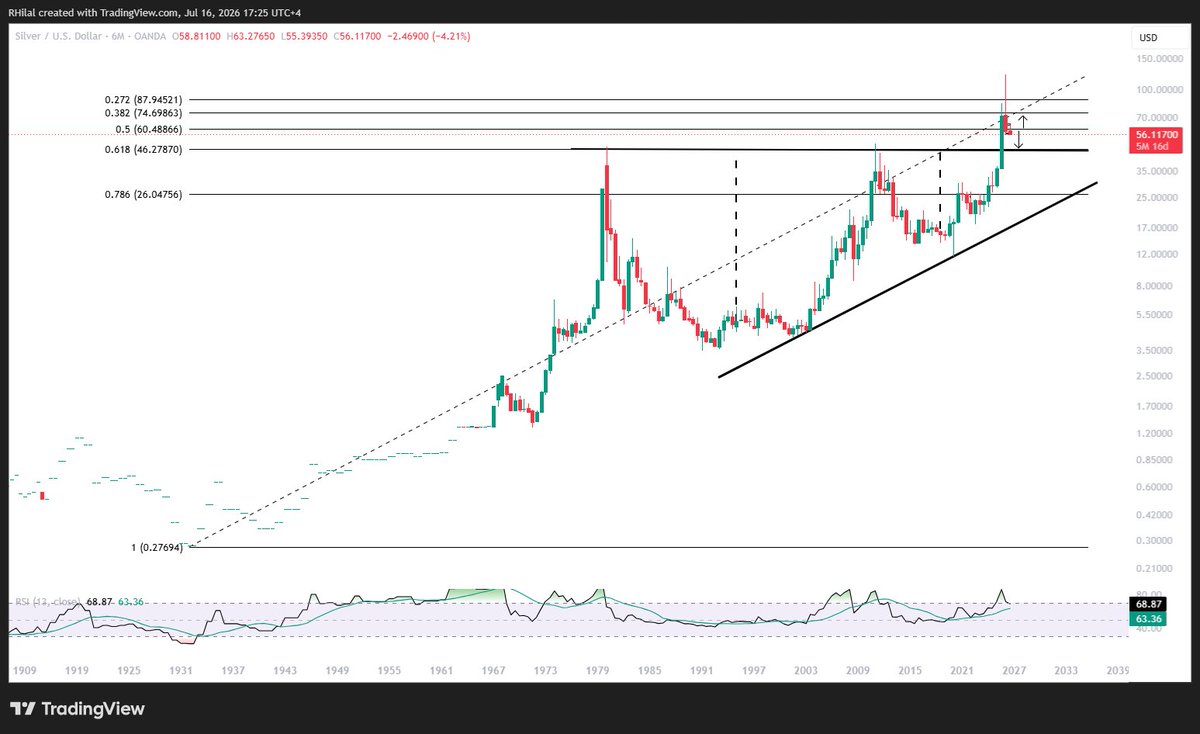
- $Silver approaching multi-decade resistance dating back to 1980, now acting as support
- $Gold struggling to close below 3,870
- $NVDA testing oversold momentum levels last seen in 2022 and 2018
https://t.co/ptAWQxEGCq
$Silver alert
I’ve been watching this setup since July. Silver is now approaching a historical confluence zone near $45.50-45, aligning with:
- The October 2025 low
- The 61.8% Fibonacci retracement of its 1930–2026 advance
- A multi-decade resistance turned support, dating back to the 1980s
$Gold is attempting to close below $3,870. A close below could open the way to another 200–400-point sell-off, but I’m watching silver’s lead here.
Near-term historical support or a longer-term bearish shift?
Similar to $Gold, $Silver is approaching a historical technical set up
• Testing a breakdown below the 50% Fibonacci retracement of the 1930–2026 advance
• Testing the close of a 6-month Shooting Star pattern
Could this become the next dip-buying opportunity?
A break below 55 could expose the 1980–2011–2025 resistance zone, now acting as support, which aligns with the 61.8% Fibonacci retracement near 46-50.
📈 On the upside, silver needs to close back above the 60–65 zone to reclaim the bullish bias.
While the $DXY tests a 9-month resistance, $EURUSD is aligning with:
- An 18-year resistance-turned-support near 1.10–1.0930
- The target of a one-year head-and-shoulders pattern
- Weekly RSI approaching oversold levels last seen in 2022
These levels bring near- and long-term reversal risks into focus.
A close back within the 2008–2025 channel would reinforce the longer-term bearish outlook for the euro. A move above 1.11–1.1260 may strengthen the bullish reversal setup.
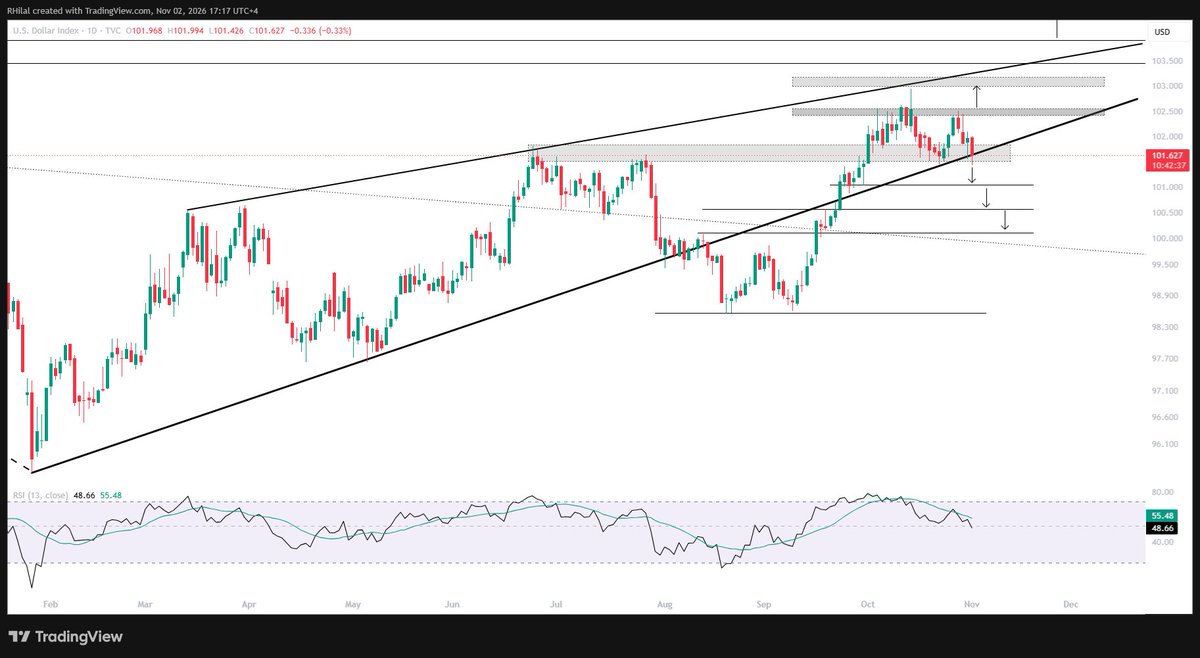
The $DXY may be completing its final wave of 2026, spanning August to November, as it tests:
- 9-month resistance connecting higher highs since March
- Weekly overbought conditions last seen in 2025
- The 103.50 resistance
$Warsh is expected to speak tonight as currencies and metals stretch toward 2026 extremes.
A close above 103.50 would extend bullish continuation risks. A breakdown below 102.60–102 brings the 101.60–101 support zone into focus for a potential rebound or confirmation of a broader bearish shift.
The $DXY may be completing its final wave of 2026, spanning August to November, as it tests:
- 9-month resistance connecting higher highs since March
- Weekly overbought conditions last seen in 2025
- The 103.50 resistance
$Warsh is expected to speak tonight as currencies and metals stretch toward 2026 extremes.
A close above 103.50 would extend bullish continuation risks. A breakdown below 102.60–102 brings the 101.60–101 support zone into focus for a potential rebound or confirmation of a broader bearish shift.
$DXY is holding a bullish bias after briefly testing support near 101, below its 10-month uptrend.
Key catalysts today: U.S. $CPI and U.S.–Iran developments.
Risk-on sentiment may be emerging, but the DXY needs a confirmed break below 101 and then 100 to shift the bias lower.
On the upside, a move back above 102.60–103 would revive bullish continuation risks.
$CrudeOil Outlook: Short-term bullish reversal risks within a broader bearish shift?
Price action and market expectations tend to shift before headlines confirm a deal.
Key scenarios I’m watching:
🔻 A daily close below 84.70 in WTI and 89.50 in Brent could signal another wave of selling.
🔺 A daily close above 95 in WTI and 100 in Brent would strengthen the case for bullish continuation.
Full analysis:
https://t.co/zfY7QoWS79
Bloomberg: The $IEA says global oil markets are set to shift into a supply surplus for the first time since the Iran war began.
Could this confirm the broader bearish shift in $crudeoil charts and support risk sentiment, despite ongoing AI and cybersecurity concerns?
$CrudeOil Outlook: Short-term bullish reversal risks within a broader bearish shift?
Price action and market expectations tend to shift before headlines confirm a deal.
Key scenarios I’m watching:
🔻 A daily close below 84.70 in WTI and 89.50 in Brent could signal another wave of selling.
🔺 A daily close above 95 in WTI and 100 in Brent would strengthen the case for bullish continuation.
Full analysis:
https://t.co/zfY7QoWS79
Brent and WTI have broken their uptrends, and potential double tops now shape both charts. @RH_Waves tracks the Fibonacci support behind the rebounds and the de-escalation signals behind the sell-off.
Read the full piece: https://t.co/x61Wh00AO7
#StoneX#CrudeOil#EnergyMarkets
$NVDA’s steep sell-off is bringing an interesting long-term setup into focus:
- Price is testing one-year support near $165, extending back to September 2025.
- Weekly RSI is testing oversold levels last seen in 2022.
A close below $165 could expose support near $154, which aligns with:
- A two-year resistance turned support
- The 38.2% Fibonacci retracement of the 2022–2026 uptrend
- The target of a potential May–October double top
Will $165 hold, or is $154 next?
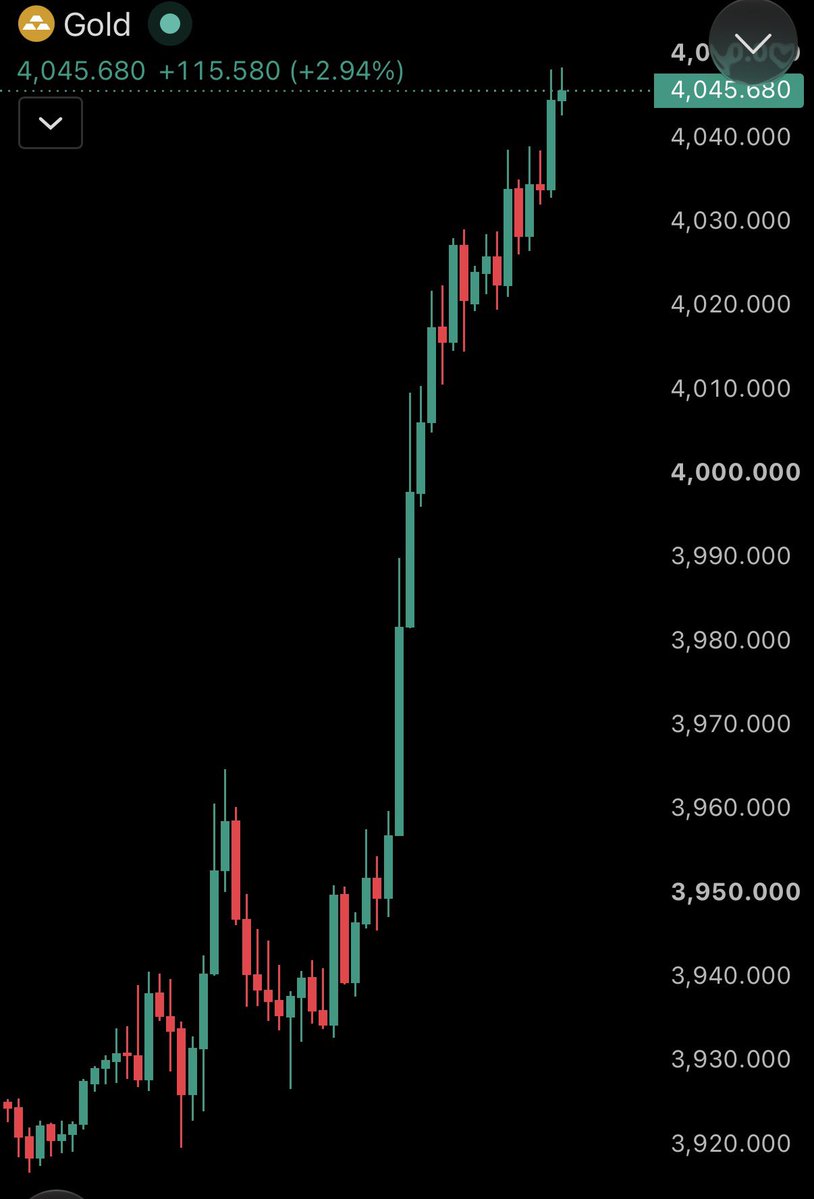
Is $Gold forming an inverse head-and-shoulders pattern?
A close above 4,150–4,200 could confirm the pattern and support a move toward 4,300 and 4,400. Daily RSI is retesting the neutral 50 level from above, keeping the bullish bias in place.
On the downside, the short-term support levels I’m watching are 4,040, 4,000 and 3,970. Longer-term support sits at 3,870. A break below it could expose another 200–400 points of downside.
Gold and Silver remain under pressure from U.S. Treasury yields and geopolitical uncertainty.
$Gold is holding above its 2026 low and the 3,930 support level. A break below could open the way to 3,880, 3,680 and 3,480.
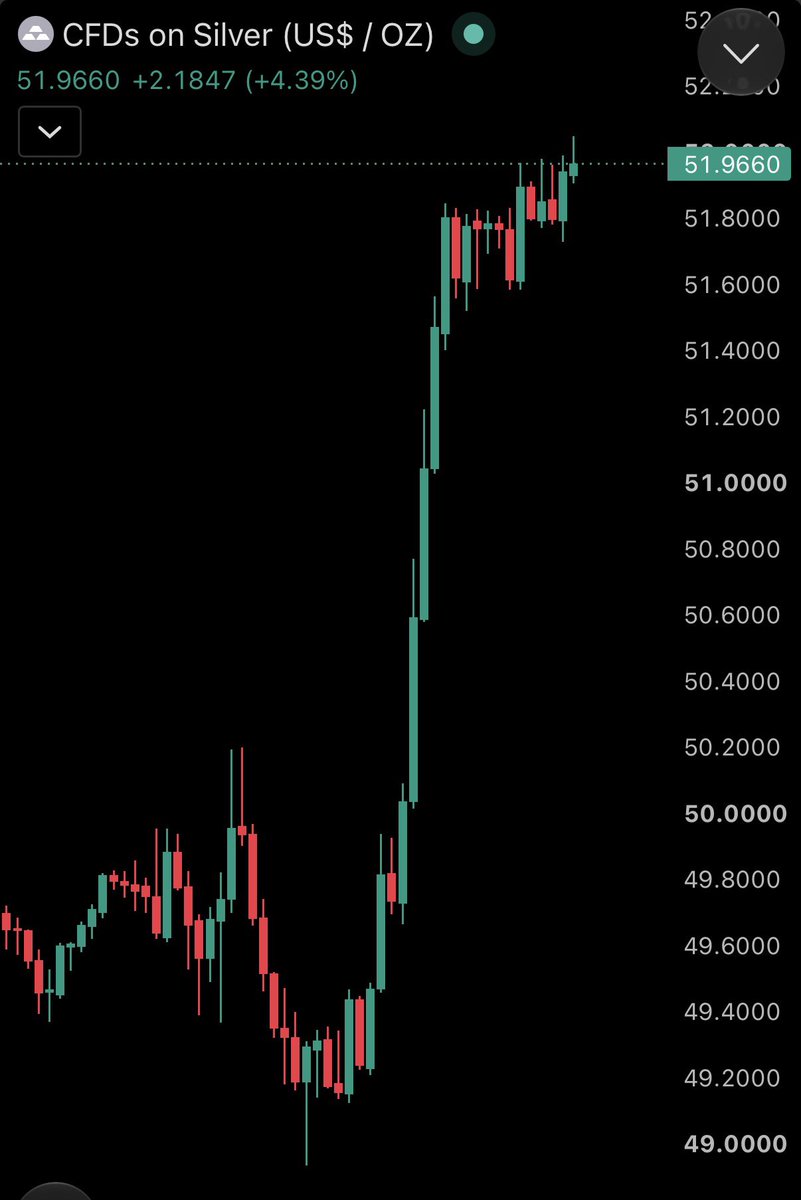
$Silver is testing support near its 2026 lows at 52.80. A sustained break below could expose 50 and 46.
Key scenarios in sight:
https://t.co/TqeFrCB10D
$Silver’s bullish reversal setup remains in play as price tests the 53.80–54.80 resistance zone after rebounding from:
- 10-month descending support
- Daily oversold conditions last seen in 2022
A potential inverse head-and-shoulders pattern is forming. A breakout above 54.80 could expose 57 and then the psychological 60 level, where price would test seven-month descending resistance.
On the downside, a daily close below 49 would expose 45—a historical confluence zone that aligns with October 2025 support.
$Silver may have found a key bullish reversal point.
Price is testing the descending support line connecting lower lows since February 2026, near 49, alongside daily RSI oversold conditions last seen in 2022.
A break lower would bring 45.50 into focus as a potential long-term dip-buying area. A recovery above 55 could confirm a bullish reversal.
$DXY is holding a bullish bias after briefly testing support near 101, below its 10-month uptrend.
Key catalysts today: U.S. $CPI and U.S.–Iran developments.
Risk-on sentiment may be emerging, but the DXY needs a confirmed break below 101 and then 100 to shift the bias lower.
On the upside, a move back above 102.60–103 would revive bullish continuation risks.
The $DXY is testing a key support near 101.40, aligning with
- The 10-month uptrend supporting the 2026 advance
- The June–July 2026 resistance zone, now acting as support
- Daily RSI testing the neutral 50 level from above
A break below 101.40 would shift the outlook to bearish, exposing 101 and the psychological 100 level.
A move back above 102.60 would bring bullish risks and the eight-month rising resistance near 103.20–103.40 into focus.
بنك إنجلترا يرفع الفائدة للمرة الأولى منذ عام 2023 والجنيه الإسترليني يستقر أمام الدولار واليورو.. و الفوز الكاسح للديمقراطيين بانتخابات الكونغرس يضغط على مؤشرات وول ستريت ويقفز بأسعار المعادن النفيسة
📌محللة أسواق معتمدة في https://t.co/4Z5BCs0EoL رزان هلال تتحدث عن التفاصيل لـ #العربية_Business
The $Democratic win is supporting risk assets and may be adding pressure to $Crudeoil, alongside hopes for a US-Iran deal.
$BRENT has pulled back below key 2026 resistance and its three-month uptrend, testing the psychological 100 level.
$WTI has pulled back twice from resistance near 104.50 and is now its testing three-month rising support near 93–91.80.
Full analysis:
https://t.co/ceiLQArz6Y
BREAKING: Gold and silver prices surge after the Democrats take control of the US House and Senate.
The metals have added a combined +$1 trillion in market cap today.
Key setups on my radar this week ahead of the U.S. midterm election results and the U.S. NFP report:
$DXY is testing a cliff’s edge near 101.40 ahead of the election results.
$EURUSD is challenging multi-month resistance near 1.1260, a key level for a potential bullish reversal.
$Gold and $Silver are testing recent lows near 3,870 and 49, respectively, with reversal risks in focus.
$NASDAQ may be completing a broader corrective cycle that began in June 2026, as it tests the 28,000 zone.
https://t.co/hmRSRas2x1