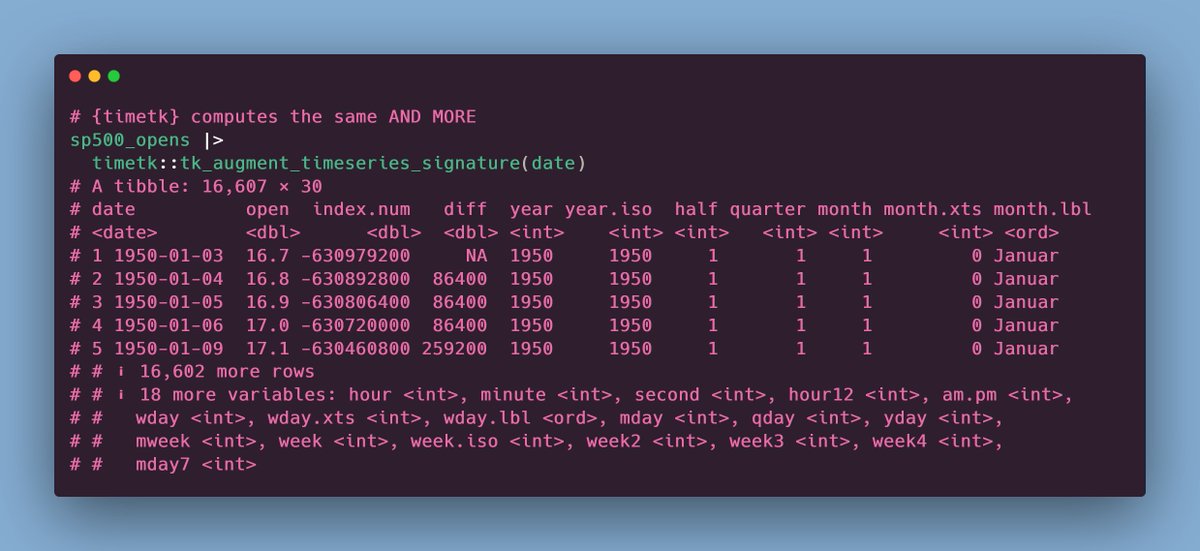
Need to extract days, months, years or more from time data?
Don't compute them all manually with {lubridate}. That's way too tedious.
The {timetk} package has a nice function that does all the heavy lifting for you.
LEFT: {lubridate} workflow
RIGHT: {timetk} workflow
#rstats
I taught a workshop at SER this week called “Reproducible Epidemiology in R”. If you missed it, the materials are available online! https://t.co/3lhDeOuzZy
Introducing {ggflowchart} -Flowcharts can be a useful way to visualise complex processes, and the new R package {ggflowchart} makes them easy to create in R. This blog post shows you how. https://t.co/hNtoA4sKuP… #rstats#ggflowchart#dataviz#rmarkdown#quartopub#rpackage #rstudio #posit
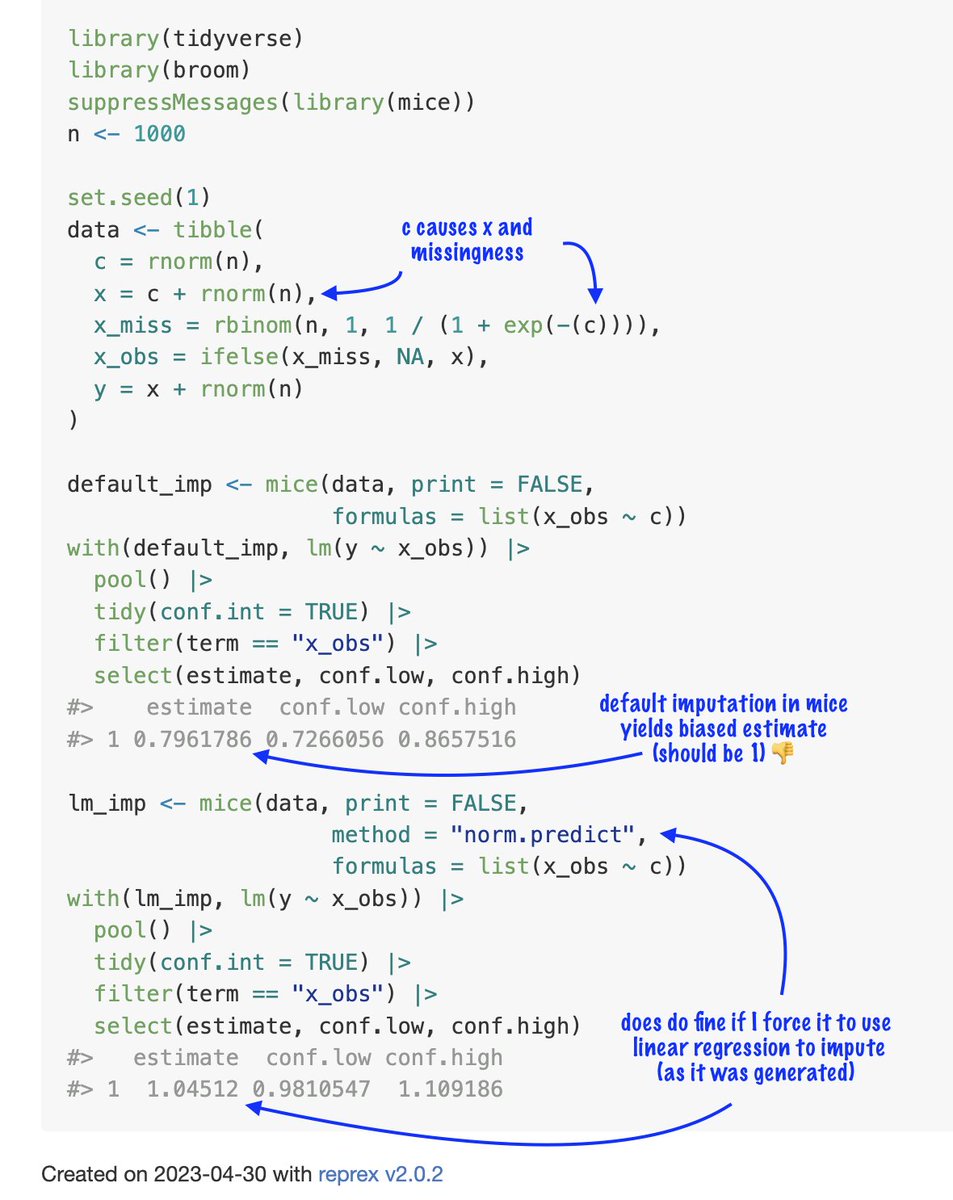
New post on imputation 👀 but first, a {mice} question: I've generated a very simple missing data problem (c ➡️ x + missingness)
when I use the defaults the model post imputation is super biased! Only if I specify to fit a simple regression model does the imputation work...why?
We're happy to share that we've converted https://t.co/rtGQyqv9tI to use #QuartoPub!
It features the much better quarto search & updated function/model search located in the find/ tab
Same look, but this lets us more easily add more content which we're excited to do!
#rstats
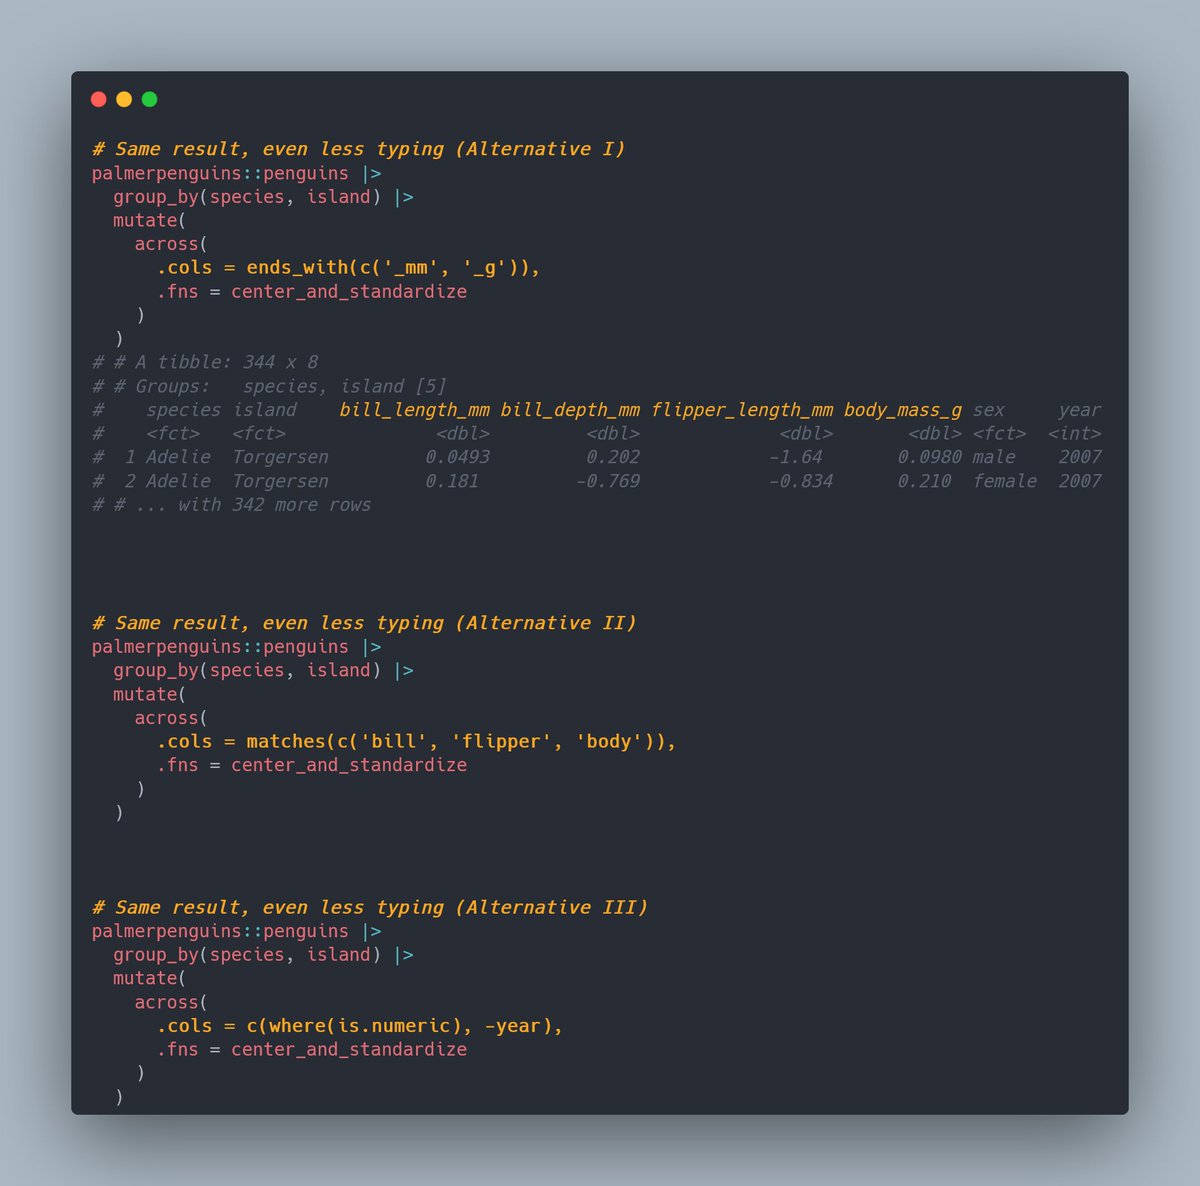
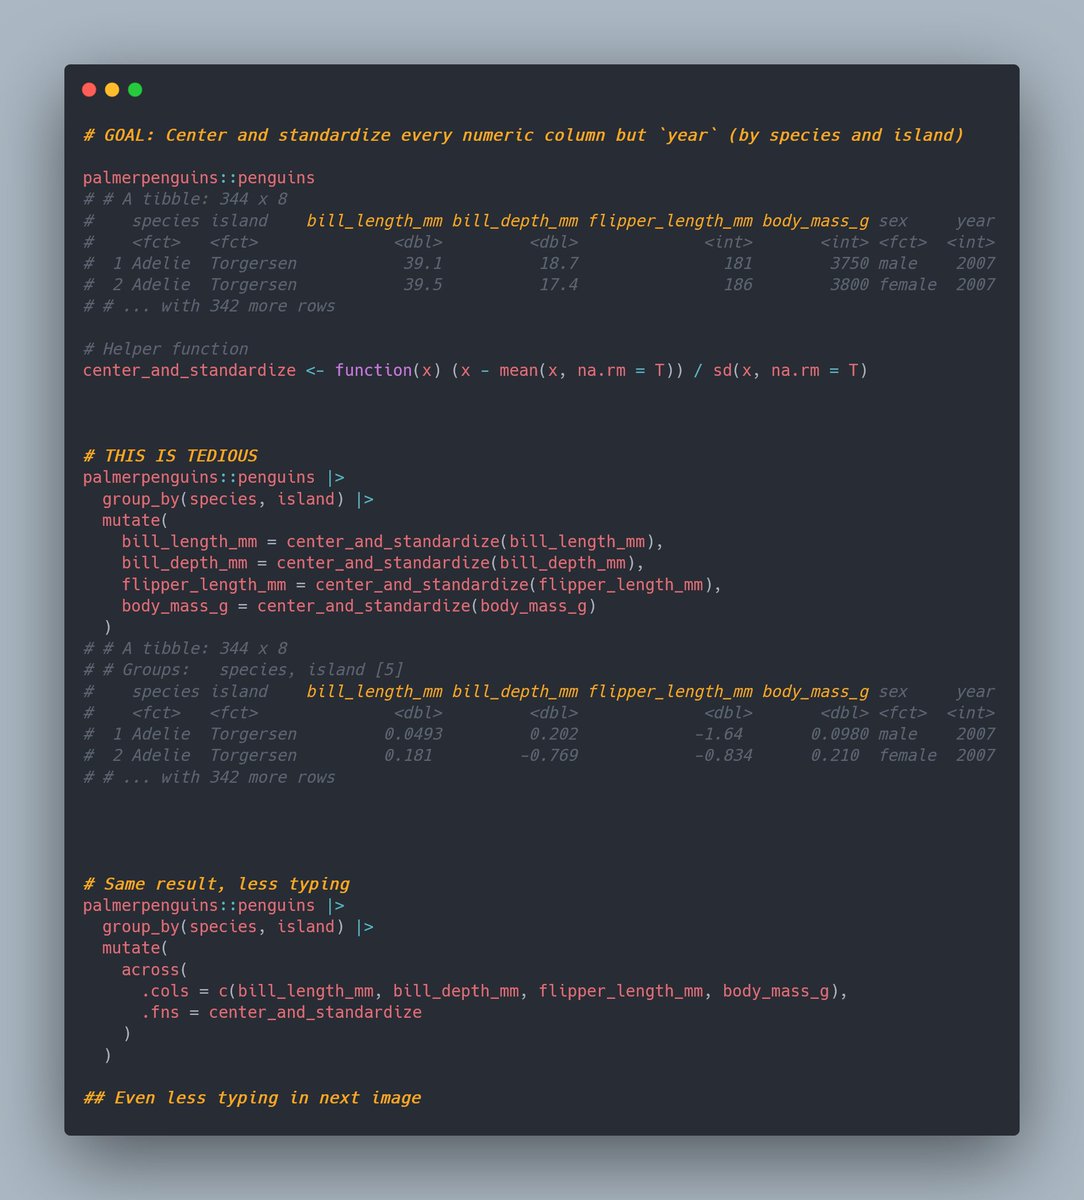
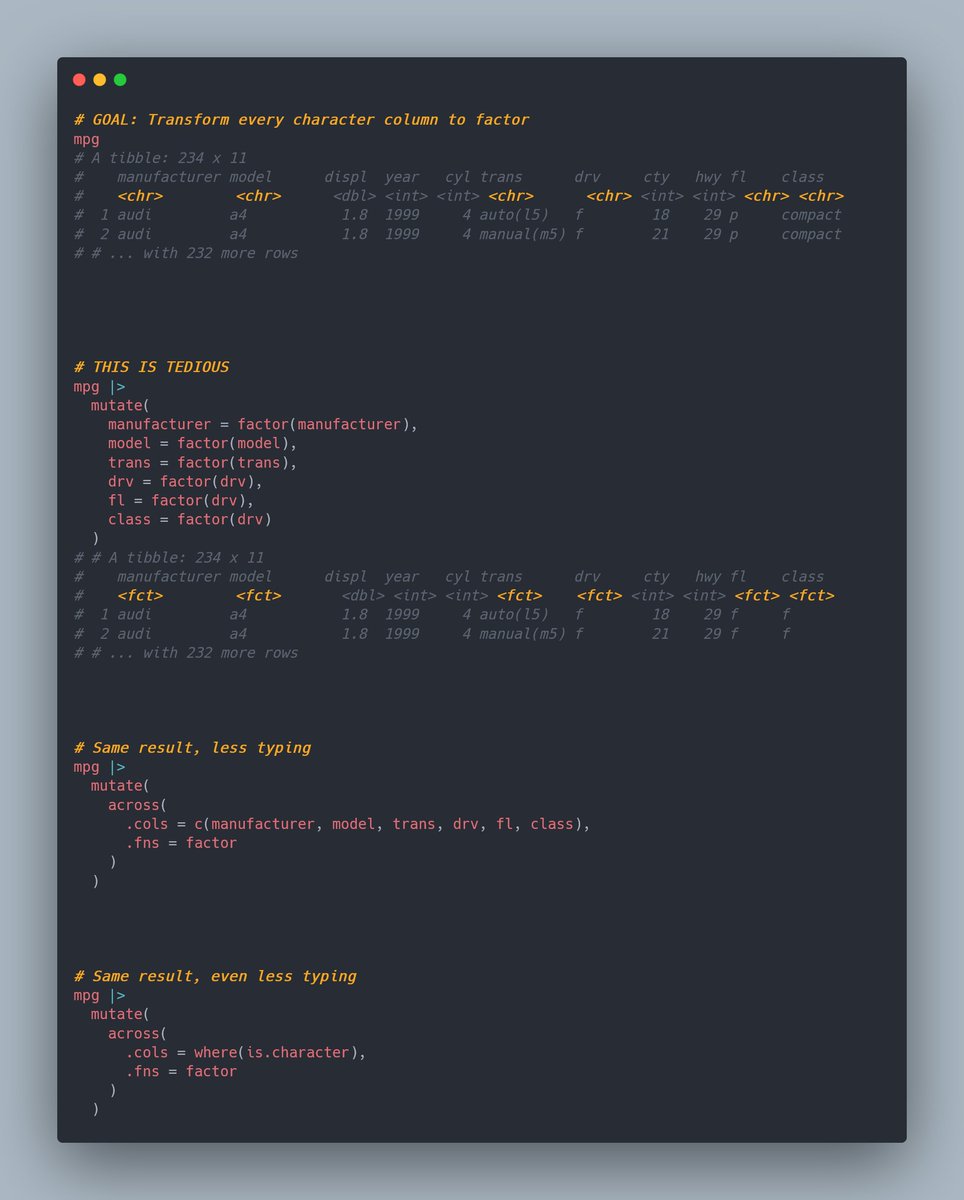
Frighteningly powerful #rstats combo:
mutate() + across() + {tidyselect} helpers 💥 🤯
But the syntax may be a bit confusing at first. So, here are a couple of simple examples.
(With editable code plus meme below)
Data cleaning is tedious.
But it's much easier with the {janitor} package. Especially if you work with Excel files.
Here are 5 underrated features from {janitor}. #rstats
Hi R folks! Want to add some JavaScript to your data science summer? 🌞⛱️ We've got resources to get you swimming w/ data wrangling, viz, & analysis in JS🧡
- 📈Observable Plot from ggplot2: https://t.co/QeAkiX9ofc
- 🛠️Data wrangling in Arquero: https://t.co/1siiwagwVP
🧵1/3
You can step up your data visualization game with {ggiraph} & {patchwork}.
Two premier tools for creating interactive, connected plots with click events and tool-tips. (And they're super easy to use too.)
#rstats#dataviz
Causal inference in industry should be advantaged by greater data & context on past obsv data, but this advantage can only happen with proactive data, metadata, and knowledge mgmt
https://t.co/FPX6FqfYql
1/2
I am excited to teach two in-person workshops at posit::conf(2023) 🔥
Join the 1-day workshop "Designing Data Visualizations to Successfully Tell a Story".
📅 Sep 17, 2023 in Chicago
👉 Register here: https://t.co/HU3Z650ZFI
#positconf2023#DataViz#NoGgplot2 😱
1/ Thrilled to announce: Our new course ChatGPT Prompt Engineering for Developers, created together with @OpenAI, is available now for free! Access it here: https://t.co/OaIpa6L2jn
It was great seeing so many people in Session 1 of our Intro to data wrangling & analysis in JS course today 💜
Session 2 is tomorrow, Th 4/20, 12 - 1pm PT. We'll dive into Array map & filter, Arquero, + more Observable Plot. Come learn & practice w/ us!
https://t.co/pOGCDvZ223
New blog up!
https://t.co/QoP1uLZwCq
This is the second in my series on how to make causal inferences from randomized experiments, using various model types from the GLM.
In this post, we introduce the potential outcomes framework for causal inference, with #marginaleffects.