@GeneralDeeez Best to refine feed now then to get to trapped into project you thought was the best but was only actually best that your algo allowed you to view….
Sun is going down on majority of things we thought were good to be replaced by things that they control
I don’t make the rules
Not buying any of the bs of deals, However it’s always important to be prepared to pivot.
Watching the coming days/weeks closely.
If macro continues to show positive signs very possible we get a lengthy rally into eoy.
Guberment buying ai companies, fed chair pressured to cut among the two biggest catalysts we can expect to see to make a party happen like no one’s business. It’s all fake and gay at this point the real question is are you retarded enough to profit?
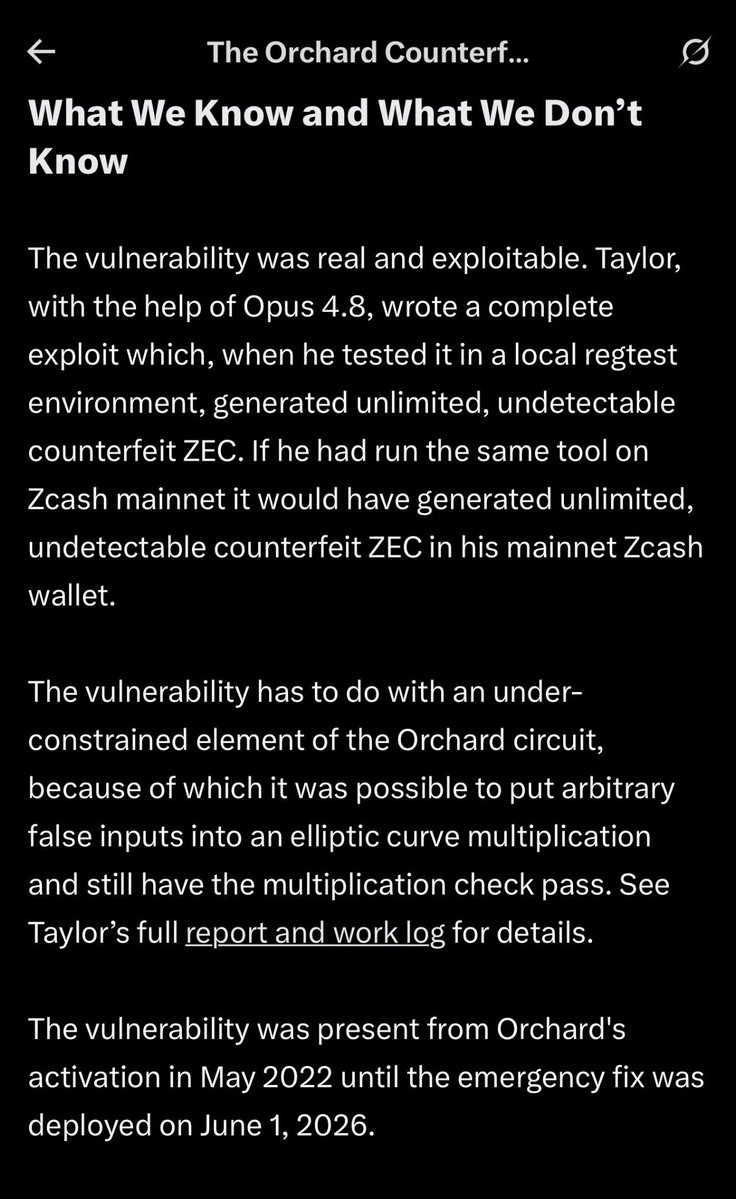
Should be noted that zcash:native also had a vulnerability in 2018 and it wasnt disclosed until it was fixed in 2019.
real supply could be infinite and the chain is private so nobody knows and will never😂😂😂😂😂😂😂😂
God I love being right, I love being neurodivergent, I love being so stubborn yet flexible to data. Thank you for making me extremely sensitive to understanding facts and being able to review data in real time. Thank you for protecting my liquid. In your name we pray. Amen🐻
But bro the 200 day ma ascending triangle rsi divergence is in the channel and it’s bullish because it can’t go past this line I drew😂😂😂😂
Many traders swear by TA—chart patterns, moving averages, RSI, head & shoulders, etc. It feels intuitive: “History repeats.” But evidence and logic show it’s not a consistent edge for predicting prices. Actual data on fundamentals and economics beats it for serious forecasting.
Let’s break it all down.
Core problem #1: Markets are (mostly) efficient.
The Efficient Market Hypothesis (weak form) says past prices are already reflected in current prices. You can’t reliably predict the future from historical price patterns alone because new information drives moves. TA assumes patterns predict—reality says prices follow a “random walk” with new shocks.
Problem #2: Self-fulfilling but fragile.
Popular patterns work sometimes because everyone watches them (support/resistance, Fibonacci). But once crowded, they break. It’s psychology, not physics. Studies note TA can become a self-fulfilling prophecy—until it isn’t, especially in high-liquidity or news-driven markets.
Problem #3: Data mining & hindsight bias.
Backtests look amazing because you can cherry-pick thousands of rules across datasets until something “works.” Rigorous tests adjusting for this (data snooping bias) often find TA profits evaporate. Many academic reviews show no consistent outperformance vs. buy-and-hold after costs/risk.
Problem #4: Ignores why prices move.
TA looks at price & volume (the result), not causes: earnings growth, interest rates, competitive moats, supply/demand shifts, macro data, management quality. A beautiful cup-and-handle won’t save a company with collapsing fundamentals or bad news.
Real-world evidence:
• Comprehensive tests of 5,000+ TA rules across indices often show results no better than random after proper adjustments.
• In developed/liquid markets, TA profitability has declined as markets got more efficient ( algos, ETFs, instant info). It sometimes “works” better in illiquid/emerging markets—but even there, not reliably long-term.
What is better: Measuring actual data.
Fundamental/quantitative analysis looks at real drivers—revenue, cash flow, margins, economic indicators (GDP, inflation, rates), industry trends, valuations (P/E, DCF), etc. This gives insight into intrinsic value and sustainable direction, not just short-term noise.
Why data-driven wins for forecasting:
• It anchors to reality (e.g., a company can’t grow forever without earnings).
• Combines qualitative (moat, management) + quantitative.
• Better for risk management: overvalued? High debt? Regulatory risks? TA misses this. Long-term, value/quality factors backed by data have shown persistence.
Best approach? Hybrid with humility.
Use TA for timing or short-term sentiment if you’re disciplined (entries/exits). But base what you own on measurable fundamentals/economics. No method guarantees wins—markets are uncertain—but ignoring real data for patterns is like navigating by clouds instead of instruments.
Bottom line: TA sells hope via pretty charts. Sustainable forecasting comes from understanding the actual business & economic engine. Focus on data you can measure and defend.
meanwhile they are continually rolling out the infrastructure across multiple chains
still feels like a lot lower than eventually higher. June 10th will be interesting day for all markets.
For too long, financial markets felt out of reach for too many. We are proud to launch the @TrumpAccounts app, a historic tool that brings the President’s vision directly to the kitchen table.
This app ensures that every American family has a direct and easy way to be involved in this historic program. Download the app today, on any app store, to make sure your child is ready for the official July 4th launch. Thank you to @ndstudio, @BNYglobal, and @RobinhoodApp for the incredible work on this project.
@OrangeGooey@MarmotWifFish I have chia:native on cex what do I do to buy $CHIA is there like a uniswap type front end I can use? I like $CHIA meme and tech is very interesting
The stock market is in what I believe is a historic,final parabolic leg of a 44 yr secular bull market.I am raising some of my targets as follows: SPX 10,000, Nasdaq Comp 36,000, DJIA 67,000, RUT 4000, QQQ 950, SMH 800, gold $7000 & silver $200. My other targets remain unchanged.
They will continue to gaslight you and you will like it. This was 10 days into the start of the conflict…. If everyone is wiped out who exactly are they negotiating with??
Bonus round
It was great that Trump captured Venezuela and claimed we are now crazy rich off their oil. Bad thing is when he was speaking he should have been briefed by geologists and petroleum engineers as to what their reserves actually are.
Venezuelan crude (mainly from the Orinoco Belt) is some of the worst oil in the world to extract and refine, although the size of the paper reserves shadow majority of the other deposits globally.
• Extremely Heavy & Viscous: API gravity often 6–10° (compared to ~40° for light WTI crude). It’s basically like tar or molasses — doesn’t flow on its own.
• Very High Sulfur: 2.5–5%+ sulfur content (“sour” crude), which makes it highly toxic and expensive to process.
• Toxic Impurities: Loaded with heavy metals (vanadium, nickel) and asphaltenes that damage refineries and create major pollution.
Extraction Difficulty:
• Requires massive steam injection, diluents, or solvents just to make it move.
• Very energy-intensive and costly to produce at scale.
• One of the most carbon-intensive barrels globally due to the upgrading process needed.
Venezuela has huge reserves on paper, but the oil is among the most difficult and environmentally damaging to extract and refine. This is why production has collapsed despite the resource base — sanctions + terrible oil quality = nightmare economics. Not to mention majority of their production and holding sites look like this…
Still bullish Oil and am realistically looking for a massive parabolic move to levels no one is calling before we can start to talk about an eventual walk back down.
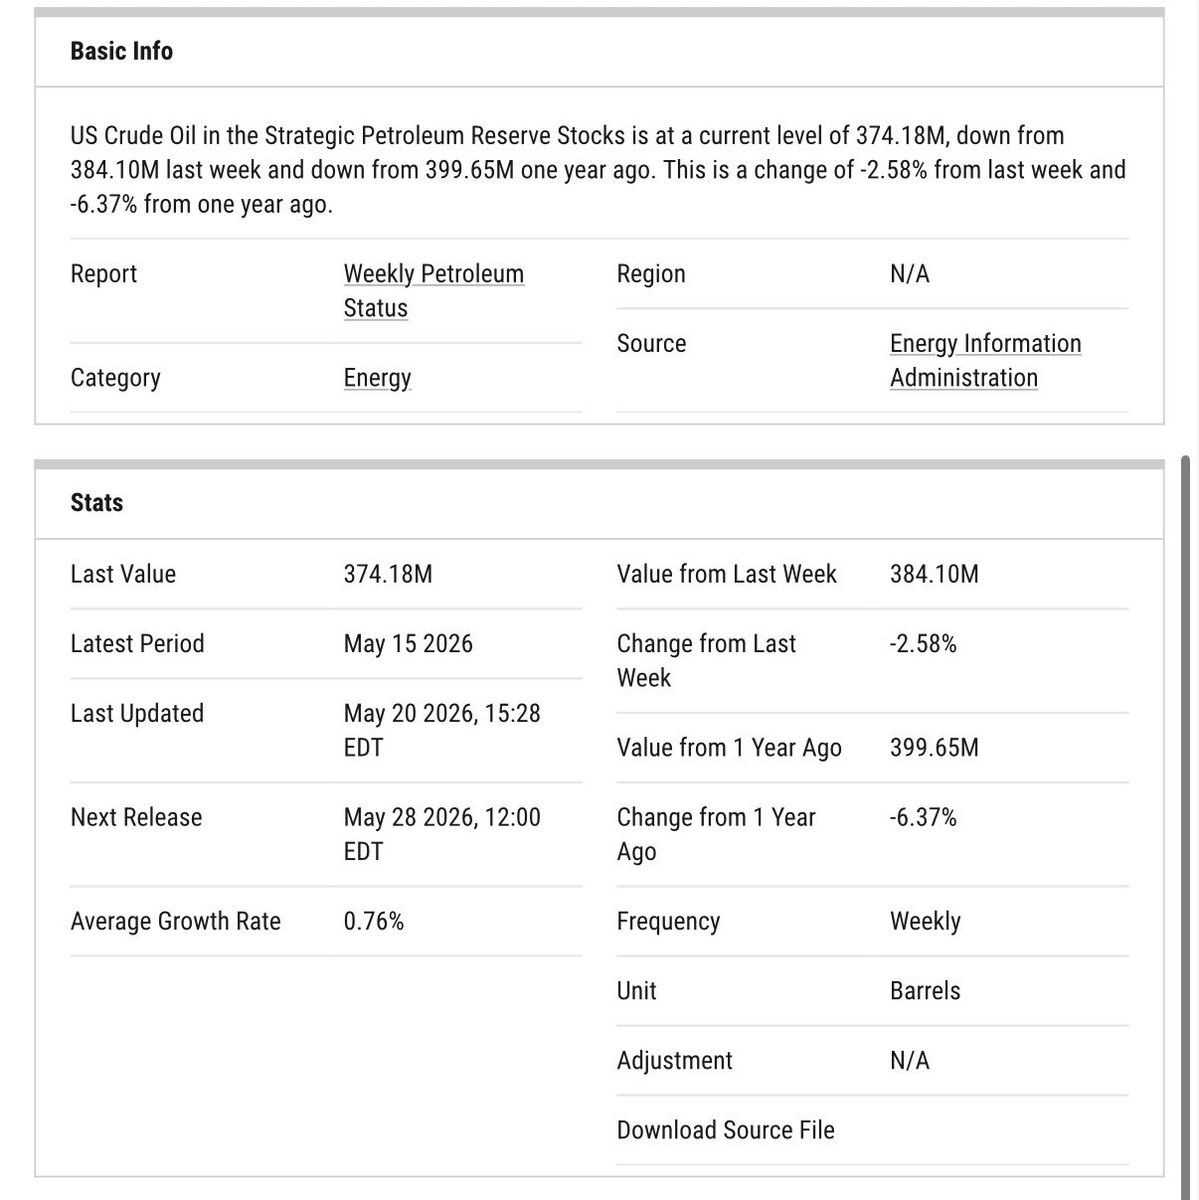
This weeks step down from around 100 is imo an anticipated move of the next release from the SPR on Thursday the 28th. Which in all honesty barely exceeds a SINGLE DAY of us imports. They started releasing from the SPR around mid march and by July the first tranche of 172million barrels will be completed leaving just over 200 million barrels in the reserve. The lowest levels in over 40 YEARS!
• US Crude Oil Production: 13.7 million barrels per day
• Total US Petroleum Consumption: ~20.0 – 20.5 million barrels per day
• Net Imports (what we still need to buy)
~6.5 – 7.0 million barrels per day. No matter how much exploration/extraction is taking place on the homeland there isn’t enough happening at today’s consumption rates.
SPR Math
• Current SPR: ~374 million barrels
• Days of total US consumption the SPR covers: ~18–19 days (no production)
• Days of net imports the SPR covers: ~53–57 days (this would be no import maintain current production)
Bottom Line
Even with record domestic production of 13.7 million bpd, the US still imports a meaningful amount every day about half as much as we produce. The SPR is dangerously low by historical standards and only provides a small buffer if all hell breaks out in the Middle East, and lack of significance in deals make it appear a war is about to drone on.
This country (Iran) was claimed to be decimated by the American president yet they are negotiating with them? Make it make sense please.
Now the Iranian government is not conceding on the strait one bit and I believe if even this administration goes full scorched earth it’s of their (Iran) highest priority to maintain control of that strait by any means necessary. This initial squeeze by them is why they are even negotiating in the first place.