😅 Finally! 🍾
➡️ 6 months of work later, I'm launching my https://t.co/wK6l6vXJe9 project! ❤️
If you're using #Rstats for data analysis, you will very likely enjoy it!
🙏 Thanks so much to the 200+ early adopters!
⏰ Pre-launch price available until the end of the day
I'm launching a new project! 🍾🎉
A course that teaches how to build #dataviz on the web with D3.js & React.
Now that AI is here, those tools are finally accessible to create stunning interactive charts.
A few days left to join https://t.co/pBEsMlGmXp!
I spent 2 years building this.
I left my job to teach programming and dataviz, and now 4 projects are finally live:
1️⃣ https://t.co/wK6l6vYh3H
2️⃣ https://t.co/sCU4ungvzw
3️⃣ https://t.co/HxJb2xaYZx
4️⃣ https://t.co/0B6a1ecgqy
They’re all 50 percent off until Sunday! 😀
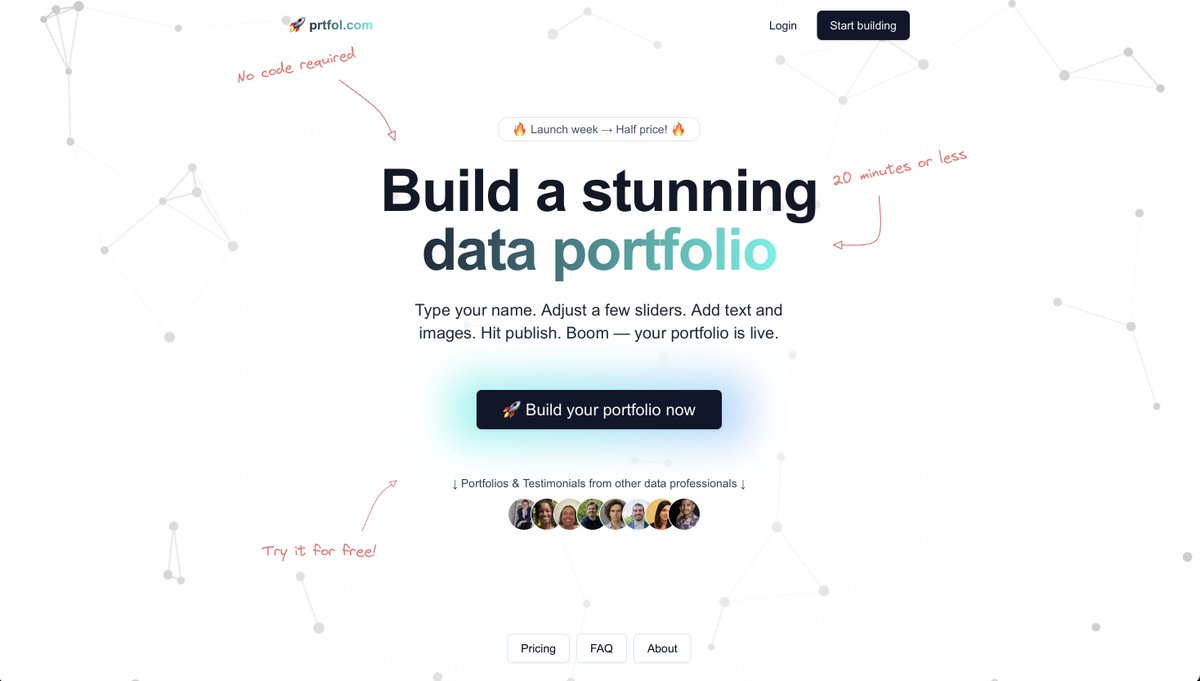
I just released https://t.co/0B6a1ebIB0
➡️ a tool to build a good looking portfolio in a few minutes!
If your work is more or less related with #data, I think you'll like it!
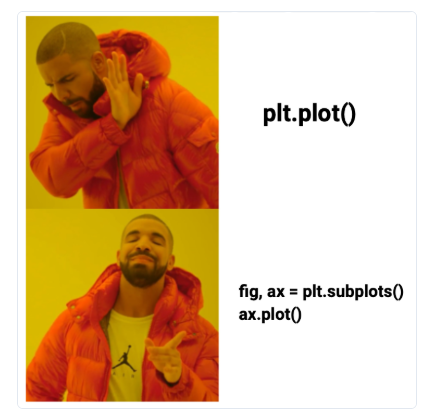
@matplotlib is confusing.
But it gets much better once you understand that only the "Axes" interface is useful.
Get rid of the "Pyplot" interface and you just divided the complexity by 2!
https://t.co/DO4Pdm0pUq
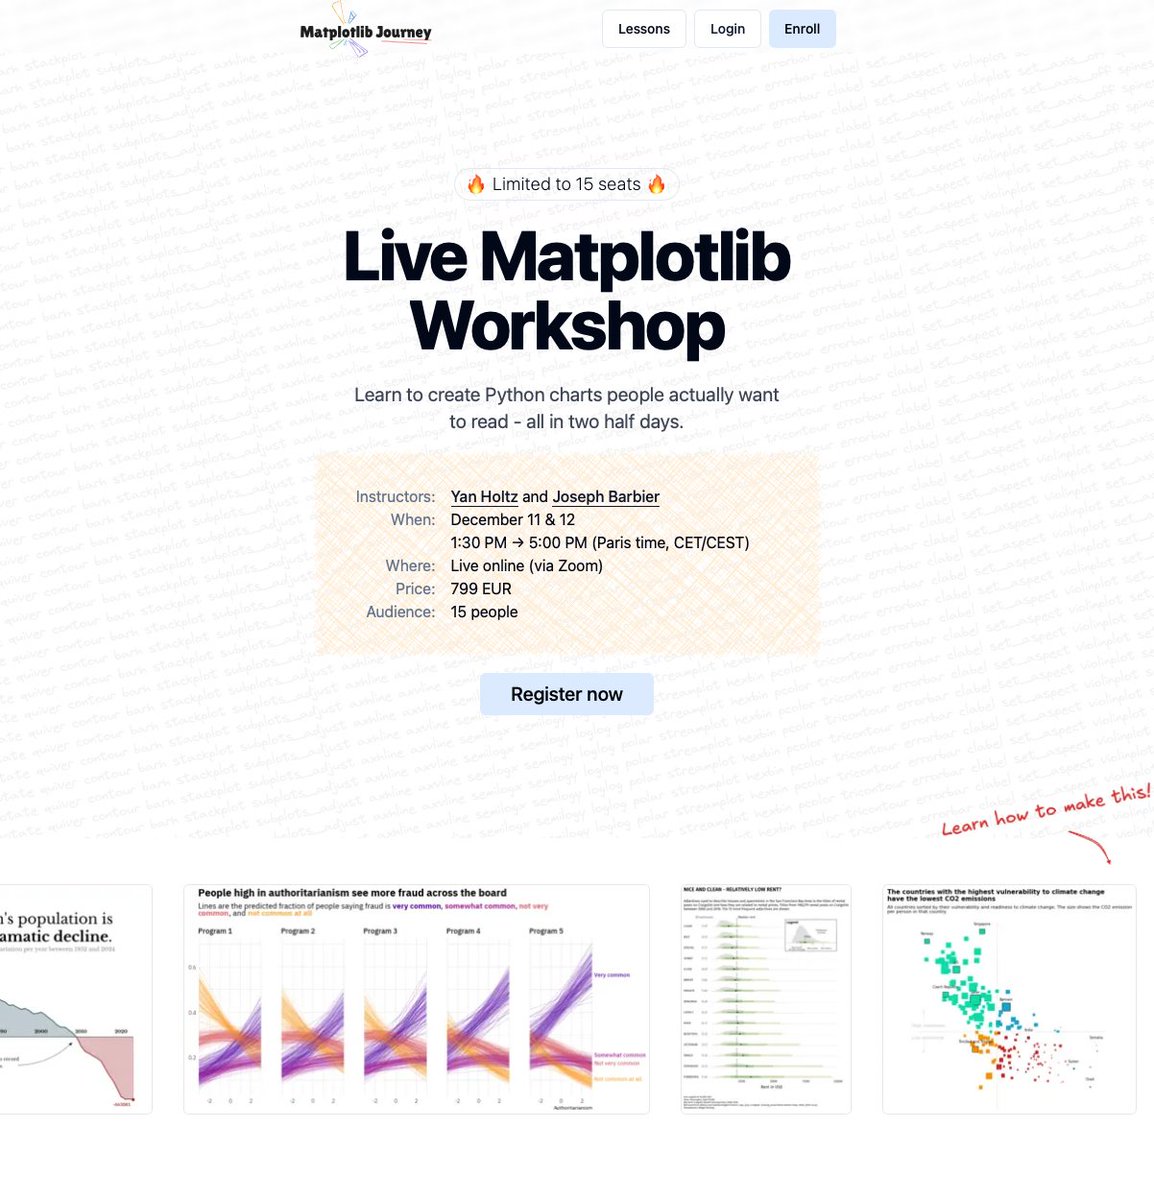
🎉 Want to build better charts with #Python and @matplotlib ?
Join me and @joseph_barbier for a brand new #dataviz workshop!
We’ll spend 2 half-days together, alternating between impactful explanations and hands-on exercises.
Only 15 spots available!
https://t.co/2HytHSWqwm
Want to improve your #dataviz design eye?
➡️ I just released a little game:
You have to spot the better version of a chart and learn the fundamental concepts along the way.
https://t.co/bI1MERgPyf
What's your score!? 😀
@canermaker original pictures are from Diana MacDonald
I then created degraded versions, using my own experience of common design caveats.
Then created the online quiz =)
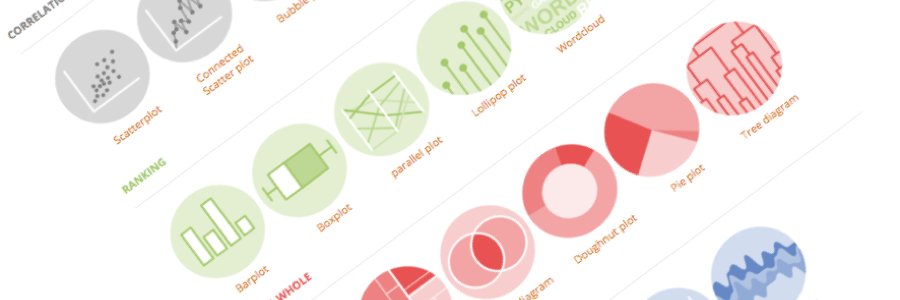
❌ Made a list of the 37 most common #dataviz caveats
- Rank your groups
- what's wrong with boxplots
- Dual Y axes
- overplotting
- misleading error bars
...
➡️ https://t.co/elGnMswssl
I'll use in my https://t.co/sCU4unfXJY and https://t.co/HxJb2xar9Z
Any I should add?
#dataviz is a long, iterative process.
If you want to learn the required steps to create a great graph with R and ggplot2,
we are building something for you with @CedScherer !
https://t.co/HxJb2xar9Z
😀🍾 Big, big news!! 🎉😱
➡️ I'm starting a new #dataviz project with @CedScherer
It's an interactive online course designed to turn you into a ggplot2 dataviz expert!
➡️ https://t.co/HxJb2xar9Z
Pre-launch until Sunday. If you like making charts with R, you'll love it!