Chart of the day:
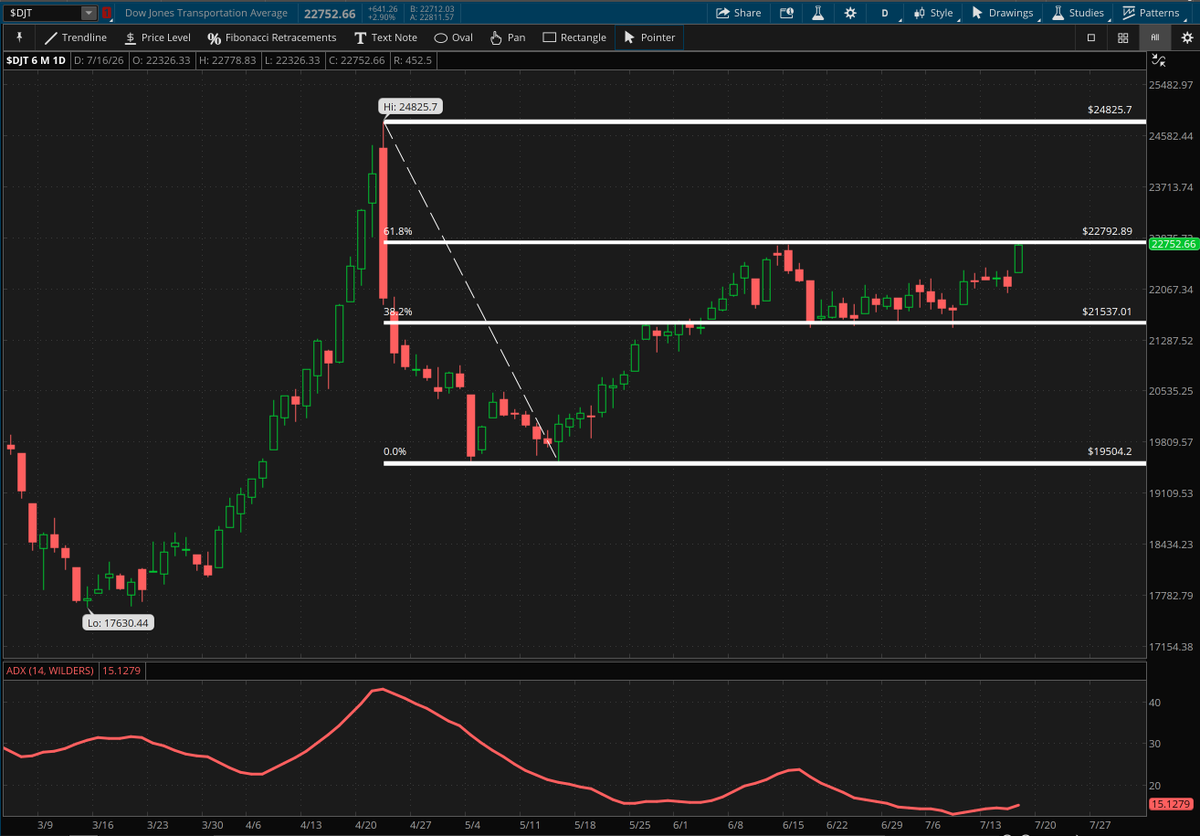
$DJT $DowTransorts have powered their way back up to the 61.8% Fib Retracement (22,793) from all-time highs after significant technical repair.
61.8% is the “Golden Ratio.” This level is widely watched as many institutions and traders react to it. A reclaim of this level is highly bullish, as it signals the primary trend has resumed and the prior correction is coming to a close.
Notice the Average Directional Index (ADX) is ascending off a trough, signaling the market is about to accelerate in a trend direction.
Given the technical formation that exists, this acceleration is likely to the upside if price can confirm with a decisive move (closes or percentage filter) beyond 22,793.
*Not a recommendation
@SchwabNetwork@SchwabTrading
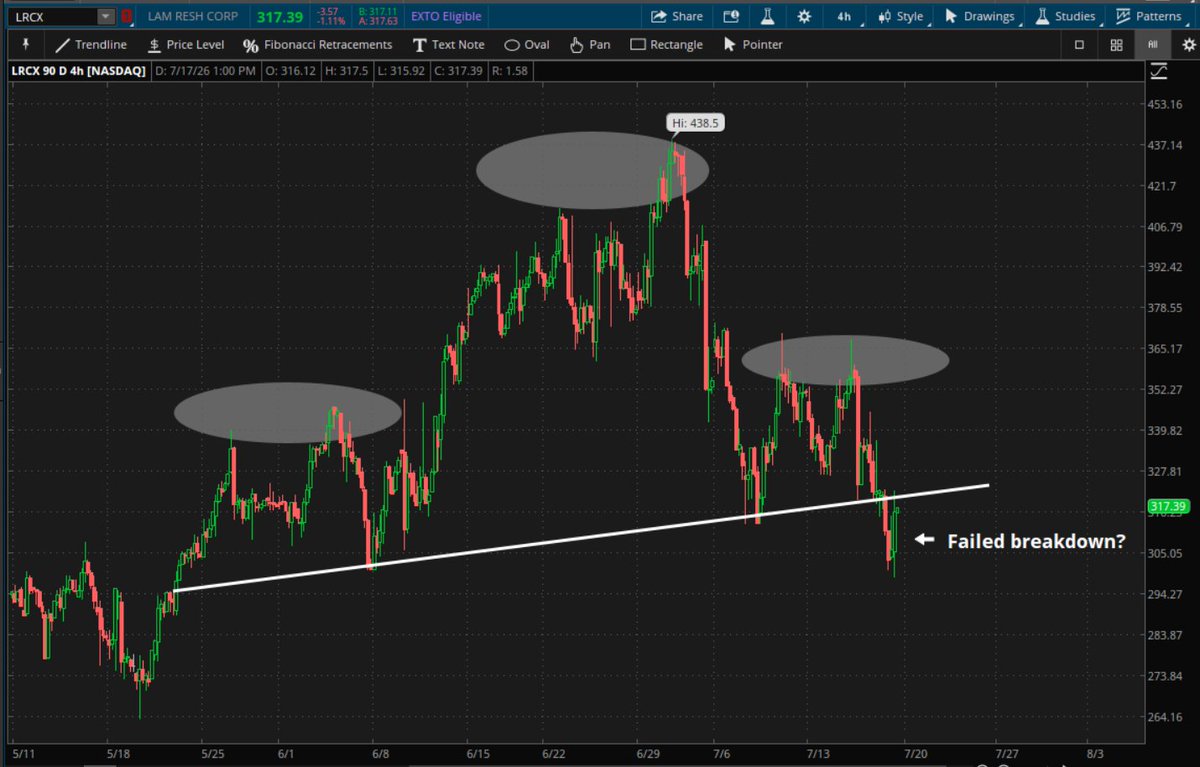
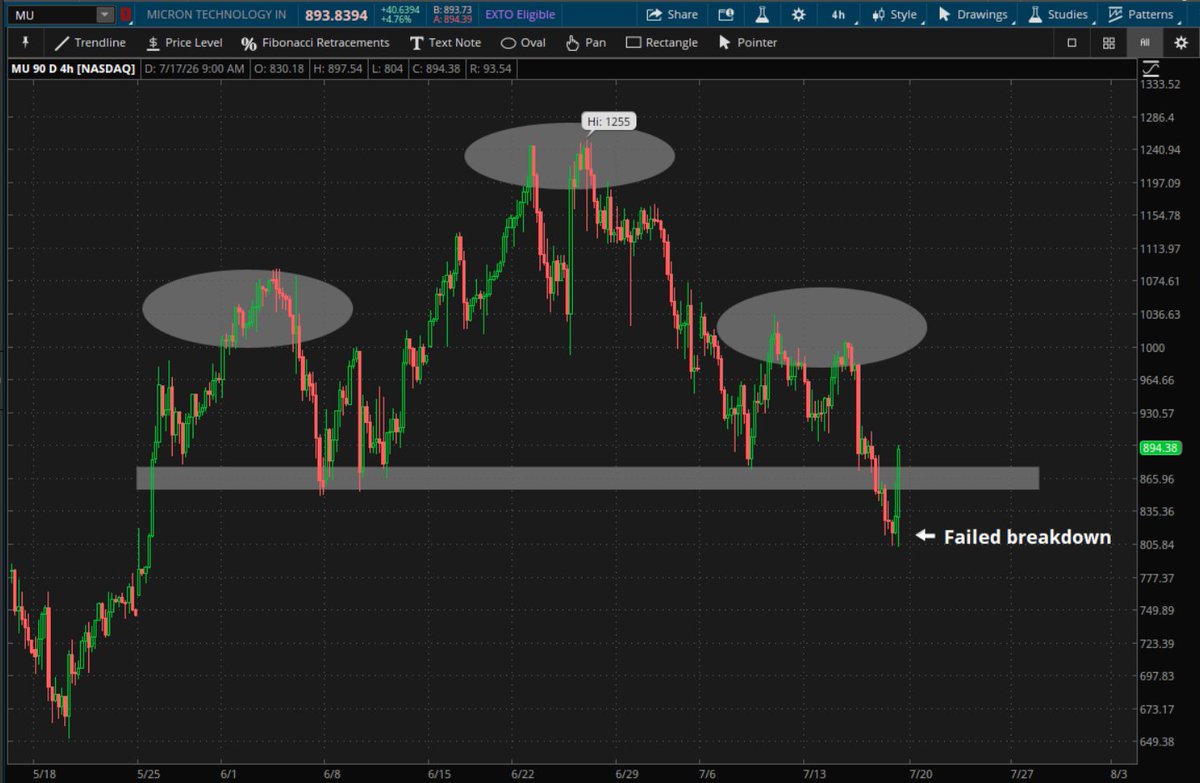
The "failed" moves may be just beginning... $MU was the first to reclaim its polarity zone (old support)
Let's see if the others will follow suit.... $AMD $LRCX $SNDK
*Not a recommendation
@SchwabNetwork@SchwabTrading
What if these Head & Shoulders topping formations fail?
What if they don't break crucial support?
$MU $SNDK $LRCX $AMD
The implications for the $Tech sector could be massive either way....
*Not a recommendation
@SchwabNetwork@SchwabTrading
$NVDA just became a "complex" inverse head & shoulders
Edwards & Magee rules: confirmation exists at a 3% break of neckline resistance
*Not a recommendation
@SchwabNetwork@SchwabTrading
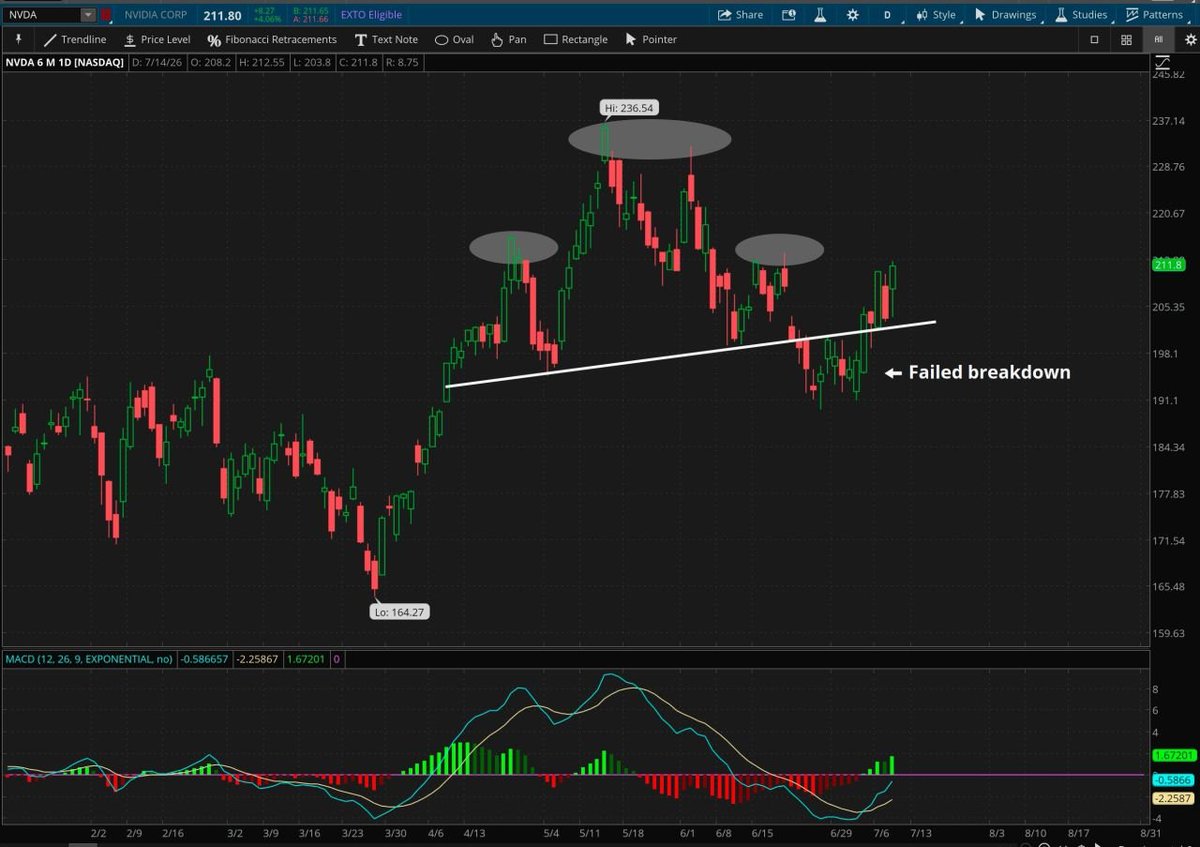
Roughly two weeks ago I shared a daily chart of this head and shoulders breakdown in $NVDA as it was nearing old support turned new resistance (at the time) of its pattern neckline.
I discussed the implications for the broader market if this was indeed a “failed breakdown,” meaning that price had failed to remain beneath old support and re-entered the price formation above $202.
After breaking back above that polarity zone, price has sustained 5 consecutive closes above this level on accelerating bullish momentum, which would give traders confirmation that the bulls are back in control.
As price hovers around its first level of resistance on the daily chart, at the shoulder of the failed formation ~$213, a more interesting development is forming on a shorter time frame.
Zooming into price on the 4-hour chart, we can see that $NVDA is now forming a possible inverted head and shoulders formation with the neckline resistance right around $213.
The depth of this possible formation, from lows to neckline highs is ~$23. This means that if price can break above this crucial short-term resistance, a measured move could place the stock up near former swing highs ~$235, just shy of all-time highs.
Once again, the implications for the broader market could be quite impactful, especially given the fact that $NVDA consumes ~8% weighting in $SPX and an even greater weighting of ~12% in the $NDX.
(Oh and today we may have just seen the first signs to a bullish breakout of the AVWAP pinch 🤫)
*Not a recommendation
@SchwabTrading@SchwabNetwork
$IREN has had a rough 4-6 weeks, but a shift to the weekly chart offers a little perspective. The lows appear to be testing the Anchored VWAP from the first week of trading. On a longer-term view like this the recent action remains consolidation unless it trades below this range.
@SchwabTrading@SchwabNetwork #SchwabCoaching
*not a recommendation
$USD/ $JPY
As price is being compressed in this 2.5 week triangle consolidation, a simultaneous volatility squeeze is taking place.
Periods of low volatility tend to switch to periods of high volatility, and higher volatility tends to accompany decisive breakouts.
The proximity of price to its resistance trendline near the apex would suggest that this currency pair is likely to experience a decisive breakout within the next trading session.
*Not a recommendation
@SchwabNetwork@SchwabTrading@SchwabResearch
$CrudeOil beware of Shortfalls...
A shortfall is when price does not fully reach its support level within the range before breaking out to the upside...
These can signal false or early breakouts
*Not a recommendation
@SchwabNetwork@SchwabTrading
$CrudeOil is stuck in this multi-day range... a measured move from the range (if support breaks) would put $Oil at the 200 DMA ~$75.
*Patterns are not guarantees
*Not a recommendation
@SchwabNetwork@SchwabTrading
$CrudeOil is stuck in this multi-day range... a measured move from the range (if support breaks) would put $Oil at the 200 DMA ~$75.
*Patterns are not guarantees
*Not a recommendation
@SchwabNetwork@SchwabTrading
Chart of the day:
$CrudeOil Notice how price has hit its head on this confluence of resistance for the last 4 trading sessions
Price is continuously being met with supply ~$82
Also note that volume has been declining through these trading sessions, further reiterating that demand has been fading at this polarity zone
*Not a recommendation
@SchwabNetwork@SchwabTrading
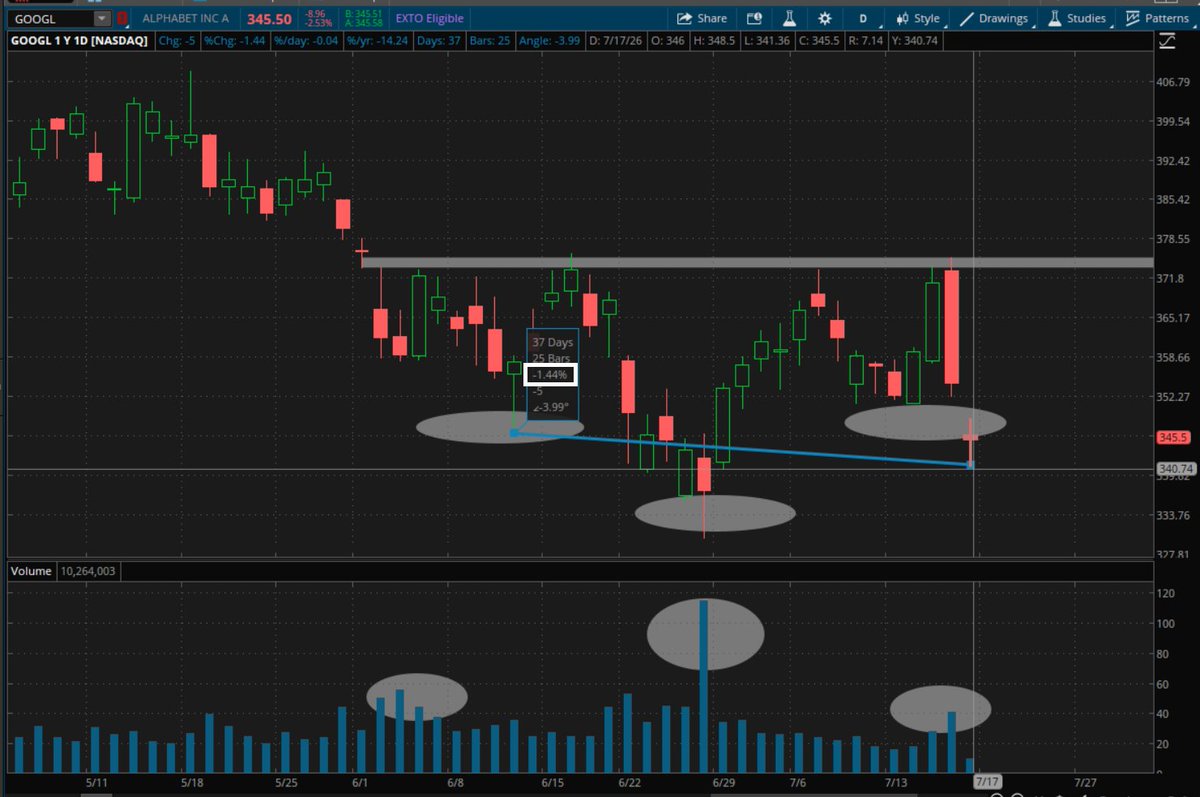
Oof. $GOOGL dropping a big time bearish engulfing pattern as it tests the 50-day moving average, also the neckline of a potential inverted head and shoulders pattern. #notbullish
Chart of the day:
$CrudeOil Notice how price has hit its head on this confluence of resistance for the last 4 trading sessions
Price is continuously being met with supply ~$82
Also note that volume has been declining through these trading sessions, further reiterating that demand has been fading at this polarity zone
*Not a recommendation
@SchwabNetwork@SchwabTrading