Occupancy and leasing have caught up with last year. Rents are now 1.2% below it.
Occupancy held at 94.44% for the week ending Nov 8, 2026, 0.08 percentage points above last year. Leasing stayed at 2.1 leases per property for a fourth straight week, now level with last year.
Net Effective Rent (NER) slipped 0.1% to $1,775, its lowest since mid-August. RevPAU slipped 0.1% to $1,676, 1.1% below last year.
Occupancy and rents are moving in opposite directions in 14 markets, up from 12 last week. In each, occupancy is above last year while rents are below it.
Only 6 of 28 markets posted positive annual rent growth. San Francisco led at 10.2% above last year, and Denver trailed at 5.4% below.
U.S. Multifamily Stats for the week ending Nov 8, 2026:
Occupancy: 94.44%
Annual NER growth: 1.2% below last year
RevPAU: $1,676 (1.1% below last year)
https://t.co/EL63m2gXMc
Key finding #4: The revenue gap ranges from $12.0K to $79.1K a month depending on the market
$79.1K a month. That’s how much scraped data overstates revenue per property in Seattle. In Washington DC, it’s $12.0K.
We measured the gap across 15 named metros. The national average of $32.6K hides how much it moves from one market to the next.
The causes differ too. Seattle leads on concession depth, averaging about $406 per unit per month, compared with about $10 in Washington DC. Austin ranks second at $69.6K for a different reason: scraped data puts occupancy at 93.8% against a true 88.2%, making buildings look 6.3% fuller than they are.
Scraped data flattens these differences into one national view. System of Record data shows the gap market by market.
📖 Read The Revenue Gap Report → https://t.co/FVMg3vcmn9
Occupancy is still a touch above last year. Rents are now 1.0% below it.
Occupancy eased to 94.45% for the week ending Nov 1, 2026, rising in only 3 of 28 markets. Leasing held at 2.1 new leases per property for a fifth straight week, pointing to a seasonal floor.
Net Effective Rent (NER) slipped 0.1% to $1,779 and RevPAU fell 0.2% to $1,681. Both annual comparisons widened, to 1.0% and 0.9% below last year.
Occupancy and rents are moving in opposite directions in 12 markets, the same as last week. In Austin, Denver, Miami, and Phoenix, four of the markets Radix covers, occupancy sits above last year while rents sit below it.
U.S. Multifamily Stats for the week ending Nov 1, 2026:
Occupancy: 94.45%
Annual NER growth: 1.0% below last year
RevPAU: $1,681 (0.9% below last year)
📖 Read the latest report https://t.co/6Bv2Be2eGs
Scraped data makes buildings look 2.9% fuller than they are.
93.7%. That’s the average occupancy scraped data implies across the 1,771 properties we matched. Their System of Record shows 91.1%.
Website availability is a curated snapshot. Properties choose which units to display, so scraped data undercounts true vacancy.
The occupancy gap compounds the rent gap. RevPAU is Net Effective Rent times occupancy, and scraped data reads both too high. Across the 1,338 comparable properties, scraped RevPAU comes to $1,738 against $1,598 from the System of Record, a $140 per unit overstatement (8.7%).
The fullest-looking buildings are the hardest to check. A property that shows no availability online looks full, and scraped data has no way to flag it.
📖 Read The Revenue Gap Report: https://t.co/DOX9xaVHj4
Occupancy moved back above last year this week. Rents fell further behind it.
Occupancy edged up to 94.53% for the week ending Oct 25, 2026, 0.02 percentage points above last year. Leasing held at 2.1 leases per property for a fourth straight week, which suggests demand has found its seasonal floor.
Net Effective Rent (NER) and RevPAU didn't move this week, holding at $1,781 and $1,683. Both annual comparisons still worsened, to 0.8% and 0.7% below last year, on firmer numbers a year ago.
Occupancy and rents are moving in opposite directions in 12 markets, up from 11 last week, including Austin, Denver, Miami, and Phoenix.
Only 7 of 28 markets posted positive annual rent growth, the same count for five straight weeks. San Francisco led at 11.5% above last year, and Denver trailed at 4.6% below.
U.S. Multifamily Stats for the week ending Oct 25, 2026:
Occupancy: 94.53%
Annual NER growth: 0.8% below last year
RevPAU: $1,683 (0.7% below last year)
https://t.co/HmmUWEi0MD
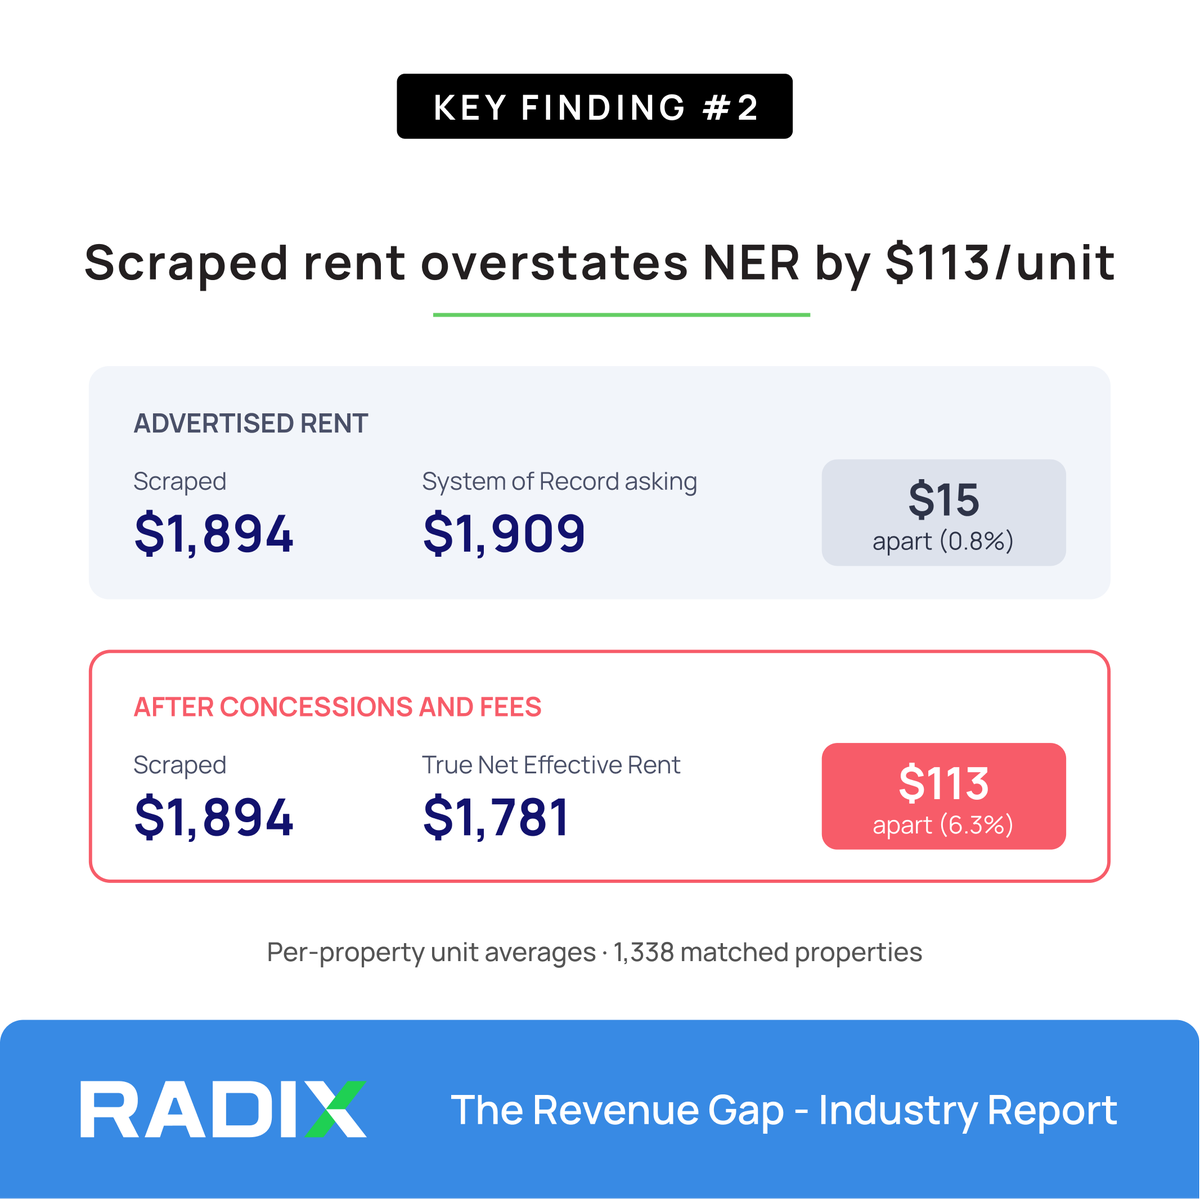
Key finding #2: Scraped rent comes in $113 per unit above true Net Effective Rent
$113 per unit. That’s the gap between scraped rent and true Net Effective Rent across the 1,338 properties we matched.
The advertised rent is close. Scraped rent sits within $15 of System of Record asking rent, a 0.8% difference.
The gap opens with concessions. Websites describe them as a “net effective price,” an “amortized special” or an “option to self-amortize,” with no dollar figure a scraper can subtract or tie to a unit, lease term or move-in date.
System of Record data captures every concession and mandatory fee from the property’s own records. That puts true Net Effective Rent at $1,781 per unit against $1,894 scraped, a 6.3% difference.
Concessions are where pricing decisions happen, and they’re the part scraped data can’t measure.
📖 Read The Revenue Gap Report → https://t.co/FVMg3vcUcH
Leased occupancy moved past last year for the first time this fall. Occupancy held even with last year for a second week.
Occupancy was 94.53% for the week of October 18, and leased occupancy reached 96.75%, 1 basis point above last year. Leasing eased to 2.1 new leases per property.
Net effective rent and RevPAU each rose $1, to $1,779 and $1,682. Annual rent growth improved to 0.5% below last year.
Occupancy and rents are moving in opposite directions in 11 markets for a second week: occupancy above last year, rents below it.
Only 7 of 28 markets posted positive annual rent growth. Boston was among them at 5.3% above last year, while Las Vegas was 4.6% below.
U.S. Multifamily Stats for the week of October 18:
Occupancy: 94.53%
Annual NER growth: 0.5% below last year
RevPAU: $1,682 (0.5% below last year)
https://t.co/b5pOPLu3wL
Key finding #1: Scraped data overstates revenue at 81.3% of matched properties
$32.6K a month. That's the difference in revenue per property between System of Record data and scraped data.
We matched 1,338 multifamily properties on both sides. Over a year, the gap comes to $391K per property.
The bulk of the gap comes from two things scrapers can't see: concessions and true occupancy.
Rent and concessions account for 81%, a $113 per unit difference between advertised rent and true Net Effective Rent. Occupancy accounts for the other 19%, with buildings looking 2.9% fuller online than they actually are.
The result? 81.3% of properties appear stronger in scraped data than they do in their own records.
Scraped data shows what the market advertises. System of Record shows market reality. Download the report to explore the industry's first large-scale
measurement of the Revenue Gap.
📖https://t.co/FVMg3vcmn9
Occupancy matched last year for the first time this fall. Rents are still 0.6% below last year.
Occupancy rose to 94.55% for the week of October 11. Leasing held at 2.2 leases per property for a fourth straight week.
Net effective rent and RevPAU didn’t move this week, holding at $1,778 and $1,681. Annual rent growth still improved to 0.6% below last year, thanks to softer numbers a year ago.
Occupancy and rents are moving in opposite directions in 11 markets, up from 7 two weeks ago. In each, occupancy is above last year while rents are below it.
Only 7 of 28 markets posted positive annual rent growth. San Francisco led at 11.3% above last year, and San Antonio trailed at 6.2% below.
U.S. Multifamily Stats for the week of October 11:
Occupancy: 94.55%
Annual NER growth: 0.6% below last year
RevPAU: $1,681 (0.6% below last year)
https://t.co/C5cvpDyDE2
Occupancy improved in 25 of 28 markets. Rent growth stayed in 7.
For the week of October 4, occupancy rose 7 basis points to 94.54 percent, now within 8 basis points of last year. Leasing held at 2.2 per property for a third straight week.
Net effective rent rose to $1,780, with annual NER growth holding at 1.0 percent below last year after four straight weeks of narrowing. RevPAU rose to $1,683, its annual gap improving to 1.1 percent on the occupancy gain.
The spread is the story. Only 7 of 28 markets posted positive annual rent growth, unchanged on the week, across a 16.7-point range from 10.5 percent above last year in San Francisco to 6.2 percent below in San Antonio and Tampa. Nine markets now carry occupancy above last year while rents fall.
U.S. Multifamily Stats for the week of October 4:
Occupancy: 94.54 percent
Annual NER growth: 1.0 percent below last year
RevPAU: $1,683 (1.1 percent below last year)
📖 Read the latest report: https://t.co/Az62AJh2pl
Demand has found its footing. Pricing is sending mixed signals.
For the week of September 27, occupancy eased to 94.48 percent, within 13 basis points of last year. Leasing held at 2.2 per property, with the annual gap unchanged at 0.4 for a second straight week.
Net effective rent slipped 0.2 percent on the week to $1,774, even as annual NER growth improved to 1.0 percent below last year, a fourth straight week of narrowing. That improvement is coming from an easier comparison base, not fresh pricing strength. RevPAU eased to $1,676.
The sharper signal sits under the national line. Of the 28 markets reporting rent data, only 7 posted positive annual rent growth, down from 10 a week ago. The spread ran 17.4 points, from 11.1 percent above last year in San Francisco to 6.3 percent below in Tampa.
U.S. Multifamily Stats for the week of September 27:
Occupancy: 94.48 percent
Annual NER growth: 1.0 percent below last year
RevPAU: $1,676 (1.2 percent below last year)
📖 Read the latest report: https://t.co/8FU5THxc47
Rents improved for a third straight week, and the market split wider.
For the week of September 20, occupancy held at 94.53 percent, within 10 basis points of last year. Leasing settled at 2.2 per property, unchanged on the week.
Net effective rent rose to $1,775, with annual NER growth improving to 1.1 percent below last year, a third straight week of narrowing. RevPAU rose to $1,678 (1.2 percent below last year).
The national number hides most of it. Across the 28 markets we track, annual rent growth spanned 18.2 points, from 10.6 percent above last year in San Francisco to 7.6 percent below in San Antonio. Ten were positive, 18 negative. Seven markets carried occupancy above last year while rents fell, which points to supply absorption rather than weakening demand.
U.S. Multifamily Stats for the week of September 20:
Occupancy: 94.53 percent
Annual NER growth: 1.1 percent below last year
RevPAU: $1,678 (1.2 percent below last year)
https://t.co/IyQNak9zb4
The Revenue Gap Report: A multifamily property's value is only as accurate as the data behind it.
In our new Revenue Gap Report, one Seattle-area property illustrates why.
Scraped data suggested a nearly full building generating more than $1.1M in monthly revenue. System of Record data showed a different reality: lower occupancy, substantial concessions, and approximately $338K less revenue per month.
Capitalized at a standard NOI margin and cap rate, that's the difference between a $121.1M valuation and an $84.6M valuation.
The takeaway is bigger than one asset:
Nobody made a bad decision. They made a decision using incomplete data.
Over the coming weeks, we'll share the report's five key findings and what they mean for operators, investors, and the future of multifamily market intelligence.
📖 Read The Revenue Gap Report → [LINK]
https://t.co/FVMg3vcmn9
Occupancy is holding level with last year, and rents closed their gap for a second straight week.
For the week of September 13, occupancy was 94.56 percent, within 9 basis points of last year. Leasing eased seasonally to 2.3 per property, against 2.5 a year ago.
Net effective rent rose to $1,781, with annual NER growth improving to 1.2 percent below last year from 1.5 percent. RevPAU held at $1,684, narrowing to 1.3 percent from 1.6 percent.
The national average hides most of the story. Across the 28 markets we track, annual rent growth spanned 16.5 points, from 9.6 percent above last year in San Francisco to 6.9 percent below in San Antonio. Phoenix shows occupancy up 72 basis points with rent down 5.3 percent. Boston is up 5.1 percent on rent with leasing running ahead of last year.
U.S. Multifamily Stats for the week of September 13:
Occupancy: 94.56 percent
Annual NER growth: 1.2 percent below last year
RevPAU: $1,684 (1.3 percent below last year)
📖 Read the latest report: https://t.co/C2RDYFAKx5
Demand held level with last year for a second straight week, and the rent gap kept closing.
For the week of September 6, properties averaged 2.5 new leases signed, down 0.2 on the seasonal slowdown but matching last year's pace for a second week. Occupancy edged up to 94.54 percent, within 11 basis points of last year, from 16 the week before.
Net effective rent held at $1,773, with annual NER growth improving to 1.5 percent below last year from 1.7 percent. RevPAU held at $1,676, its annual gap narrowing to 1.6 percent from 1.9 percent.
Detroit was strong on both sides, pairing 4.5 percent annual rent growth with 96.09 percent occupancy. Las Vegas ran behind on both, 5.7 percent below on rent with occupancy off 23 basis points.
U.S. Multifamily Stats for the week of September 6:
Occupancy: 94.54 percent
Annual NER growth: 1.5 percent below last year
RevPAU: $1,676 (1.6 percent below last year)
📖 Read the latest report: https://t.co/m3r7OTVD7l
Demand has fully recovered to last year's pace, and occupancy is close behind.
For the week of August 30, properties averaged 2.7 new leases signed, matching the year-ago pace exactly after running below it much of the year. Occupancy held steady at 94.53 percent, within 16 basis points of last year, and leased occupancy at 97.09 percent, within 17. Both gaps have narrowed sharply over the past two weeks.
Net effective rent rose 0.2 percent to $1,773, with annual NER growth at 1.7 percent below last year. RevPAU rose to $1,676 (1.9 percent below last year). Pricing is the last piece still to turn.
The coastal-to-Sun Belt split held: San Francisco led at 9.1 percent above last year on NER, while Denver, Phoenix, and Las Vegas all sat between 4.6 and 5.7 percent below.
U.S. Multifamily Stats for the week of August 30:
Occupancy: 94.53 percent
Annual NER growth: 1.7 percent below last year
RevPAU: $1,676 (1.9 percent below last year)
📖 Read the latest report: https://t.co/j6ykmWep5B
Leasing has nearly pulled even with last year's pace.
For the week of August 23, properties averaged 2.6 new leases signed, matching the prior week and narrowing the annual gap to just 0.2 leases per property. Occupancy stabilized at 94.44 percent, up 10 basis points on the week after the prior week's decline, though still 26 basis points below a year ago.
Net effective rent edged up 0.1 percent to $1,769, with annual NER growth at 1.7 percent below last year. RevPAU rose to $1,670 (2.0 percent below last year). Demand is carrying the market while pricing stays flat.
The coastal-to-Sun Belt split held: San Francisco led at 10.7 percent above last year on NER, while Dallas and Denver both sat roughly 6 percent below.
U.S. Multifamily Stats for the week of August 23:
Occupancy: 94.44 percent
Annual NER growth: 1.7 percent below last year
RevPAU: $1,670 (2.0 percent below last year)
https://t.co/JRc7ywXkNT
Leasing hit its strongest pace of the summer while occupancy softened broadly. For the week of August 16, that split reads as seasonal turnover.
Occupancy fell 46 basis points to 94.36%, back below last year after four weeks above, even as leasing rose to 2.6 per property. Pricing held, with NER at $1,767 (1.6% below last year), while RevPAU eased to $1,668 (1.9% below last year). Detroit led at 4.5% above last year, Denver stayed pressured at 5.6% below.
U.S. Multifamily Stats for the week of August 16:
📊 Occupancy: 94.36% (down 46 basis points on the week)
📉 Annual NER growth: 1.6% below last year
💰 RevPAU: $1,668 (1.9% below last year)
🏠 Leases per week: 2.6 (strongest of the summer)
📖Read the latest report: https://t.co/JoCFRCcpjc
🎧 Listen to the podcast: https://t.co/CqfzJlcmFT
Leasing is carrying the momentum while pricing consolidates. That's the story for the week of August 9.
New leasing reached its firmest pace of the stretch at 2.4 leases per property, a second straight weekly gain and a genuine demand signal as peak summer winds down. Occupancy held at 94.83%, still just ahead of last year for a fourth straight week. Pricing eased slightly on the annual comparison, with NER at $1,772 widening to 1.6% below last year and RevPAU at $1,680 at 1.5% below.
The coastal-to-Sun Belt split held: Boston led qualifying markets with NER up 5.1% year over year on tight high-end supply, while Phoenix stayed pressured at 5.6% below last year, occupancy climbing nearly a full point as the Southwest keeps absorbing new supply.
U.S. Multifamily Stats for the week of August 9:
📊 Occupancy: 94.83% (up 9 bps year over year)
📉 Annual NER growth: 1.6% below last year
💰 RevPAU: $1,680 (1.5% below last year)
🏠 Leases per week: 2.4 (firmest of the stretch)
📖 Read the latest report: https://t.co/dYh3feQYg9