Markets through charts, data & positioning | AI + Analytics by profession | Hobby project: Building a Market Intelligence Platform | Not SEBI Registered
Everyone wants leading indicators.
But sometimes the bigger edge comes from learning how to read lagging data better than everyone else.
Participant OI comes after market close. By definition, it is late.
But it still tells you something powerful:
What did Retail do?
What did FII+PRO do?
Who added risk?
Who bought protection?
Who is getting trapped in a crowded view?
And is the divergence getting stronger day after day?
That last part matters.
A one-day OI move can be noise.
A divergence that keeps strengthening across Futures, Calls, Puts and cash for several sessions is a very different signal.
The market can still reverse the next morning. News can change everything.
But at least you are not starting the day blind.
You are starting with a map of how different participants are positioned, where the stress is building, and which side is becoming more committed.
That may not predict the future.
But in trading, even a slightly better read of positioning can be the difference between reacting to the market and being prepared for it.
Data may be lagging. Interpretation doesn’t have to be.
Yes, I have an RBI Retail Direct Gilt account.
For me, the use case is simple:
RBI Direct.. buy a specific G-Sec and hold it toward maturity.
GILT5YBEES..keep a rolling ~5-year G-Sec allocation in my demat without selecting, replacing or managing individual bonds.
The ETF is mainly about simplicity + easy rebalancing, not about getting a better yield than RBI Direct.
Most investors know NIFTYBEES.
But have you heard of GILT5YBEES? 👀
It is a simple way to get passive exposure to Government of India bonds through your demat account.
GILT5YBEES tracks the Nifty 5-Year Benchmark G-Sec Index.
In simple terms:
→ It gives exposure to the most liquid ~5-year Government of India bond
→ You don’t need to select individual G-Secs yourself
→ The index periodically shifts to the relevant benchmark security
→ You can buy and sell it on the exchange just like any other ETF
→ Credit risk is extremely low because the underlying borrower is the Government of India
Think of it as something like NIFTYBEES for the 5-year Government bond market.
But there is an important catch.
GILT5YBEES is not risk-free.
When bond yields rise, its price can fall.
When bond yields fall, its price can rise, in addition to the underlying bond carry.
So even though the credit risk is low, there is still interest-rate / duration risk.
And taxation is important too 👇
For units bought now, gains are taxed at your applicable income-tax slab rate irrespective of how long you hold them.
So unlike equity ETFs, simply holding GILT5YBEES for the long term does not give you a special LTCG tax rate.
That makes it interesting mainly as a passive fixed-income allocation tool, not just because it is an ETF.
For investors building portfolios across:
Equity + Gold + Bonds, this is one instrument worth understanding.
#bonds #gilt #etf
Interesting way to play India's IPO ecosystem without chasing individual IPOs 👀
There is a BSE Select IPO Index which tracks a diversified basket of relatively recent IPOs / demerged companies.
A few things about its construction:
• Stock needs at least 3 months of listing history
• Market-cap + liquidity filters
• Max 5% weight per stock
• Rebalanced quarterly
• Companies eventually age out of the index
And now there are 2 ETFs tracking it:
🔹 SELECTIPO – Mirae Asset BSE Select IPO ETF - has better liquidity
🔹 MOIPO – Motilal Oswal BSE Select IPO ETF - currently liquidity is less so use limit orders to buy / sell
So instead of trying to guess which IPO will become the next big winner, one can own the post-IPO basket itself.
#ipo
#bse #nse #stockmarket
NIFTY has now closed red for 8 straight weeks.
Last time a similar streak showed up on the weekly chart was in Q1 2001.
Rare setups like this don’t guarantee an immediate bounce, but they do signal persistent market weakness.
Is selling pressure still building, or starting to exhaust?
#NIFTY #Nifty50 #StockMarket #Markets
Where is pressure building in Nifty, and where is it easing? 👇
🟢 Buying support is developing around 23,000–23,100.
Put positions increased while premiums fell, consistent with more traders selling downside protection.
What to watch: whether this zone holds on a dip. A sustained break below it would weaken the support argument.
🟢 Call positions are unwinding around 23,200–23,400.
That suggests some overhead pressure is easing. It could help a recovery, but price still needs to move through these levels.
🟠 23,500 remains an important hurdle.
Call positions are increasing here across multiple expiries. Watch whether rallies stall around this level or manage to hold above it.
🟠 The broader picture is improving only slightly.
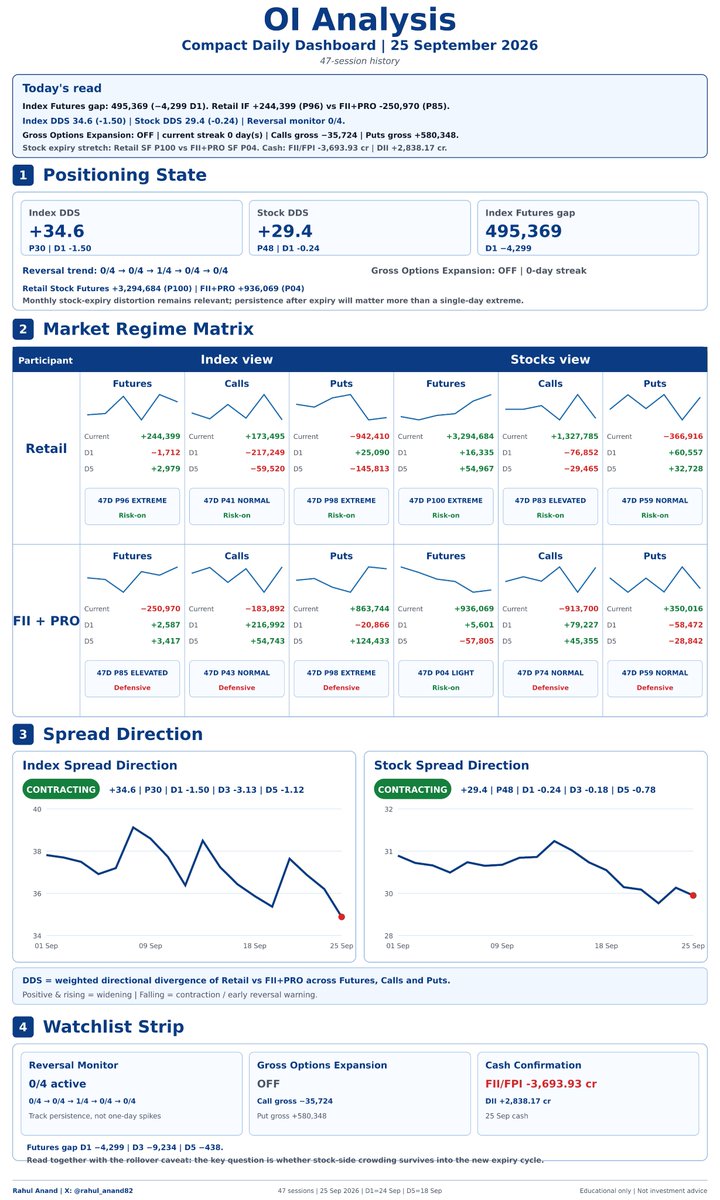
FII + Pro net index call shorts reduced by 2.17 lakh contracts, but their index futures remain net short by 2.51 lakh contracts. Foreign investors also sold ₹3,694 crore in cash equities.
My takeaway:
• Watch for dips holding around 23,000–23,100.
• A move through 23,200–23,400 would strengthen the recovery case.
• Near 23,500, reassess before chasing.
• Below 23,000, reassess bullish bets.
Some pressure is easing. Enough remains to keep bets measured.
Based on NSE data for 25 Sep. OI shows positioning, not guaranteed price direction.
F&O Smart Money Dashboard | 25 Sep
Sometimes the most useful signal is not what changed, but what didn’t.
The market is still carrying unusually stretched positions as we head into monthly expiry.
Today there was some easing, but not enough to say the setup has reset.
So I’m not reading this as bullish or bearish yet. I’m reading it as:
Pressure is still there.
Expiry may decide where it gets released.
What happens after the rollover will probably be more important than what happens today.
Educational tracking only.
F&O Smart Money Dashboard | 25 Sep
Sometimes the most useful signal is not what changed, but what didn’t.
The market is still carrying unusually stretched positions as we head into monthly expiry.
Today there was some easing, but not enough to say the setup has reset.
So I’m not reading this as bullish or bearish yet. I’m reading it as:
Pressure is still there.
Expiry may decide where it gets released.
What happens after the rollover will probably be more important than what happens today.
Educational tracking only.
F&O Smart Money Dashboard | 25 Sep
Sometimes the most useful signal is not what changed, but what didn’t.
The market is still carrying unusually stretched positions as we head into monthly expiry.
Today there was some easing, but not enough to say the setup has reset.
So I’m not reading this as bullish or bearish yet. I’m reading it as:
Pressure is still there.
Expiry may decide where it gets released.
What happens after the rollover will probably be more important than what happens today.
Educational tracking only.
F&O Smart Money Dashboard | 25 Sep
Sometimes the most useful signal is not what changed, but what didn’t.
The market is still carrying unusually stretched positions as we head into monthly expiry.
Today there was some easing, but not enough to say the setup has reset.
So I’m not reading this as bullish or bearish yet. I’m reading it as:
Pressure is still there.
Expiry may decide where it gets released.
What happens after the rollover will probably be more important than what happens today.
Educational tracking only.
F&O Smart Money Dashboard | 25 Sep
Sometimes the most useful signal is not what changed, but what didn’t.
The market is still carrying unusually stretched positions as we head into monthly expiry.
Today there was some easing, but not enough to say the setup has reset.
So I’m not reading this as bullish or bearish yet. I’m reading it as:
Pressure is still there.
Expiry may decide where it gets released.
What happens after the rollover will probably be more important than what happens today.
Educational tracking only.
F&O Smart Money Dashboard | 25 Sep
Sometimes the most useful signal is not what changed, but what didn’t.
The market is still carrying unusually stretched positions as we head into monthly expiry.
Today there was some easing, but not enough to say the setup has reset.
So I’m not reading this as bullish or bearish yet. I’m reading it as:
Pressure is still there.
Expiry may decide where it gets released.
What happens after the rollover will probably be more important than what happens today.
Educational tracking only.
F&O Smart Money Dashboard | 25 Sep
Sometimes the most useful signal is not what changed, but what didn’t.
The market is still carrying unusually stretched positions as we head into monthly expiry.
Today there was some easing, but not enough to say the setup has reset.
So I’m not reading this as bullish or bearish yet. I’m reading it as:
Pressure is still there.
Expiry may decide where it gets released.
What happens after the rollover will probably be more important than what happens today.
Educational tracking only.
F&O Smart Money Dashboard | 25 Sep
Sometimes the most useful signal is not what changed, but what didn’t.
The market is still carrying unusually stretched positions as we head into monthly expiry.
Today there was some easing, but not enough to say the setup has reset.
So I’m not reading this as bullish or bearish yet. I’m reading it as:
Pressure is still there.
Expiry may decide where it gets released.
What happens after the rollover will probably be more important than what happens today.
Educational tracking only.
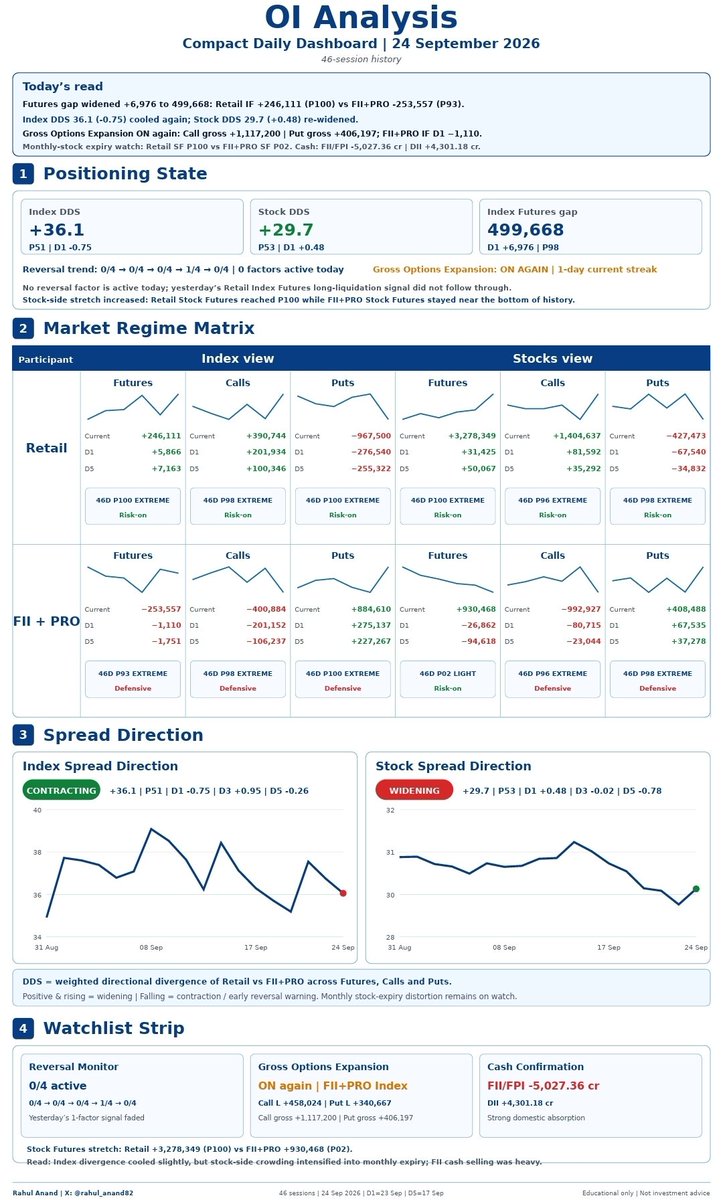
F&O Smart Money Dashboard | 24 Sep
The stock-side imbalance just became even more extreme.
• Retail Stock Futures: +3.28m | P100
• FII+PRO Stock Futures: +0.93m | P02
At the Index level:
• Retail Index Futures: P100
• FII+PRO Index Futures: P93 short
• Futures gap: 499,668, up another 6,976
FII+PRO also expanded the Index-options book again:
• Call gross OI: +1.12m
• Put gross OI: +406k
Cash added another layer:
• FII/FPI: −₹5,027 cr
• DII: +₹4,301 cr
With monthly stock expiry only a few sessions away, the question is getting interesting:
Is this just rollover distortion… or is the stock side becoming crowded enough for a sharp expiry move?
Educational tracking only.
F&O Smart Money Dashboard | 24 Sep
The stock-side imbalance just became even more extreme.
• Retail Stock Futures: +3.28m | P100
• FII+PRO Stock Futures: +0.93m | P02
At the Index level:
• Retail Index Futures: P100
• FII+PRO Index Futures: P93 short
• Futures gap: 499,668, up another 6,976
FII+PRO also expanded the Index-options book again:
• Call gross OI: +1.12m
• Put gross OI: +406k
Cash added another layer:
• FII/FPI: −₹5,027 cr
• DII: +₹4,301 cr
With monthly stock expiry only a few sessions away, the question is getting interesting:
Is this just rollover distortion… or is the stock side becoming crowded enough for a sharp expiry move?
Educational tracking only.
F&O Smart Money Dashboard | 24 Sep
The stock-side imbalance just became even more extreme.
• Retail Stock Futures: +3.28m | P100
• FII+PRO Stock Futures: +0.93m | P02
At the Index level:
• Retail Index Futures: P100
• FII+PRO Index Futures: P93 short
• Futures gap: 499,668, up another 6,976
FII+PRO also expanded the Index-options book again:
• Call gross OI: +1.12m
• Put gross OI: +406k
Cash added another layer:
• FII/FPI: −₹5,027 cr
• DII: +₹4,301 cr
With monthly stock expiry only a few sessions away, the question is getting interesting:
Is this just rollover distortion… or is the stock side becoming crowded enough for a sharp expiry move?
Educational tracking only.
F&O Smart Money Dashboard | 24 Sep
The stock-side imbalance just became even more extreme.
• Retail Stock Futures: +3.28m | P100
• FII+PRO Stock Futures: +0.93m | P02
At the Index level:
• Retail Index Futures: P100
• FII+PRO Index Futures: P93 short
• Futures gap: 499,668, up another 6,976
FII+PRO also expanded the Index-options book again:
• Call gross OI: +1.12m
• Put gross OI: +406k
Cash added another layer:
• FII/FPI: −₹5,027 cr
• DII: +₹4,301 cr
With monthly stock expiry only a few sessions away, the question is getting interesting:
Is this just rollover distortion… or is the stock side becoming crowded enough for a sharp expiry move?
Educational tracking only.
F&O Smart Money Dashboard | 24 Sep
The stock-side imbalance just became even more extreme.
• Retail Stock Futures: +3.28m | P100
• FII+PRO Stock Futures: +0.93m | P02
At the Index level:
• Retail Index Futures: P100
• FII+PRO Index Futures: P93 short
• Futures gap: 499,668, up another 6,976
FII+PRO also expanded the Index-options book again:
• Call gross OI: +1.12m
• Put gross OI: +406k
Cash added another layer:
• FII/FPI: −₹5,027 cr
• DII: +₹4,301 cr
With monthly stock expiry only a few sessions away, the question is getting interesting:
Is this just rollover distortion… or is the stock side becoming crowded enough for a sharp expiry move?
Educational tracking only.