Our software tool BiofilmQ for quantitative image analysis of microbial communities is now online:
We wanted to create a tool for any community, any size, any image type, any analysis. I think BiofilmQ comes close to this aim.
https://t.co/8WG8a8TjsZ
Very happy to see that Eric, Hannah and all the others involved did a great job in finalizing #BiofilmQ! Check it out and use it to quantify your bacterial biofilms: https://t.co/hiFvaQgZho
Our #BiofilmQ software tool for biofilm image analysis is now available. It works for any spatially structured microbial community, enabling space-time analysis and biofilm phenotyping. Plenty of video tutorials + detailed documentation are available. Hopefully a useful resource!
@alexpersat You can just run "createDemograph(gcf)". It should give you the requested figure. You have to be in the analysis-tab in the gui to run that command. It will use the current demograph settings.
@alexpersat You can check the file "createDemograph.m". The actual 2D image is returned in line 89 by the function "compileData()". But it might be easier if you save the image from the Matlab figure.
@alexpersat The data you are interested in is stored in the fields "MedialAxisIntensity_chX" and "StalkIntensity_chX", at "BacStalk_data.frames(frame_id).cells.Stats".
@alexpersat Glad, you like it! You are right, there is actually the wrong command for that in the documentation. Please use "BacStalk_data = getUIData(gcf)" to communicate with the user interface. To set data you can use the command "setUIData(gcf, BacStalk_data)".
@alexpersat The obtained "BacStalk_data"-structure is quite organized and includes cell data, program settings and handles to all figure elements. If you have further questions let me know.
Thanks so much for the #vaam2019 poster prize! And many thanks to all that stopped by and gave input on how to make our (@RaimoHartmann@ThanbichlerLab@knutdrescher) software better! Here to find it: https://t.co/HTg78n4SGS & https://t.co/bNG4MUQ4i6.
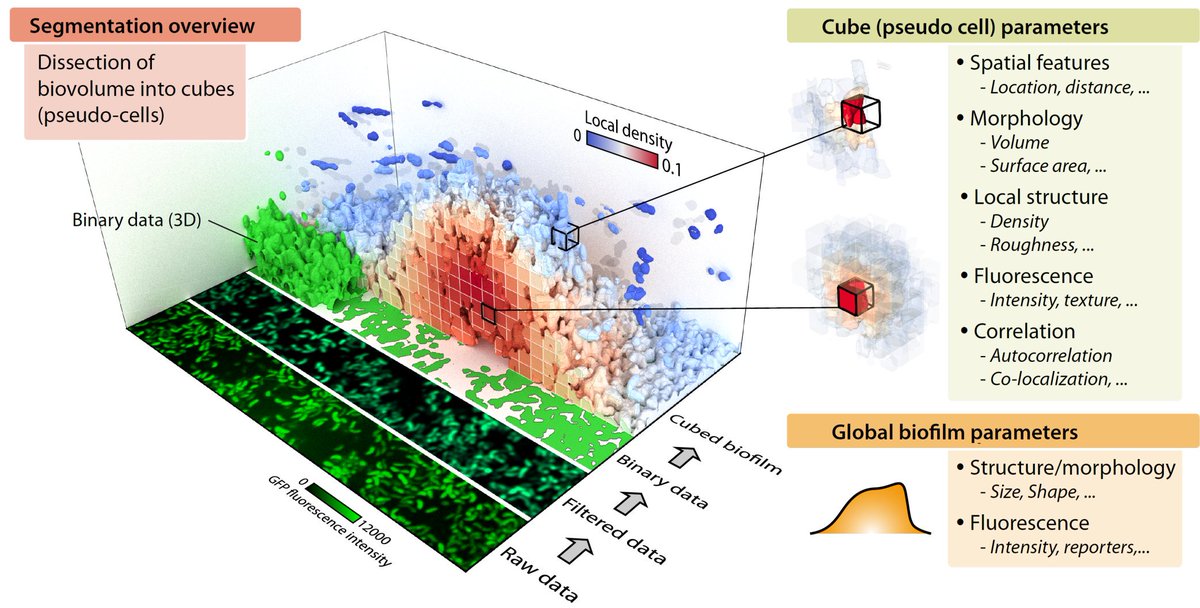
@wildflowerross@Dr_Lori_Burrows@knutdrescher No, this is classical image processing. If you look closely you can see that the biofilms are dissected into little cubes (i.e. pseudo-cells) which are tracked over time. This approach is less accurate but does not require single cell resolution and works for any time series.
Just returned from an exciting week at Dartmouth College were I was giving a one-week training about quantifying bacterial biofilms with our new analysis and visualization methods which we developed together in Knut Drescher's lab (@knutdrescher) #BiofilmQ.
Great talk by Carolina Wählby about deep learning assisted cancer detection in pathology! #I2K#EMBLImageJ Carolinas PhD thesis inspired me to learn digital image cytometry in those days when @CellProfiler was not available, yet!
Fantastic talk by Carolina Wählby on application of deep learning to detect cancer in pathology images. Works great! Using amongst others @CellProfiler#I2K#EMBLImageJ
@karishmabisht05@knutdrescher Single cells tracking inside 3d biofilms is possible with our techniques, but the lineage trees are not 100% perfect for big ones, yet. Nevertheless, you can already determine local growth rates very accurately.
I'm really excited about the work I got to share at @OpenVisConf this year, my talk about using #MachineLearning for #Visualization is online: https://t.co/FxTOlfzn0L
serious techniques, seriously fun data!
Excited to talk about the emergence of liquid-crystalline order and structure in bacterial biofilms at the WCB 2018 in Dublin on Tuesday morning! #WCB2018#bacteria#biomechanics
Very excited to share the software we (@RaimoHartmann@ThanbichlerLab@knutdrescher) developed to automate stalk detection in microscopy images. It also visualizes morphogenesis and dynamics of fluorescent fusion proteins in a intuitive and pretty way!
https://t.co/kBRKsR2Kw4