I showed you this chart last year. I hope you were one of the ones who took it seriously, and ignored all the false fairytale narratives. The crypto market is back to where it was in 2017 priced in gold 👇
#COPPER
Copper remains in a strong uptrend across all major timeframes, but after closing at all-time highs on Tuesday, yesterday’s dark cloud cover candle at horizontal resistance introduced a meaningful bearish pivot reversal signal.
From a psychology standpoint, the candle reflects profit-taking and the emergence of sellers at resistance.
That said, a single reversal candle is not enough to change sentiment. Bulls remain firmly in control until bears can generate confirmation follow-through and prove they can sustain downside momentum.
As long as the broader trend structure of higher highs and higher lows remains intact, any confirmed pullback would likely be viewed as a healthy retracement rather than a trend change.
Traders will be watching key support levels for signs of stabilization and a bullish pivot reversal if we get a pullback, which could provide the next opportunity for trend-following buyers to step back in and continue the larger uptrend.
If you trade #COPPER, join us at https://t.co/piEjMamo61 where we produce daily copper video technical reviews covering key levels, market outlook, trade setups, entries, exits, momentum shifts, chart patterns, and risk management. Members also get access to our private chat room, educational content, real-time trade alerts, and daily market recaps designed to help traders build a structured trading framework.
Subscribe at https://t.co/piEjMamo61
Check us out on discord:
https://t.co/9J76VmgpA7
$ERO $FCX $SCCO $BHP $RIO $TECK $GLNCY $TGB $HBM $CPER $COPX $VALE $NEM $XME $AA $CLF $MT $ANTO $LUN $IVN $TRQ $KAT
Gold/Silver ratio sitting just below overhead resistance within a symmetrical triangle consolidation. A breakout to the upside would imply a sharp correction in the metals. Not too ominous just yet, but something to keep an eye on.
𝐆𝐨𝐥𝐝𝐞𝐧👁️ - 𝐁𝐞𝐚𝐫𝐢𝐬𝐡 𝐑𝐞𝐯𝐞𝐫𝐬𝐚𝐥 𝐂𝐚𝐧𝐝𝐥𝐞 𝐏𝐚𝐭𝐭𝐞𝐫𝐧𝐬
Japanese candlesticks are one of the most powerful tools in trading because they are built directly from price.
Price is the leading indicator. Every indicator, RSI, MACD, Stochastics, moving averages, Bollinger Bands, is calculated from price after the fact. Candlesticks allow traders to see the battle between buyers and sellers in real time, often providing the earliest clues that momentum is shifting before lagging indicators catch up.
This visual highlights some of the most common bearish reversal candlestick patterns, including the Shooting Star, Bearish Engulfing, Hanging Man, Gravestone Doji, Dark Cloud Cover, Tweezer Top, Three Black Crows, Evening Star, and more. These patterns represent exhaustion from buyers, profit-taking, distribution, or aggressive selling pressure entering the market.
The key is that candlestick patterns should never be traded in isolation. The highest probability setups occur when they form at major resistance levels such as horizontal resistance, prior highs, descending trendlines, channel resistance, wedge resistance, Fibonacci levels, volume profile resistance, or key moving averages like the 50 or 200 EMA.
- Look for bearish patterns at resistance
- Wait for confirmation with the next candle closing lower
- Use volume expansion to validate selling pressure
- Combine with RSI divergence or a weakening MACD
- Focus on risk/reward rather than predicting tops
- Remember that a bearish candle at support is often just noise, while the same candle at resistance can signal a meaningful reversal
The goal isn’t to predict the future. The goal is to recognize when buyers are losing control and when the probability of a pullback or trend reversal is increasing. Price action comes first. Everything else follows.
If these tips help you build a trading plan, you’ll love our full library of strategies, patterns, trade alerts, insights, videos, and chatroom. Join us at https://t.co/piEjMamo61.
$GLD $XAUUSD #GOLD #XAUUSD $GC $GDX $GDXJ $GOLD $DXY $URA $WTI $USO $SLV #SILVER $COPX $PALL $GLD $UGL $GLL $URNM $URA $BITO $USO $UCO $OIL $UUP $UDN $FCX $AG $PAAS $SLV $MARA $XOM $WTI $COPX
#Trading #TechnicalAnalysis #PriceAction #StockMarket #Candlesticks #RiskManagement #TradingEducation
#SILVER
Silver closed with a doji yesterday at ascending support, but bulls are failing today to generate the conviction needed today to confirm a pivot low reversal.
Patience has paid off for traders waiting on the sidelines, as there has been no technical reason to initiate a long position over the past few weeks while price has remained trapped below the key 21 and 50 EMA.
Today’s bearish continuation candle is now breaking ascending support, signaling that sellers continue to control momentum. RSI remains in a zone of weakness below 50, MACD is still below its signal line, and the loss of support further tilts the risk-reward profile in favor of caution.
The psychology remains bearish, with buyers unable to regain control and sellers continuing to press their advantage.
Patience remains key for new entries, and if you took a long position in silver over the past few weeks, join us at https://t.co/IKZzRlim19 where we share price sentiment, momentum analysis, trade setups, key levels, and much more for #SILVER.
Join us at https://t.co/piEjMamo61.
$ABX $AEM $AG $AYA $BVN $CDE $CX $EXK $FNV $FSM $GATO $HL $MAG $NEM $PAAS $SIL $SILJ $SILVER $SLV $SLVP $SKE $SSRM $SVM $XAGUSD
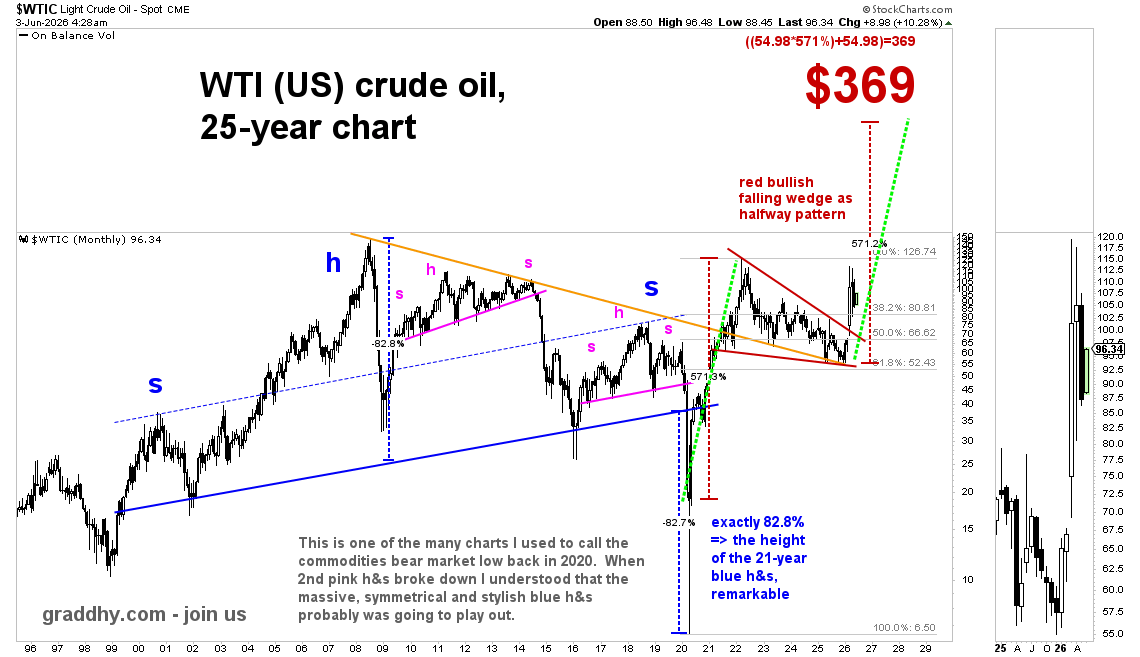
Big oil CEOs are now coming out saying next stop for oil is $150-$160.
The charts showed us that a long time ago.
And, that is a very important red breakout, for many reasons.
One reason being that it kicked off the 2nd inflationary wave.
Been saying for years that we will see at least $250-$300 oil during this commodities bull market.
And in the linked post below I raised that target to $369.
Oil was at $58.40 in the linked post below. Now at $96.
The linked post nailed the low.
The 4.5 year red bullish falling wedge is probably a halfway pattern, with a price target of $369 (green lines measured move approx route).
Since I called the commodities bear market low almost 6 years ago, I have been saying that this commodities bull market is the best opportunity you will ever have in life to get out of the rat race.
When that 2nd pink head & shoulders pattern broke down just before the Covid-crash, I understood that the huge blue head & shoulders pattern was probably going to play out too. And it very much did.
That is the kind of guidance that makes a difference. Following the right people is absolutely vital. #joinus https://t.co/dZoc2yuE1z #oott #oilprice
Check that breakout above red line; a huge gap up above it, then gapfill, then take off. That is stylish price action. And yes, if going to breakout, why not do it in style.