I’ve made over $100,000 in just 3 months using my NEW CBC indicator.
Now I turned it into a FREE TradingView indicator that tells you exactly when to buy and sell
Like + Comment “CBC” - I’ll DM it to you.
(Must be following to DM)
I’ve been testing it for months, and it’s been printing. 📈
$SPY $SPX
Wacky Wednesday Squeezes 🍋
$QQQ 15 & 30 minute chart
$IWM 15 & 4 hour chart
$META 30 min & Daily chart
$AMZN 15 min chart
$AAPL 30 min chart
(Consolidation leads to Expansion. Squeeze is the expansion. As for the direction, you have to do your own DD)
$SPY #DirectionalAnalysis
LONGS: Aiming to defend the PDL 734.58 in order to push above the PDH 738.1. Over this they target 739->740->741
SHORTS: Aiming to defend the PDH 738.1 in order to push below the PML 735.76. Below this they target PDL 734.58->733.55->732.5->731.5->729.75
$SPY $QQQ
If u missed this SPACES that was NOT announced ahead of time, just did it as a last minute thing without any warning…
1500 people tuned in 👀
If u didn’t hear it, here’s the recording, the next day - today so many things played out in real time including another deal by NVDA in the phonics space and geopolitical events and technical thoughts
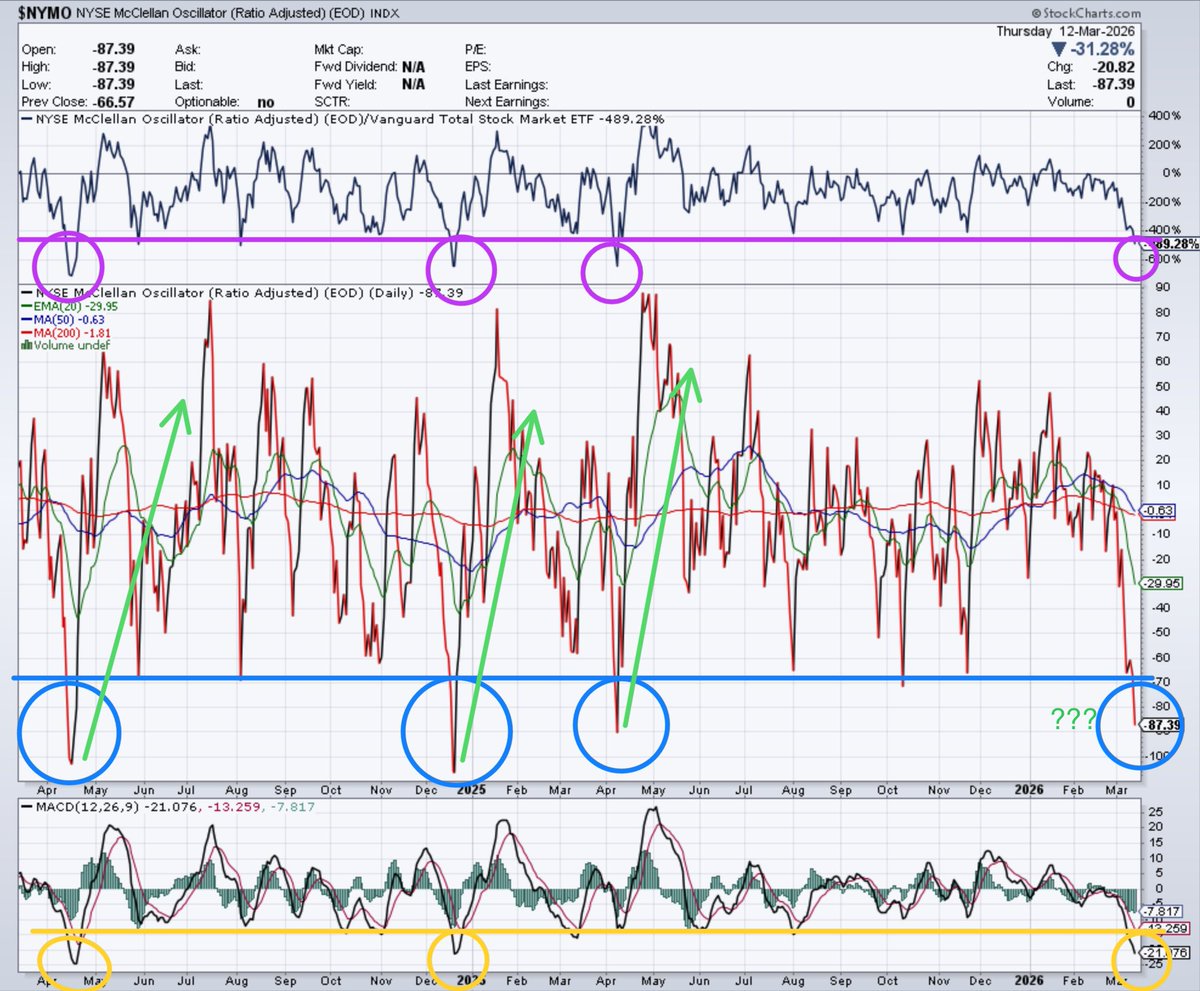
$NYMO $SPY $QQQ
NYMO - New York Stock Exchange McClellan Oscillator
The “Rubber Band” has stretched more, possibly making the “Snap Back” that more stronger 🤔
Many people will say, “but we’re not that far from the highs,”however under the hood many stocks have already been getting hammered and correcting for some time, many of the best companies with the best balance sheets and growth in their revenues are down 10%, 15%, 20%, and more 👀
Stocks like $AMZN, $GOOGL, $META, $NVDA, that are at, near, and below a market multiple on Forward P/E 🤌. The software sector has paid its pound of flesh and probably a few more pounds and trading at the lowest valuation since the great financial crisis 🤯
This would normally be associated with a 10% to 15% or more correction in the actual indexes but it has happened stealthily “under the hood” as markets did a good job of rotating sectors on what many industry professionals have called a “Rolling Correction”
That’s why it’s important to keep track of what’s under the hood besides just the 200 day moving average per say 📝
This (NYMO) under the hood reading tells us we are already at the equivalent of last years April “Liberation Day” drawdown and near the bottom of December and April 2024 which were pretty harsh pullbacks. This does NOT mean we can’t go lower, but it tells us we’re in the vicinity where a rip your face of rally has the PROPENSITY to occur 🤔
I hope you enjoyed the research and write up
Much love 💛🍌🍌🍌