I was trying to stay calm about $BEAN.
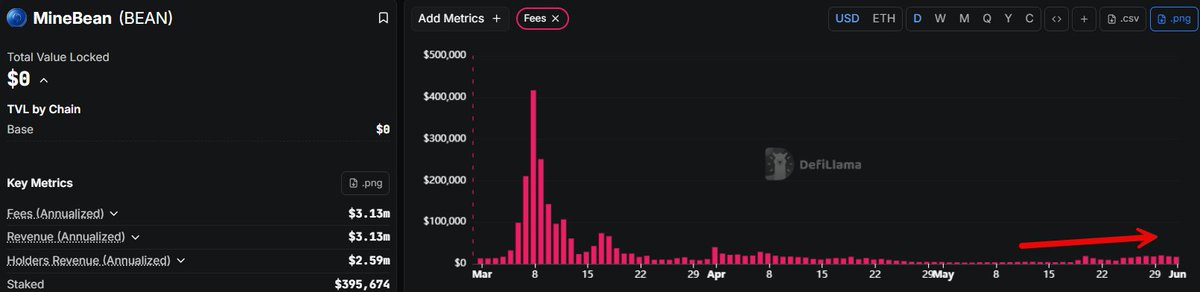
But then I opened the chart and saw this.
One of those classic TA patterns that looks stupidly obvious in hindsight.
.@minebean_ is doing $3M annualized revenue at a sub-$1M market cap
Now the trend is starting to accelerate again
As the 4 buyback + burn flywheels kick in, this disconnect won’t last much longer
The fundamentals are already moving, $BEAN price just hasn’t caught up yet
I've been crunching number on $Bean 🫘
What's coming is going to make the first run look like it was nothing.
1. People have been overlooking the power of their LP flywheel. This engine feeds off volume.
More volume = more buybacks + burns = supply compression = more demand = more volume. The loop just keeps going.
Every BEAN/ETH swap burns fees on both sides. 50% of ETH fees go to buying back $Bean, 100% of token side fees go straight to the dead address. Supply gets compressed every single trade, in both directions.
2. This was installed during the quiet stretch while no one was watching. If it had been live in March when they did $21 Million+ in volume, conservatively another $100k in $Bean buyback and burn would have stacked on top of what already happened that month.
The first run was running on one engine. This next leg up runs on two.
3. The past 10 days have already started showing what this loop looks like in motion at small scale as you can see, 100k MC to 1.3M and now consolidating.
Now imagine $Bean at $50, $100, $300, with millions in daily volume on top of the grid volume, the original buyback engine and the LP flywheel compounding on each other every single hour.
People are underestimating what that picture looks like. It's the most underpriced piece of mining meta tokenomics on the table right now.
$650k mc here
0x5c72992b83E74c4D5200A8E8920fB946214a5A5D