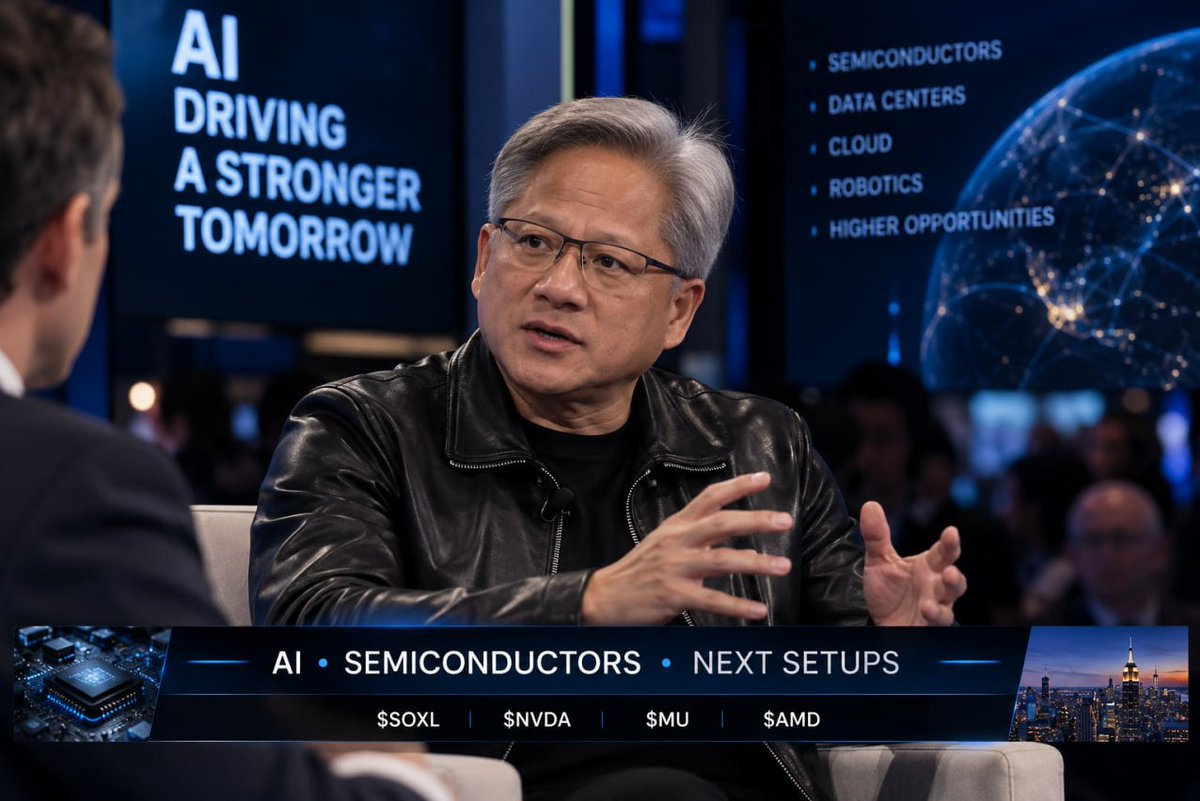
My stock watchlist for today:
• $MU (Micron) — Don’t chase. Wait for the pullback.
• $AMD — Don’t chase after the breakout. Let it consolidate.
• $NVDA — Watching for a clean higher-low setup.
• $SOXL — My aggressive semiconductor play. 3X leverage, manage risk.
• $META — Strong AI momentum, but I want a better entry.
• $GOOGL — Watching the pullback and support reaction.
• $TSLA — Watching $377–$380 for direction.
• $AVGO — Staying on my AI infrastructure list.
AI and semiconductors are still leading this market.
But after a strong run, price matters more than FOMO.
💡 Save this list.
I’ll update the setups as the market gives us confirmation.
Patience first. Trade second. 👀
$JAGX is getting absolutely DESTROYED premarket. 😳
Yesterday: +1,190%
Premarket: roughly -50%
Read that again.
This thing went from one of the craziest squeezes on the market to losing nearly HALF its value before the opening bell.
And this is exactly why I don't chase vertical candles.
When a low-float stock goes parabolic, everyone feels like a genius on the way up.
Then liquidity disappears.
Suddenly there are no buyers underneath you.
For me, $JAGX isn't a dip-buy yet.
I want to see where buyers actually step in and build structure first.
No structure = no setup.
Yesterday was euphoria.
Today is the reality check. 🐦⬛
My updated stock watchlist after the close:
• $SOXL — My main semiconductor momentum play. Waiting for the next clean pullback.
• $NVDA — Still the name I watch for AI leadership. Not chasing strength.
• $MU — One of my favorite ways to track AI memory demand.
• $AMD — Huge run. I want consolidation before getting aggressive.
• $AVGO — AI infrastructure remains the story.
• $GOOGL — Watching for buyers to defend support.
• $META — AI momentum stays on my radar.
The theme hasn’t changed:
AI + semiconductors.
But price matters.
I’d rather miss the first 5% than chase a stock after it’s already extended.
Save this list. I’ll update the setups as they develop. 👀
$SOXL $NVDA $MU $AMD $AVGO $GOOGL $META
I’ll only say this once.
The AI trade is creating opportunities most investors won’t recognize until the move is already obvious.
I’ve narrowed my semiconductor watchlist down to 5 stocks I believe deserve serious attention through the rest of 2026.
Here’s #1:
1) $MU — Micron
AI isn’t just about GPUs.
Every AI data center needs massive amounts of high-performance memory, and that demand is reshaping the memory market.
Micron has already disclosed $22 billion in customer commitments to secure memory-chip supply. Reuters
I’m watching the current pullback closely.
I’d rather wait for the right setup than chase a vertical candle.
The other 4 are coming next. 👇
WALL STREET TODAY — Here’s What Actually Matters 👀
The Nasdaq just pushed to a fresh intraday record high.
AI is back in control.
Semiconductors are leading.
Oil is cooling.
But rates are still the risk nobody should ignore. Reuters
$META — AI momentum remains strong after the launch of Muse
$AMD — recently crossed the $1T market-cap milestone
$INTC — semiconductor momentum remains strong
$MU — helping push the AI/chip trade higher
$NVDA — still one of the key names to watch for AI sentiment Reuters
Meanwhile:
Nasdaq → Record territory
S&P 500 → Near record highs
Oil → Back around/below $100
10Y Treasury → Still near 5%
Fed → Inflation concerns haven’t disappeared Reuters
My focus is simple:
AI + semiconductors remain the momentum trade, but I’m watching yields closely.
When tech is breaking records while rates remain this high, stock selection matters more than ever.
$NVDA $AMD $META $INTC $MU $QQQ
Follow for the setups I’m watching next.
If you missed some of the biggest tech moves lately:
$META — caught the AI momentum before the breakout
$AMD — pushed into the $1T market-cap club
$INTC — one of the strongest chip names in the recent rally
$SNDK — momentum came back fast
I’m not chasing what already ran.
Here’s what I’m watching NOW 👀
$ARM
$AMD
$INTC
$LRCX
$CRDO
$AMAT
$SNDK
$NVDA
AI + semiconductors are still where some of the strongest momentum is showing up.
The key is finding the next clean setup before everyone starts talking about it.
Watch the levels. Wait for confirmation. 📈
Not financial advice.
$GOOGL Is Showing Relative Weakness — Here’s What I’m Watching
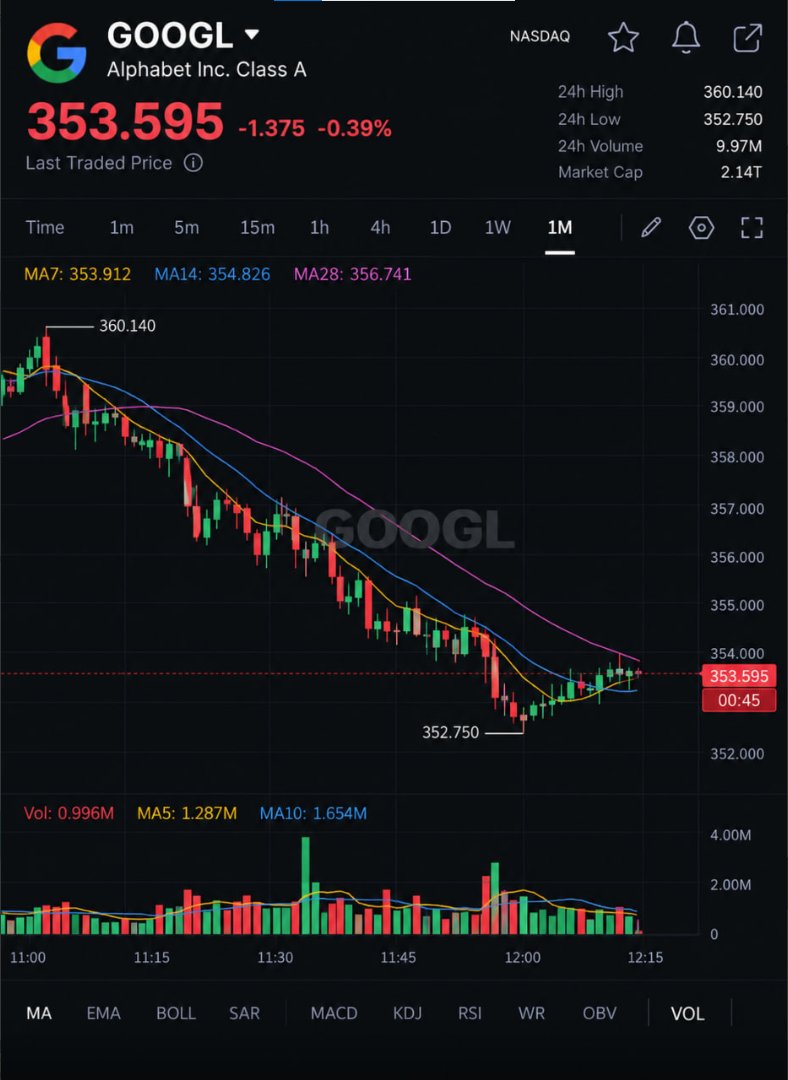
$GOOGL is trading around $353.60, but the headline number doesn’t tell the whole story.
The intraday structure is still weak.
Price rejected from $360.14 and spent most of the session printing lower highs and lower lows before finally finding buyers around $352.75.
What makes this more interesting: the Nasdaq pushed to a fresh intraday record while GOOGL remained under pressure. That divergence tells me this isn’t just broad-market weakness. Reuters
My levels:
$352.75–$353.00 → key support
This is the line buyers need to defend. Lose it cleanly and sellers remain in control.
$354.80–$355.20 → first resistance
Reclaiming this area would be the first sign that the selling pressure is easing.
$356.00–$356.50 → bigger recovery level
I’d want to see price back above here before calling this a meaningful intraday reversal.
For now, I’m treating the bounce as stabilization — not a confirmed reversal.
Below $355, sellers still have the advantage. Above $356.50, the chart starts getting much more interesting.
Let price confirm the turn.
$GOOGL $GOOG #Google #Stocks #Trading #Nasdaq
$GOOGL Intraday Update — Sellers Still in Control
$GOOGL is trading around $353.60, down about 0.39%, after failing to hold the early session strength near $360.14.
The stock has been under steady selling pressure, forming a clear intraday downtrend with lower highs and lower lows. Price recently tested the $352.75 area and is attempting a small rebound.
Key levels to watch:
🟢 Support:
$352.75 — intraday low
$352.00 — next downside level if selling resumes
🔴 Resistance:
$354.50–$355.00 — first recovery zone
$356.50–$357.00 — key level to reclaim momentum
My view:
$GOOGL needs to regain $355+ to show buyers are stepping back in. Until then, the trend remains cautious, with sellers controlling the short-term structure.
$GOOGL #Google #AI #Stocks #MarketUpdate
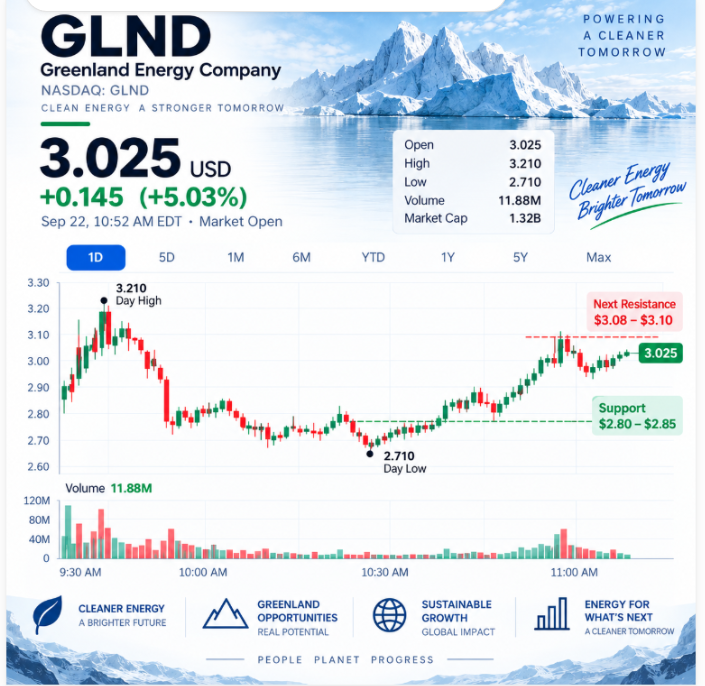
$GLND is back above $3.00 — up 5% today.
Price: $3.025
Intraday high: $3.21
Intraday low: $2.71
GLND had a wild open, ran to $3.21, then completely retraced the move before building a base around $2.80–$2.85.
Now buyers are stepping back in. The late push through $2.95–$3.00 came with a noticeable pickup in volume, putting $3 back in play.
$3.00 is the level I’m watching now. Hold it, and $3.08–$3.10 could be the next test.
Can $GLND turn this rebound into another run at $3.21?
$GLND #SmallCaps #Stocks
$ORCL$ORCL $ORCL finished slightly higher, but the after-hours action is basically flat.
Close: $148.56 (+0.64%)
After-hours: $148.46
Day high: $149.98
Day low: $146.16
Oracle gave back part of its regular-session gain and is now consolidating tightly around $148.40–$148.60 after hours.
That makes $148.20–$148.40 the first support area I’m watching, while $148.70–$149.00 is the first zone buyers need to reclaim.
Nothing dramatic here yet — just a tight post-close battle.
Does $ORCL hold $148 and set up another test of $150?
$ORCL #Oracle #Stocks
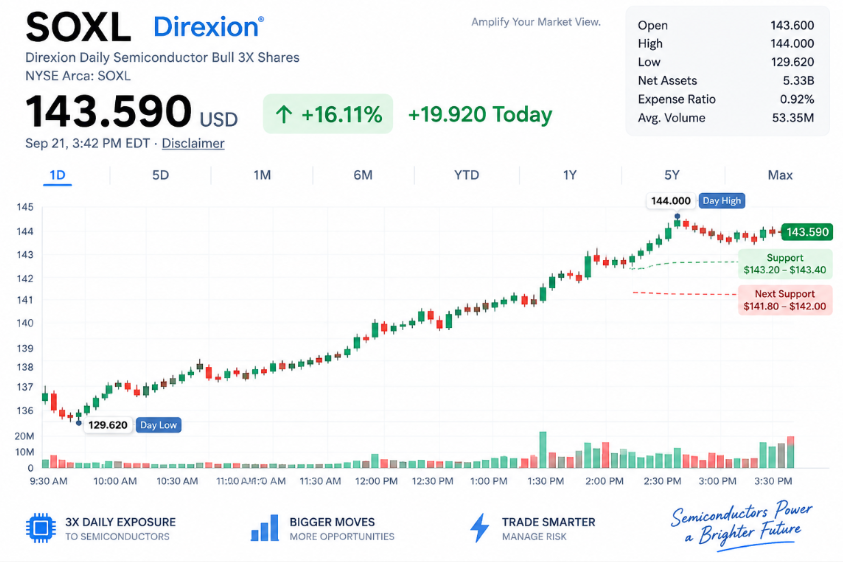
$SOXL is now up more than 16% today.
Price: $143.59
Intraday high: $144.00
Intraday low: $129.62
SOXL has continued to grind higher into the close, with buyers repeatedly defending pullbacks and pushing price to a fresh $144.00 session high.
The late-day structure is still strong. $144 is now the immediate breakout level, while $143.20–$143.40 is the first area I’d want to see buyers defend.
Can $SOXL clear $144 and finish the session at new highs?
$SOXL $SOXX #Semiconductors
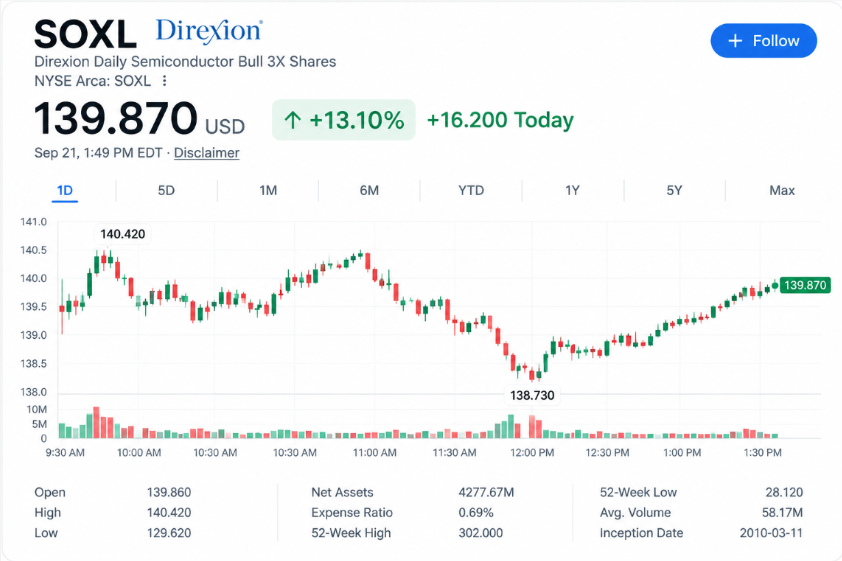
$SOXL is now up more than 13% today.
Price: $139.87
Intraday high: $140.42
Intraday low: $129.62
After pulling back to $138.73, SOXL has staged a sharp recovery and is now pushing back toward $140.
The bigger trend remains strong, but $140.00–$140.42 is the key area buyers need to reclaim.
Can $SOXL break $140.42 and make another run at the highs?
$SOXL $SOXX #Semiconductors
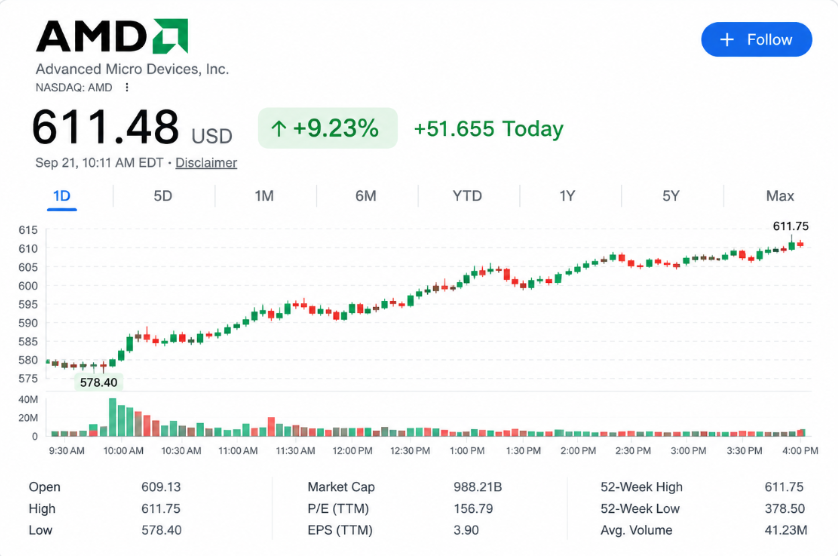
$AMD is now up more than 9% today.
Price: $611.48
Intraday high: $611.75
Move: +9.23%
AMD has been printing higher highs and higher lows, with buyers continuing to absorb nearly every pullback.
Is $612 the breakout that sends AMD into its next leg higher?
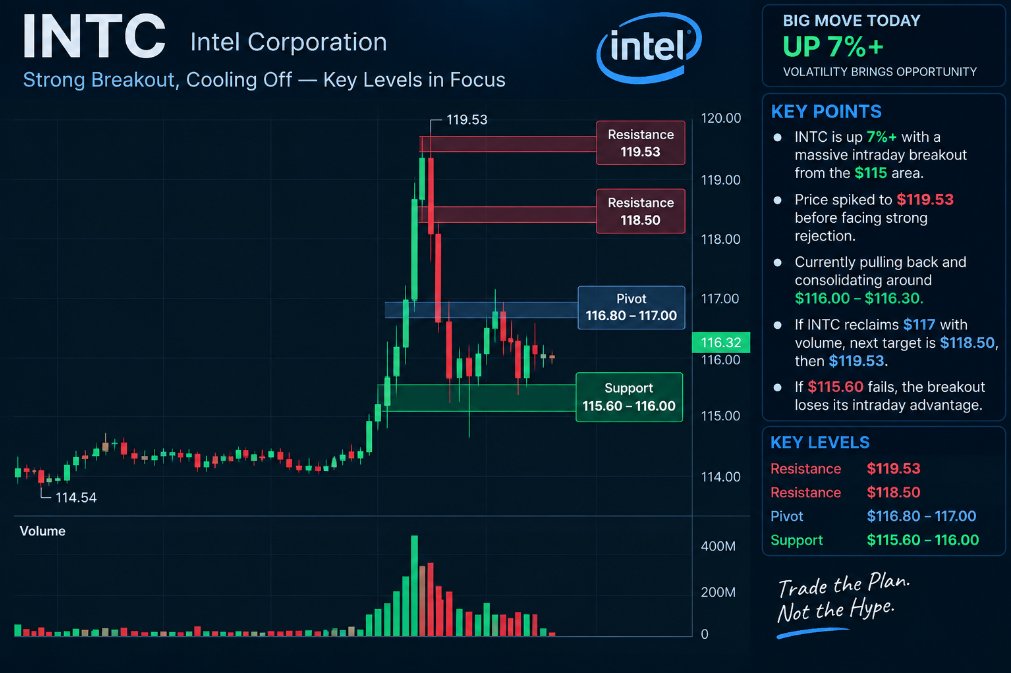
$INTC is having a huge session, up 7%+, but the intraday structure is getting interesting.
The initial breakout accelerated from the $115 area to $119.53, where momentum was sharply rejected. Since then, price has pulled back and is trying to establish a higher base around $116.00–$116.30.
What I’m watching now:
• Support: $115.60–$116.00
• Pivot: $116.80–$117.00
• Resistance: $118.50, then $119.53
If $INTC can reclaim $117 with volume, I’d look for another attempt toward the highs. If $115.60 fails, the breakout starts losing its intraday advantage.
Strong move, but after a vertical spike like this, I’m more interested in whether buyers can defend the pullback than chasing the headline gain.
$INTC #Intel #Stocks #StockMarket #Trading
$SOXL Premarket — +7.02%, but $133.42 is the level bulls need back.
SOXL is trading around $132.35, up 7.02% premarket, after running from roughly $130.91 to $133.42.
The initial breakout was strong, but momentum cooled after the rejection near $133.42.
Levels I’m watching:
🔹 $133.20–$133.42 — key resistance
🔹 $132.20–$132.35 — immediate support
🔹 $131.60–$131.80 — stronger support
Holding $132.20 keeps the structure constructive. Reclaiming $133.42 would put the breakout back in control; losing $132.20 could bring a deeper pullback.
$SOXL $SOXX #Semiconductors #Stocks
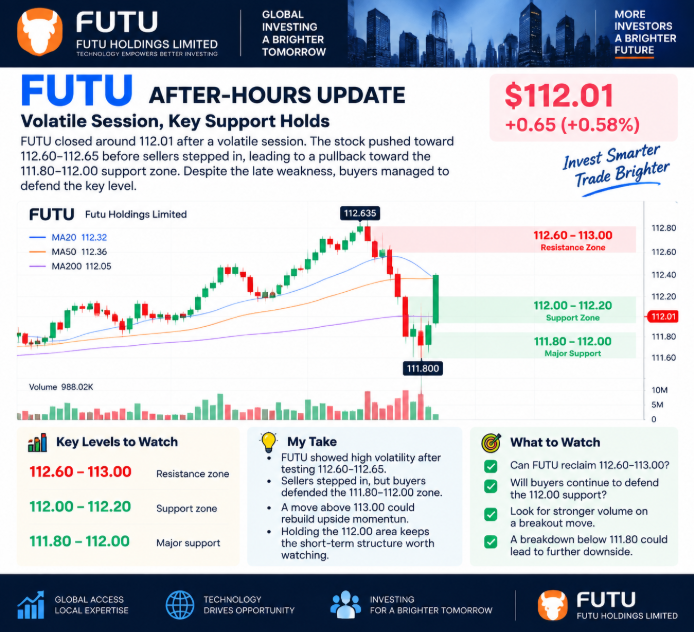
$FUTU (Futu Holdings) After-Hours Technical Update
$FUTU closed around $112.01, with price action showing a volatile session after testing higher levels.
The stock pushed toward the $112.60–$112.65 area before sellers stepped in, leading to a pullback toward the $111.80–$112.00 support zone. Despite the late weakness, buyers managed to defend the key psychological level.
Key levels to watch:
• Resistance: $112.60–$113.00
• Support: $111.80–$112.00
• Breakout zone: A move above $113 could rebuild upside momentum
The next move will depend on whether buyers can reclaim resistance and bring back volume. Holding the $112 area keeps the short-term structure worth watching.
$FUTU #Stocks #Trading #MarketAnalysis #Investing
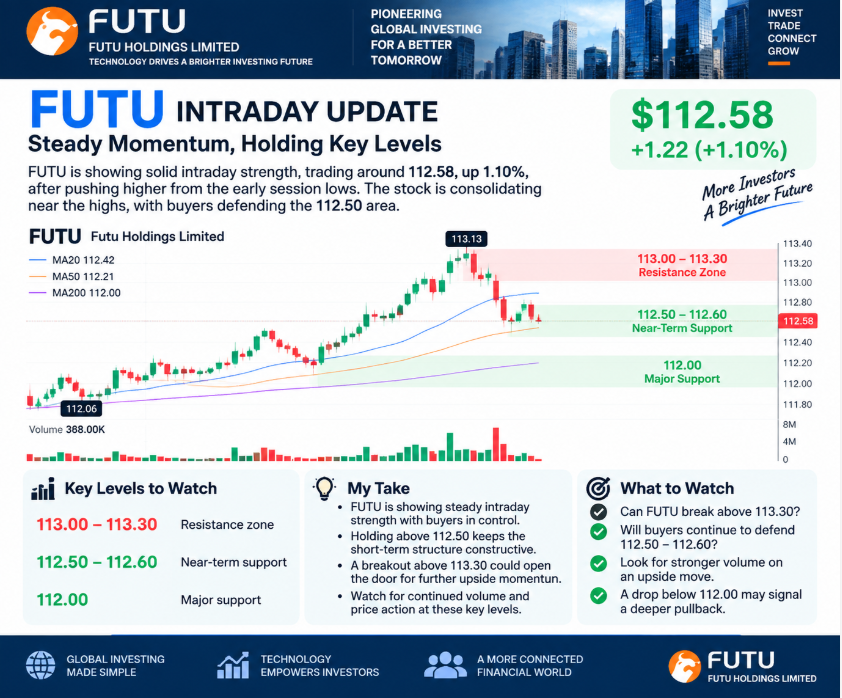
$FUTU is showing steady intraday strength, trading around $112.58 (+1.10%) after pushing higher from the early session lows.
The stock built a strong upward move, climbing from the $112.00 area toward the $113.00+ zone, with buyers stepping in on pullbacks. Price is now consolidating near the highs, suggesting bulls are defending the current range.
Key levels to watch:
• Resistance: $113.00–$113.30
• Near-term support: $112.50–$112.60
• Major support: $112.00 area
A clean break above $113.30 with stronger volume could open the door for further upside momentum. Holding above $112.50 keeps the short-term structure constructive.
Watching volume expansion and whether buyers can reclaim the session highs. 📈
#FUTU #StockMarket #Trading #MarketAnalysis