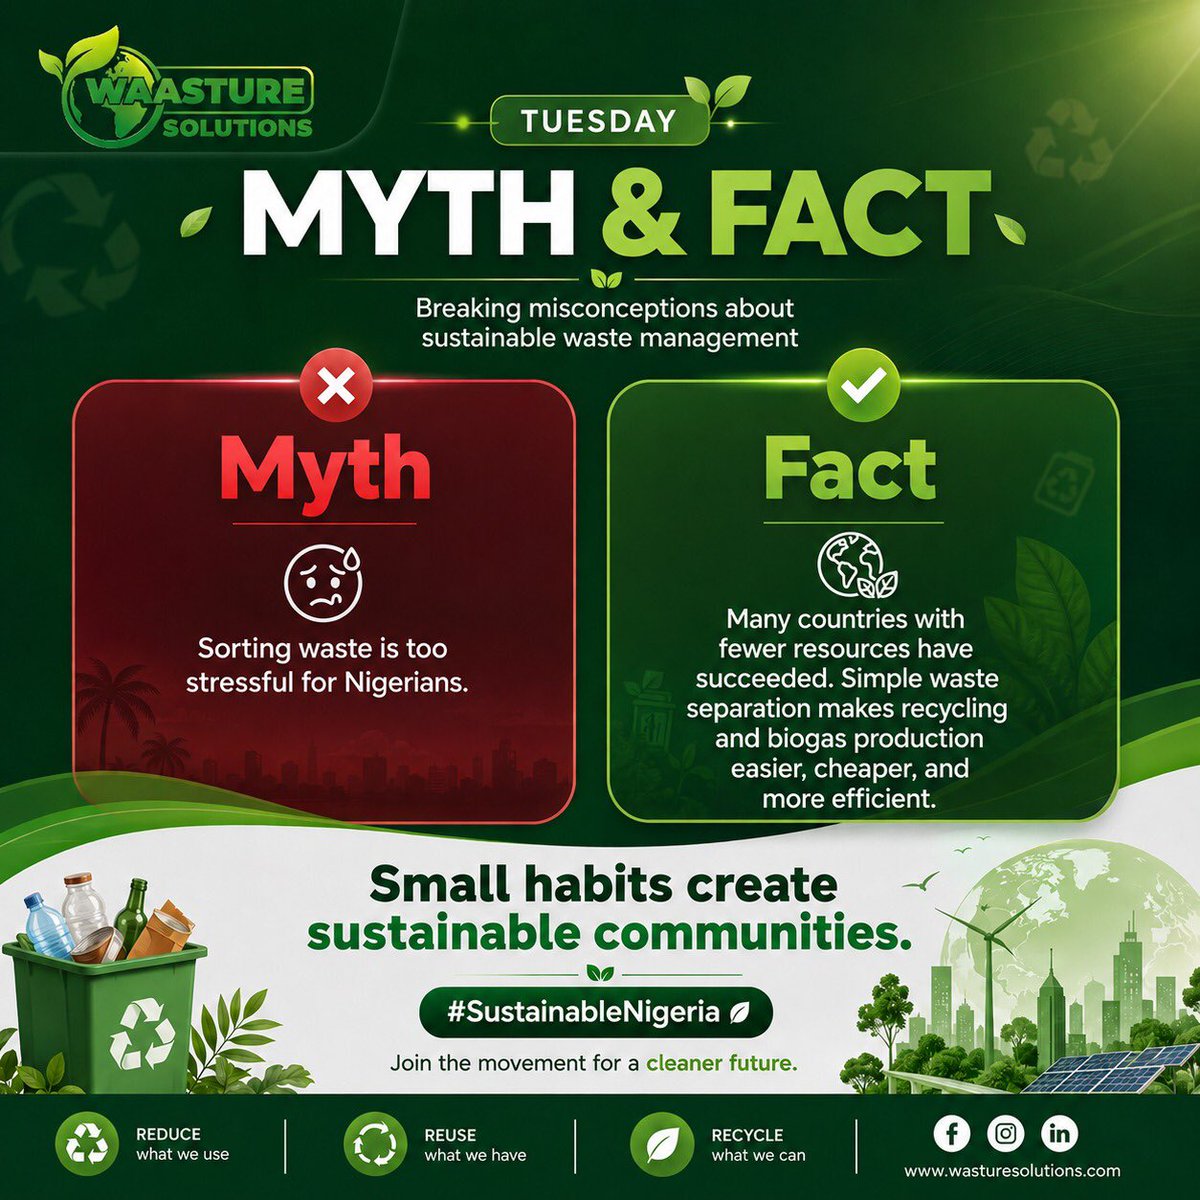
♻️ Tuesday Myth & Fact
❌ Myth: “Sorting waste is too much stress for Nigerians.”
✅ Fact: Simple waste separation makes recycling & biogas production easier, cheaper, and more effective.
Small habits can create a cleaner Nigeria
#SustainableNigeria#WastureSolutions#Recycling
I earned my "Model data with Power BI" trophy! I’m so proud to be celebrating this achievement and hope this inspires you to start your own @MicrosoftLearn journey!
https://t.co/Y4ErKdPCAM #MSLearnTrophy
I earned my "Create visual calculations in Power BI Desktop" badge! I’m so proud to be celebrating this achievement and hope this inspires you to start your own @MicrosoftLearn journey!
https://t.co/Vc5CCzwm0q #MSLearnBadge
I earned my "Use DAX time intelligence functions in semantic models" badge! I’m so proud to be celebrating this achievement and hope this inspires you to start your own @MicrosoftLearn journey!
https://t.co/Urz7RD09NJ #MSLearnBadge
I earned my "Modify DAX filter context in semantic models" badge! I’m so proud to be celebrating this achievement and hope this inspires you to start your own @MicrosoftLearn journey!
https://t.co/jVVnZVjHmd #MSLearnBadge
This Ramadan, Wasture Solutions shares daily insights on waste management and waste-to-energy conversion.
Transforming waste into sustainable power; one fact at a time.
Follow us for daily updates. #Ramadan#Sustainability#WasteToEnergy#wastemanagement
FREE Introduction to Data Analytics folder.
Contains:
- Data Analytics Starter Kit
- 7+ hours of video lectures
- PDF and .pptx class files
- 1 SQL project and solution
- 1 Business Intelligence project
- 1 complete Power BI dashboard
- Steps to Take
- Data Analytics WhatsApp Group
If you’re interested, like and retweet then comment interested and I’d share the link with you
𝗚𝗼𝗼𝗱 𝗺𝗼𝗿𝗻𝗶𝗻𝗴 𝗴𝘂𝘆𝘀.
If you’re starting out as a data analyst, before you hop on any tools, you need to understand the data analysis lifecycle.
This is the framework every analyst uses, whether they realize it or not.
Let me break it down. 🧵
𝟭. 𝗨𝗻𝗱𝗲𝗿𝘀𝘁𝗮𝗻𝗱𝗶𝗻𝗴 𝘁𝗵𝗲 𝗕𝘂𝘀𝗶𝗻𝗲𝘀𝘀 𝗣𝗿𝗼𝗯𝗹𝗲𝗺 (𝗔𝘀𝗸)
This is where most beginners mess up.
They jump straight into tools without understanding what problem they’re solving.
Ask:
→ What question are we trying to answer?
→ Who needs this information?
→ What decision will this analysis drive?
If you don’t understand the problem, your analysis is useless.
𝟮. 𝗗𝗮𝘁𝗮 𝗖𝗼𝗹𝗹𝗲𝗰𝘁𝗶𝗼𝗻
Now you know what you need. Go get it.
Where is the data?
→ Database? Export it.
→ Excel file? Import it.
→ API? Pull it.
→ Manual entry? Document it.
You can’t analyze what you don’t have. Collect the right data from the right sources.
𝟯. 𝗗𝗮𝘁𝗮 𝗖𝗹𝗲𝗮𝗻𝗶𝗻𝗴 & 𝗧𝗿𝗮𝗻𝘀𝗳𝗼𝗿𝗺𝗮𝘁𝗶𝗼𝗻
Real data is messy. Always.
Missing values. Duplicates. Wrong formats. Inconsistent entries.
Clean it:
→ Handle nulls
→ Remove duplicates
→ Fix data types
→ Standardize formats
This step takes 80% of your time. Accept it.
𝟰. 𝗗𝗮𝘁𝗮 𝗘𝘅𝗽𝗹𝗼𝗿𝗮𝘁𝗶𝗼𝗻
Now you start asking questions.
What patterns do you see?
→ Trends over time?
→ Outliers?
→ Correlations?
→ Unexpected values?
This is where curiosity matters more than technical skills.
Explore. Dig. Ask “why?”
𝟱. 𝗗𝗮𝘁𝗮 𝗔𝗻𝗮𝗹𝘆𝘀𝗶𝘀 / 𝗠𝗼𝗱𝗲𝗹𝗶𝗻𝗴
Apply your methods.
Descriptive analysis - what happened?
Diagnostic analysis - why did it happen?
Predictive analysis - what will happen?
Prescriptive analysis - what should we do?
Use the right technique for the question you’re answering.
𝟲. 𝗜𝗻𝘁𝗲𝗿𝗽𝗿𝗲𝘁𝗮𝘁𝗶𝗼𝗻 & 𝗣𝗿𝗲𝘀𝗲𝗻𝘁𝗮𝘁𝗶𝗼𝗻
You found insights. Now make them understandable.
Nobody cares about your SQL query or your pivot table.
They care about:
→ What does this mean for the business?
→ What should we do about it?
→ What’s the impact?
Visualize it. Tell a story. Make it actionable.
𝟳. 𝗜𝗺𝗽𝗹𝗲𝗺𝗲𝗻𝘁𝗮𝘁𝗶𝗼𝗻
Your analysis drives a decision. The decision leads to action.
Did it work?
→ Monitor the results
→ Track the metrics
→ Measure the impact
If it didn’t work, cycle back. Refine. Try again.
𝗛𝗲𝗿𝗲’𝘀 𝘁𝗵𝗲 𝗽𝗮𝗿𝘁 𝗻𝗼𝗯𝗼𝗱𝘆 𝘁𝗲𝗹𝗹𝘀 𝘆𝗼𝘂:
This isn’t a straight line.
You don’t go 1 → 2 → 3 → 4 → 5 → 6 → 7 and you’re done.
You cycle back and forth.
During exploration, you find data issues → back to cleaning.
During analysis, you realize you need more data → back to collection.
During presentation, stakeholders ask new questions → back to analysis.
That’s normal. That’s how it works.
𝗪𝗵𝘆 𝘁𝗵𝗶𝘀 𝗺𝗮𝘁𝘁𝗲𝗿𝘀:
Beginners think data analysis is about tools.
“Should I learn Excel or Python first?”
“Which BI tool is best?”
Wrong question.
The lifecycle is the same whether you use Excel, Python, Power BI, or Tableau.
Master the process first. Tools are just ways to execute it.
Understand the lifecycle. Follow the process. Get results.
That’s data analysis.
#DataAnalysis #DataEngineering #DataLifecycle #BuildingInPublic #Datafam
🎆2026 https://t.co/5xo7LSIrN4 New Year Airdrop🎉
Snag your slice of 10,000 $ANB rewards by finishing a few quick tasks:
🔶Connect your X account and follow @ant_fun_trade
🔶Retweet our post
🔶Make your first trade on Web (0 fees!) or in the App
🔶Invite friends and earn extra bonuses
Event ends in 15 days, check the details on the event page.
Join now: https://t.co/YgHTiUmKnk
Fully Local Wallet Control + Multi-Chain All-in-One + Zero Platform Fee = Your Future Trading!
NPFL Update ⚽️
Akwa United secures a narrow 1-0 victory over Nasarawa United in a thrilling encounter! 🔥👏
Paul Acquah 34min goal was the difference
#NPFL#AkwaUnited#NasarawaUnited