🚨 New Feature Release 🚨
Introducing: Daily Investing Analysis Group
Fresh updates, every day.
No need to log in constantly—we bring the market to you.
Smarter. Simpler. Systematic.
Only at RightPulse.
#RightPulse#Crypto#SOL#BTC#ETH
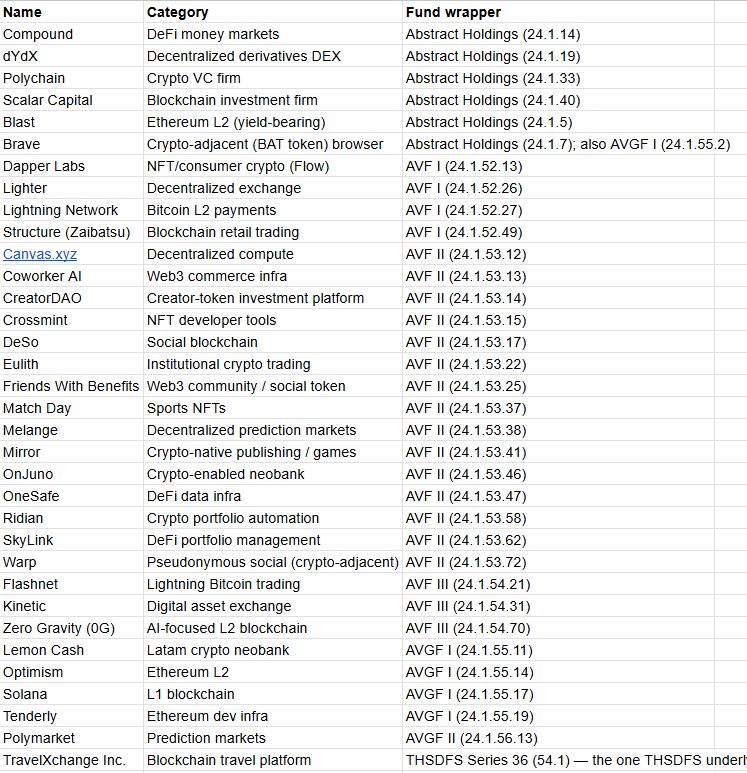
Kevin Warsh owns 30+ crypto projects and youre brearish
the next Fed Chair's disclosure includes: Solana, Optimism, Blast, Compound, dYdX, Polychain, Scalar Capital, Lightning Network, Lighter
the next Fed Chair is more degen than you
big moves stir up big emotions, and emotions lead to bad decisions. If you missed this move, it's not the last one. There will be more opportunities ahead.
BTC followed up the move yesterday with a decent day. It looks like a reversal, but it's probably just to set up consolidation. The best place to bid Bitcoin is either if it holds 70 and consolidates above the EMA50, or we retrace over the next few days down to 68.8, imbalance of the Tuesday pump candle, and that's where it will base before a push to 80K.
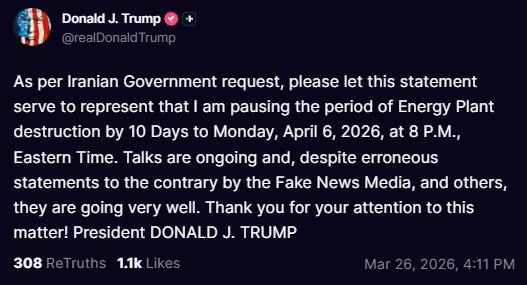
Today’s main headline is that the US and Iran have agreed to a ceasefire. There’s a lot of debate about whether it’s genuine or not, but from a market perspective, that question isn’t especially important. What matters is that markets are reacting as if the ceasefire is real. That said, both sides have officially announced it, so it is indeed a real development.
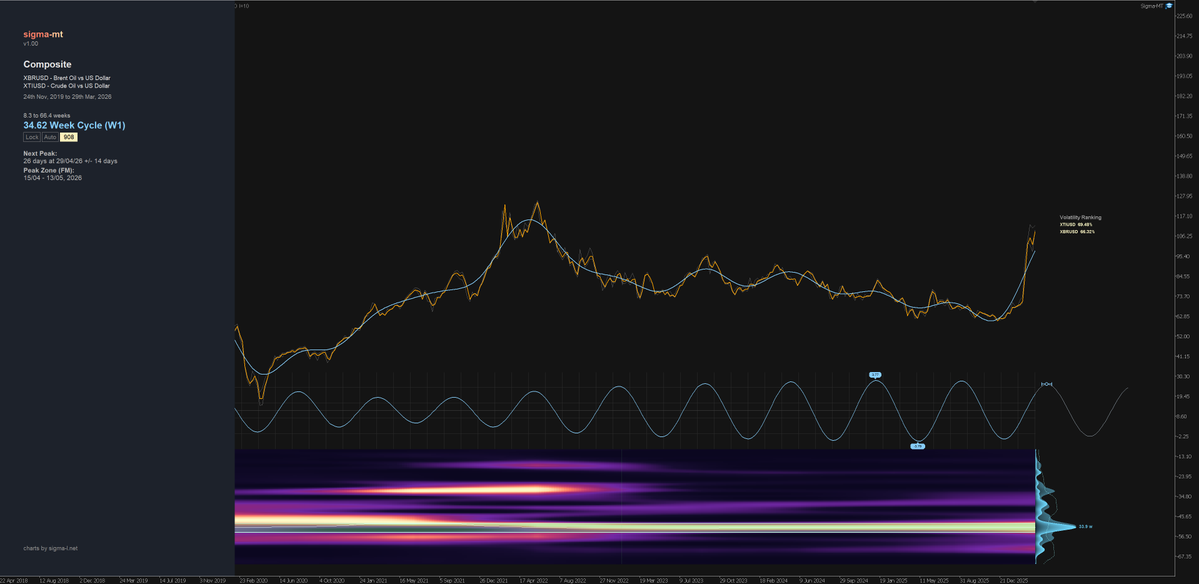
Whether this leads to a full end to the conflict or simply buys a couple of weeks doesn’t really change the immediate market reaction. As soon as the news breaks, markets begin pricing in the possibility of de-escalation or even an end to the war. That’s why we’re seeing strong upward movement in equities, with prices climbing close to pre-war levels. Oil, on the other hand, has moved lower, although it hasn’t fully returned to where it was before the conflict began, since some structural pressures are likely to persist. Overall, current price action reflects a shift toward expectations of easing tensions.
From this point forward, both Bitcoin and equities become more about liquidity dynamics—where support and resistance levels will establish next.
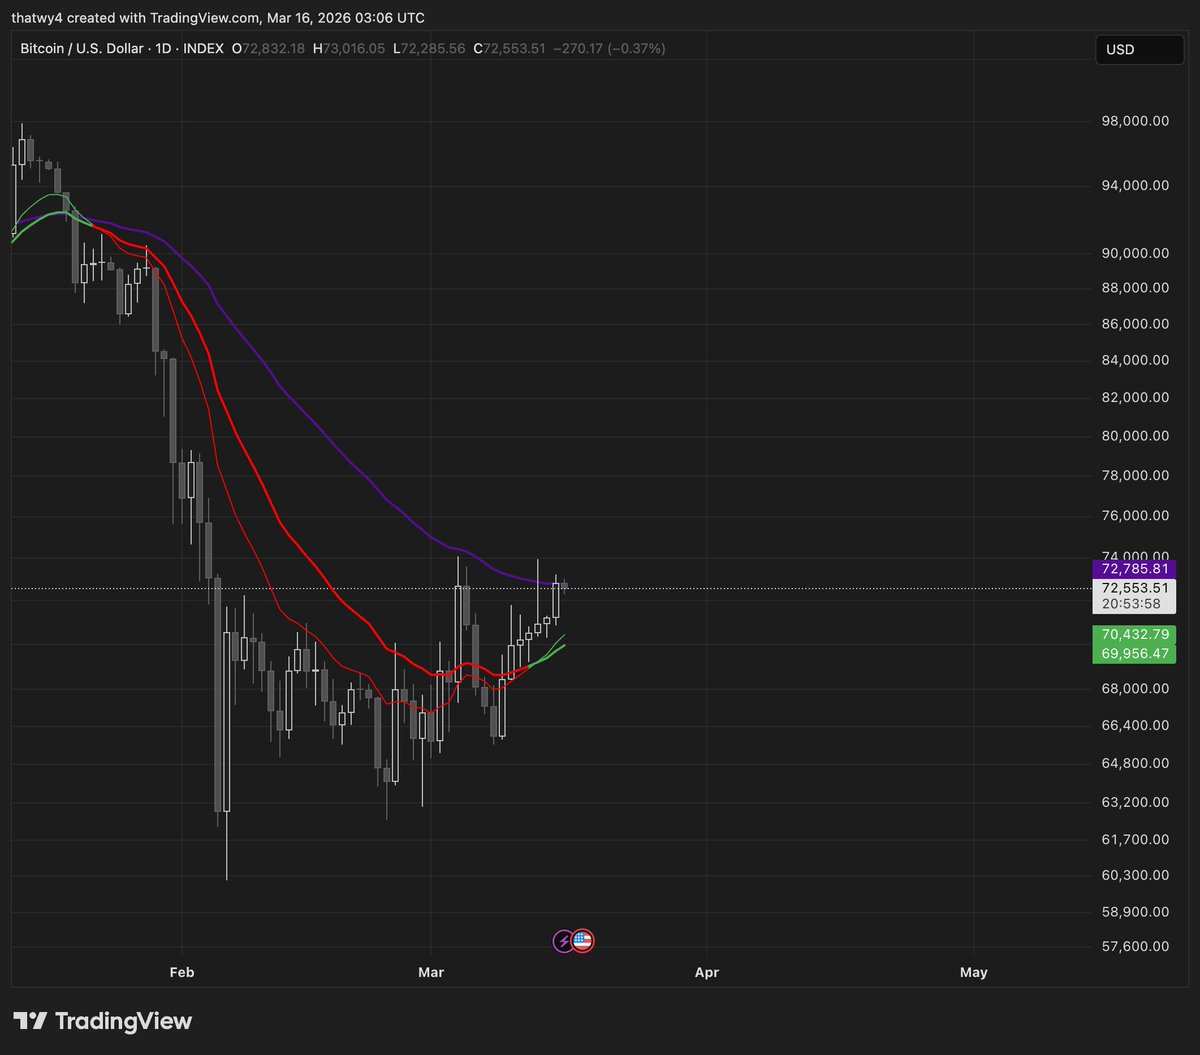
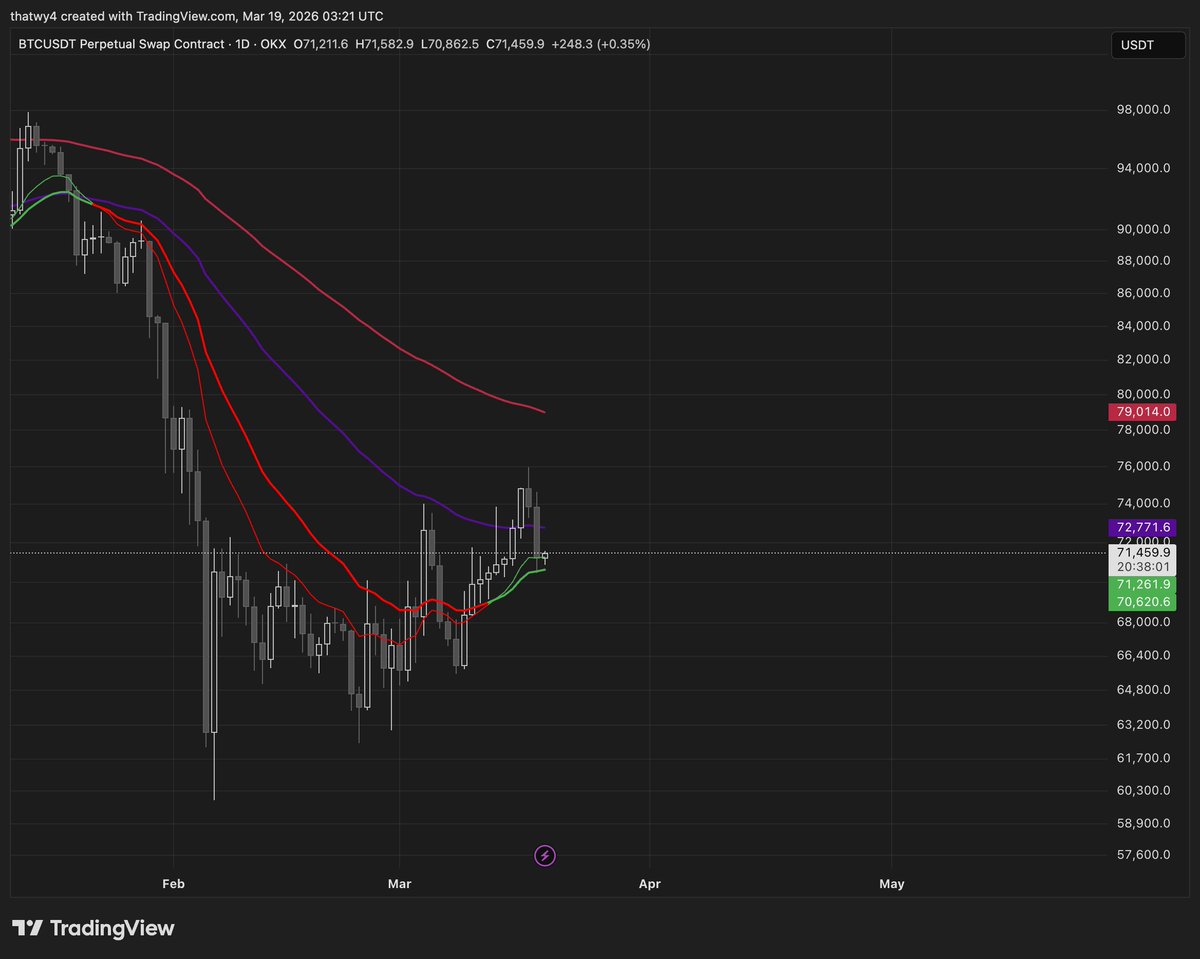
Looking at Bitcoin: it has broken above Monday’s high and, after clearing the 50-day EMA, continued pushing higher toward liquidity around 72K. Around this level, Bitcoin is also testing the lower band of its weekly EMAs. Notably, when this same level was tested three weeks ago, price did not make a new low, suggesting that the previous downward trend was starting to lose its influence.
There is a reasonable chance that Bitcoin could extend further toward the liquidity zone near 76K. However, that move is unlikely to happen immediately. Given the sharp and aggressive nature of the recent rally—driven by short squeezes and leaving gaps behind—it’s likely that the initial move will face selling pressure. A pullback or period of consolidation is therefore probable before any sustained attempt to move higher again.
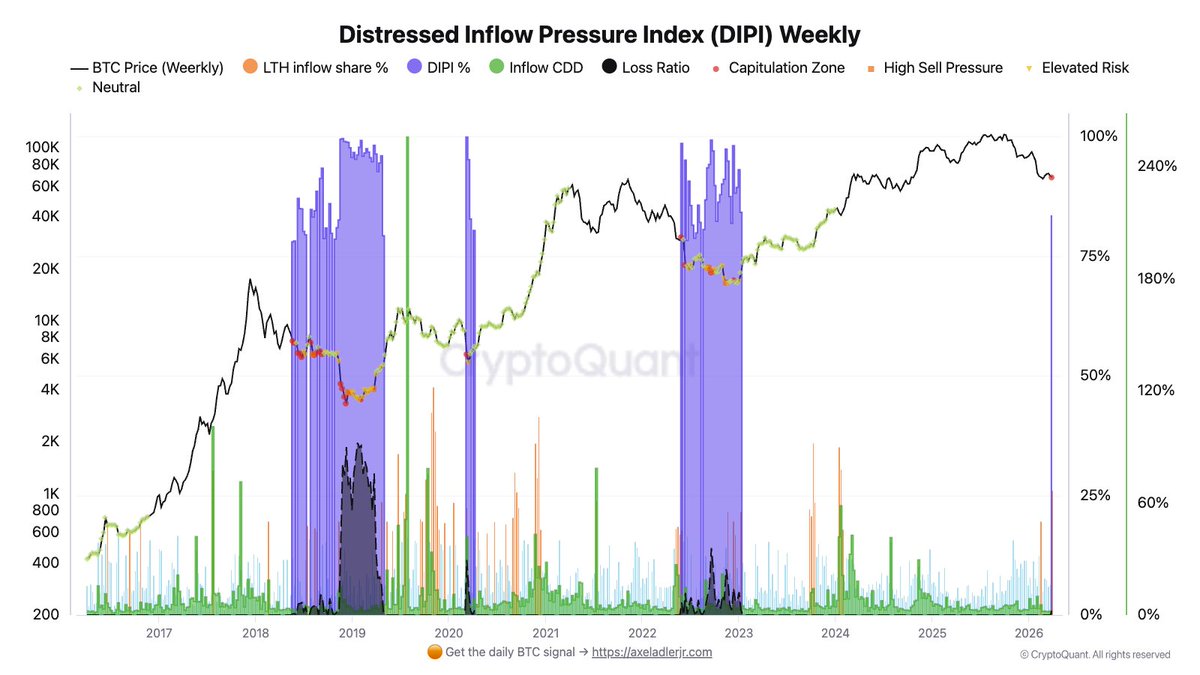
DIPI measures Bitcoin market stress by combining selling pressure, realized losses, and long-term holder activity. It increases when a large amount of coins—especially older ones—flow into exchanges and are sold at a loss. High values signal capitulation and extreme distress, which often occur near market bottoms.
Right now, the indicator is reaching levels similar to past stress events like 2018, 2020 (COVID), and 2022. While this reflects intense market pressure, these conditions have historically marked late-stage capitulation rather than the beginning of a prolonged decline, so it’s not necessarily a cause for concern.
Bitcoin still showing strong upward pressure.
End-of-month flows tend to support price, and with a new month starting, directional moves are likely. As long as BTC holds above 67K, continuation higher into early April looks probable.
There’s an untested order block around 70.3K from the previous breakdown, and price has already filled one daily gap from last Friday. Another gap sits into that 70.3K zone, aligning with the 50 EMA near 71K.
Bias remains to the upside — looking for longs unless clear rejection shows up.
This day overall came up with a retest of the daily EMA bands, which may be the beginning of a daily downtrend confirmation. We have made lower highs and lower lows in the daily, now also with a retest and falling back below the weekend highs of 67.2, closing the day below 67 as well. Today is the last day of the month, and typically the beginning of next moves goes off the monthly open. Directionally, we're already leaning lower, so the key to see how it trades tomorrow within its range, likely the next move begins Wednesday. We're snapping though, it is green, did close green. So relatively, fairly strong.
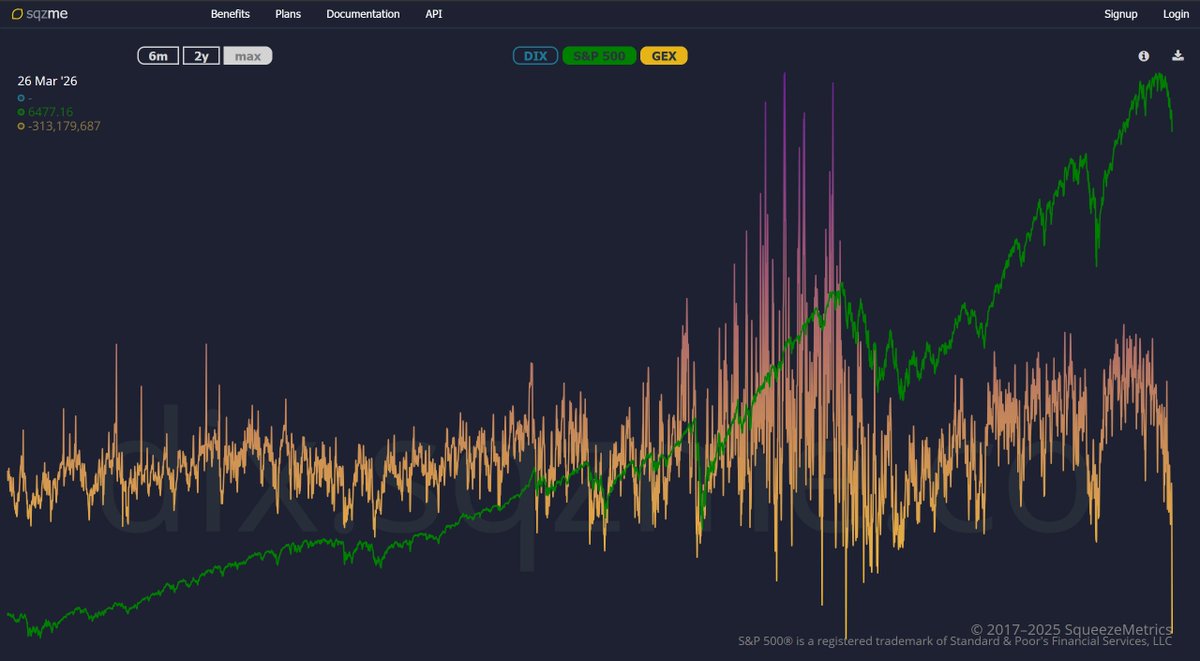
Second lowest reading of all time, typically correlated to price; so when GEX is low you buy the dip. However what you will notice is that the lowest reading of all time happened right as the market fell off a cliff. If the prevailing market conditions are anything which could blow up the AI CAPEX bubble, then this could actually be a repeat of the same situation and it precedes a bear market in stocks.
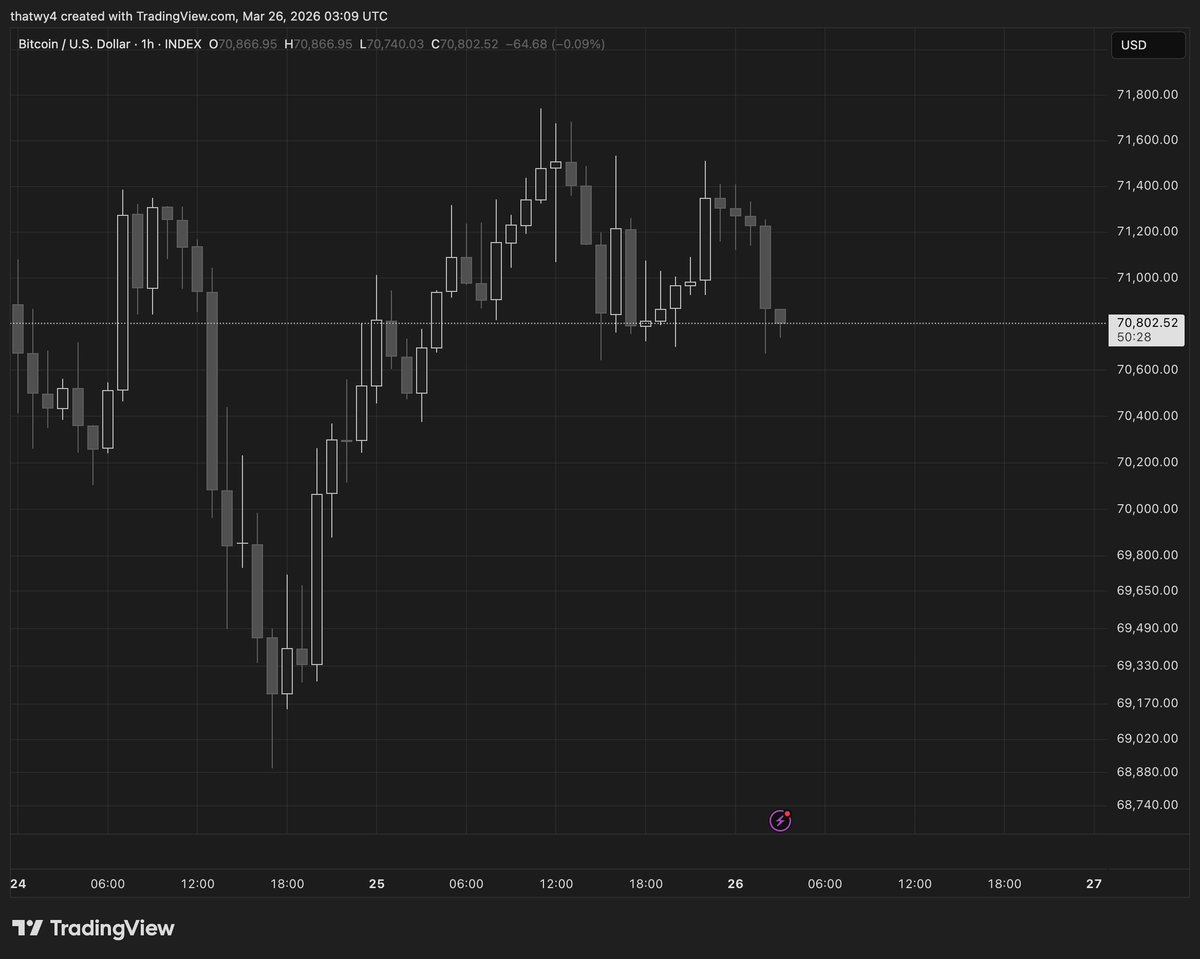
Market's down in the session so far, with Bitcoin and stocks selling off after this headline came out about Iran rejecting peace deal proposal, putting forward their own recommendations. Price didn't drop right on the headline, so it wasn't an instant news reaction.
Moreso, just price and positioning rather than the news itself, as oil rallying after a LTF double bottom, the dollar failing to break through 99 multiple times also rallying, and Bitcoin rejecting after a sweep into 72K, with QQQ hitting resistance as well. This move is more so about that than it is about any specific headlines for now.
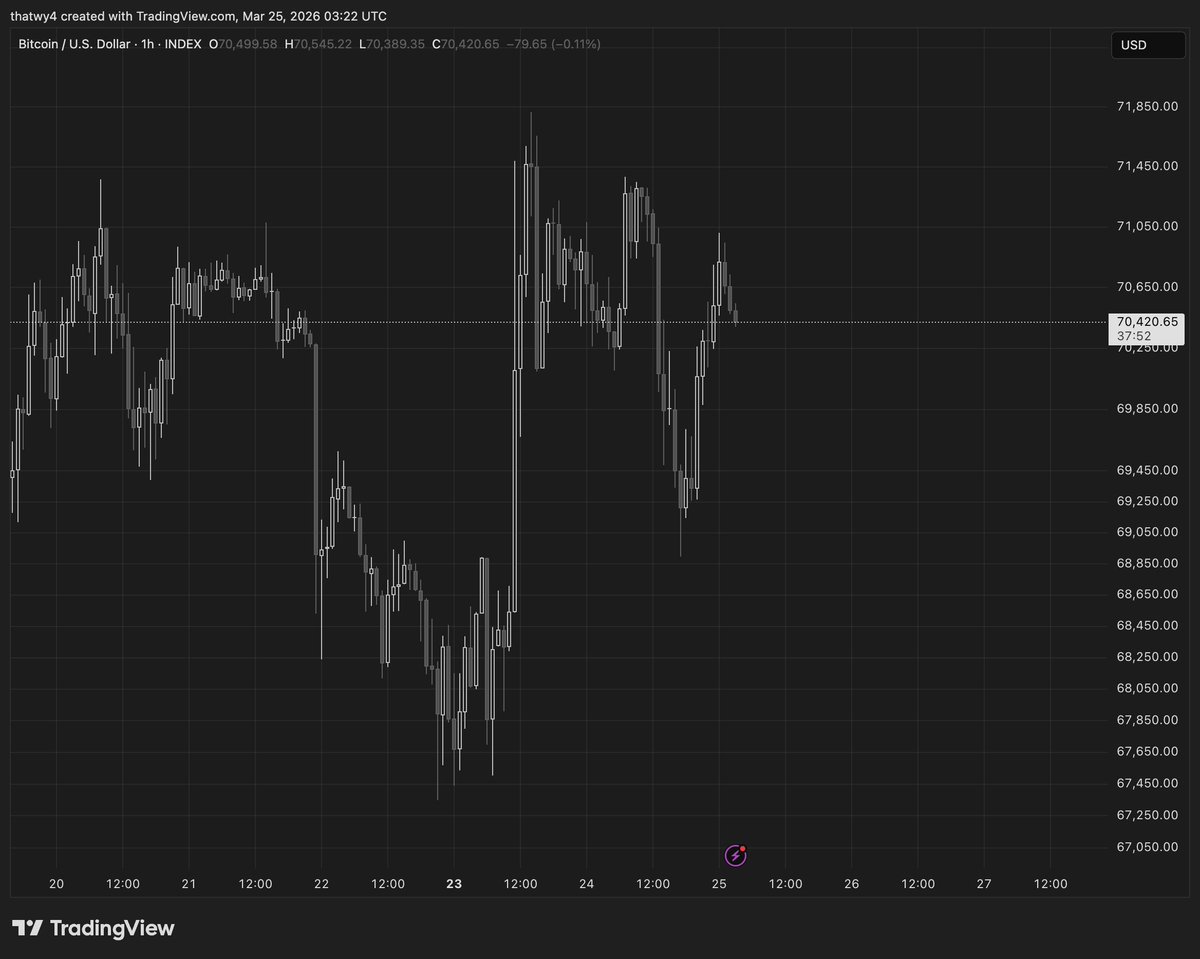
Bitcoin has been trading much like it has over the past few weeks—showing strong resilience, holding its ground, and avoiding consecutive lower lows. This suggests a lack of real strength in short-term downtrends. At the same time, upward moves haven’t seen sustained follow-through either. If BTC continues to hover around the 70K level without breaking lower, it’s likely to make another push toward 75K. It’s also important to note that we’re approaching both month-end and quarter-end options expiry on Friday at 8 a.m. UTC, with 70K and 72K representing key open interest levels. Given this, it would be typical for price to stay range-bound between these levels. Recently, BTC faced resistance below 72K, while also holding above 70K since breaking past it late yesterday. Unless a strong external catalyst drives the market, Bitcoin may continue to trade within this range through Friday.
The move looks solid overall. Price has mostly filled the gap and pulled back to retest the level from before Monday’s impulse move, just below the 69K area, and then put in a strong reversal. At the same time, the market got an additional boost from the ceasefire headlines. Whether that actually happens is questionable, but the market doesn’t really need it to be real — it just needs a reason to move higher. There were also reports that insider buying showed up right before the Monday pump, which suggests this move may have been driven intentionally rather than forming organically. In this kind of environment, it’s clear the market is being pushed in one direction, and there’s usually no point in fighting the tape.
What's most interesting about Bitcoin today: it stayed green on a day when the big moves were all about de-escalation.
Oil red, dollar red, stocks gapped up and finished higher — yet BTC still pushed higher.
Throughout this entire conflict, Bitcoin has been making higher lows. Bad war news didn’t crush it. Now good news (potential ceasefire) comes out and it’s green again.
That’s not just risk-on noise. That’s genuine strength.
If we reclaim $72K–$73K, $80K is back on the table.
Most importantly — whether Trump’s comments are real de-escalation or just talk — the bottom likely formed on Friday either way.
Expect days or even weeks of upside from here.
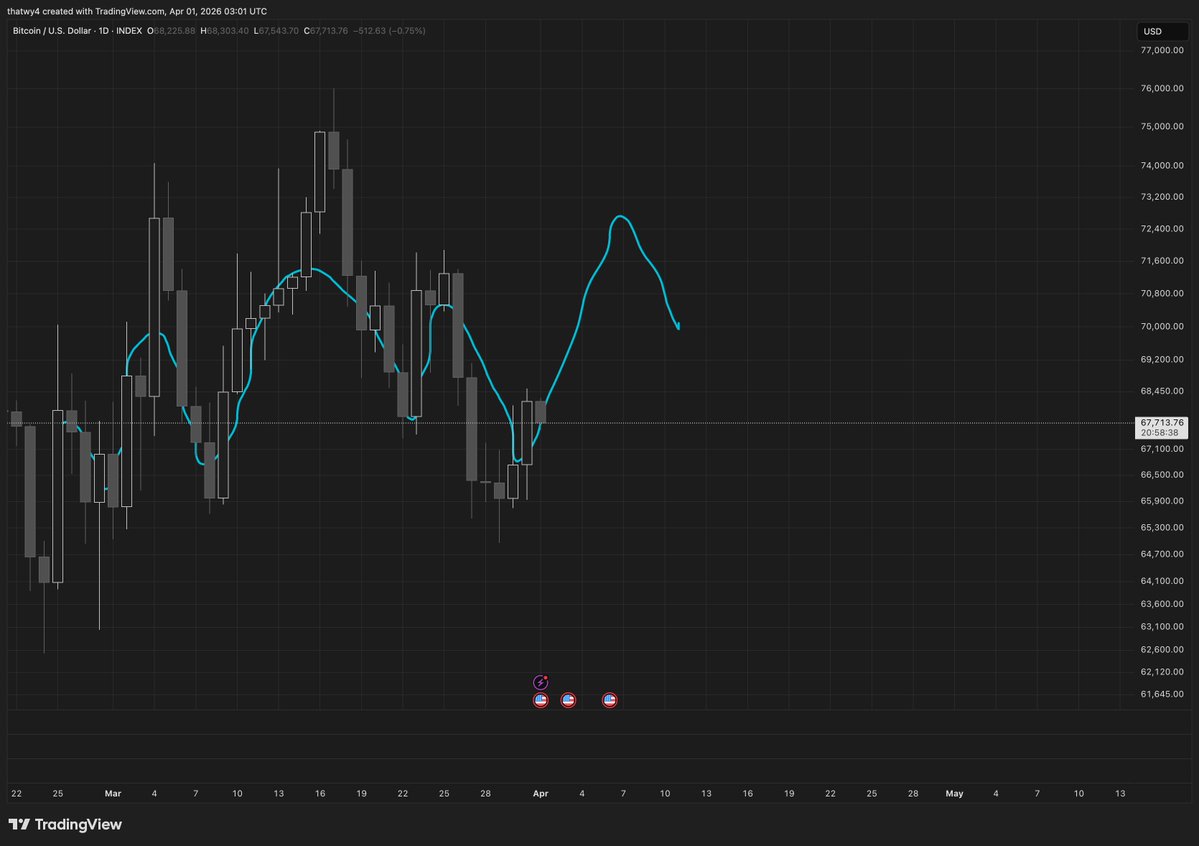
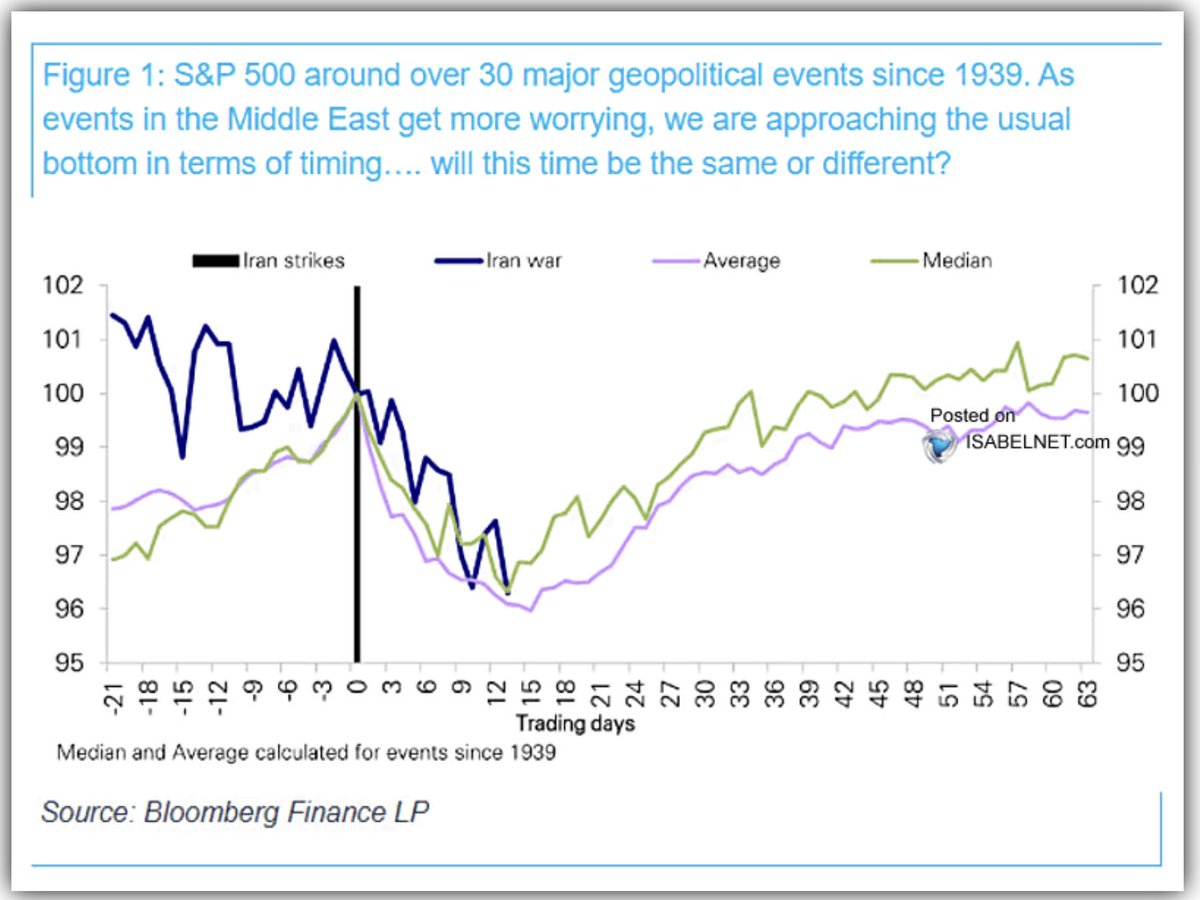
This Deutsche Bank chart (via Bloomberg) tracks the S&P 500's reaction around more than 30 major geopolitical events since 1939. The purple line shows the average path, the green line the median — both typically see a sharp dip of ~4-5% in the first 10-20 trading days after the shock, followed by a steady recovery that often returns to or above pre-event levels within 1-2 months. The current Iran strikes/war path (blue line) is aligning almost exactly with this historical pattern so far, suggesting we're now approaching the usual "bottoming window" in terms of timing.
The United States has so far provided roughly $1 billion per day in funding for this war, a scale that suggests Washington is preparing for a conflict lasting at least six months (or until the next supplemental appropriation). A $200 billion budget is not a figure for a short-term operation—if the expectation were that the war would end soon, such a funding request would make no sense at all. Markets will quickly price in this reality and enter a prolonged risk-off phase: energy stocks will benefit from a supply-disruption premium and look bullish, the dollar will strengthen due to safe-haven demand and fiscal pressure, while growth and tech stocks will face downward pressure from uncertainty, rising rate expectations, and fiscal crowding-out effects.
This appropriation still requires Congressional approval, which will inevitably turn into a public vote on “whether to continue supporting the war,” with both parties engaging in fierce debate, proposing amendments, and engaging in prolonged wrangling. If Congress is about to spend weeks arguing over hundreds of billions of dollars, the narrative that the war will “end soon” becomes highly implausible. Every day of escalation on the front lines further dismantles this optimistic view. The only scenario in which such a massive appropriation would make sense within a short-war framework is if it is a deliberate bluff—signaling to adversaries (e.g., Iran) that the U.S. is prepared for a long fight in order to force concessions. While possible, this is not the most likely explanation. The far simpler and more direct reality is that the war has already begun, and the incentives—military-industrial, geopolitical, and domestic political—are now strongly aligned toward prolonging the conflict.
The $70.5K and $79.5K levels represent the current range extremes. We anticipate neither will see a decisive breakout prior to Friday's options expiry.
That said, several factors could invalidate the $70.5K support: Bitcoin's recent upside attempt failed convincingly, and the retracement is only two days old. Coupled with the bearish post-FOMC reaction and equities closing at session lows, sustained risk-off selling remains a real threat. A breach of the key $70K psychological level would likely accelerate liquidation flows and drive deeper downside, especially as the daily chart shows Bitcoin has already lost the 50-day moving average and is now testing the lower EMA12/21 Band—with a break below increasingly probable.
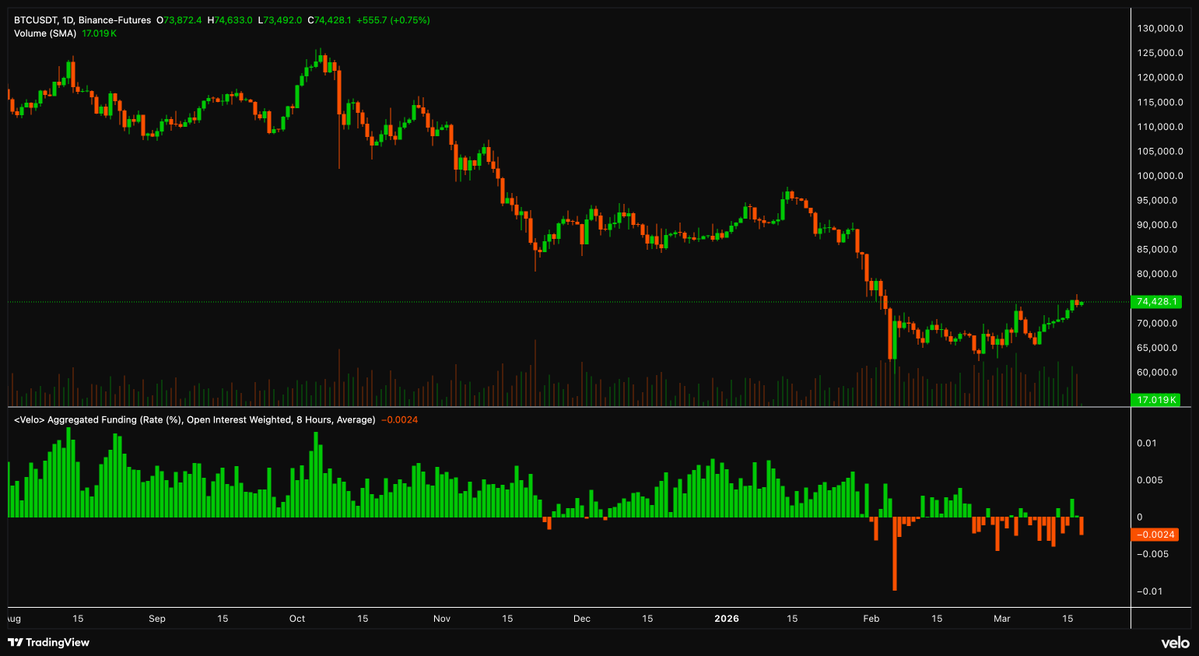
The persistently low-to-negative funding environment, combined with the recent price recovery toward the $74k area, suggests that short positions remain dominant but are not excessively crowded. This setup carries classic short-squeeze potential: any sustained upward momentum could force incremental liquidations on the short side, amplifying the move as longs receive funding payments while shorts bleed. Sentiment indicators, including 30-day funding rate percentiles sitting in the low single digits, reinforce that the derivatives market is still positioned overwhelmingly for downside continuation rather than euphoria.
Overall, the current aggregated funding rate signals a balanced-to-cautiously bullish contrarian setup in the near term—neutral enough to avoid immediate overheating on the long side, yet skewed sufficiently negative to reward patient longs if spot price holds or grinds higher. Traders should monitor for any shift toward sustained positive rates (e.g., > +0.005% consistently), which would signal building long conviction and potential overextension risk.
Goldman Sachs highlights the long-term relationship between the S&P 500 and forward EPS, showing that as long as earnings continue to expand, the index can keep trending higher. Current estimates put EPS at about $246 in 2024, $275 in 2025, $309 in 2026, and $342 in 2027, implying the S&P 500 could reach ~7600 by 2026 if valuation multiples remain stable. The bullish case is therefore not about momentum, but about earnings staying strong and financial conditions not tightening materially.
This matters for crypto as well. Over the past cycle, Bitcoin and the broader crypto market have shown a clear positive correlation with the S&P 500, especially during liquidity-driven moves. When earnings are rising, risk appetite improves, equities move higher, and crypto tends to follow as global liquidity expands. When rates rise or earnings expectations fall, both equities and crypto usually reprice lower at the same time.
If the current EPS trajectory holds and macro conditions remain supportive, the setup suggests continued strength in U.S. equities and a constructive environment for crypto. As long as the S&P 500 stays in an earnings-driven uptrend rather than a multiple-compression regime, the broader risk cycle remains intact — which is why we remain structurally bullish on both equities and digital assets into the next phase of the cycle.
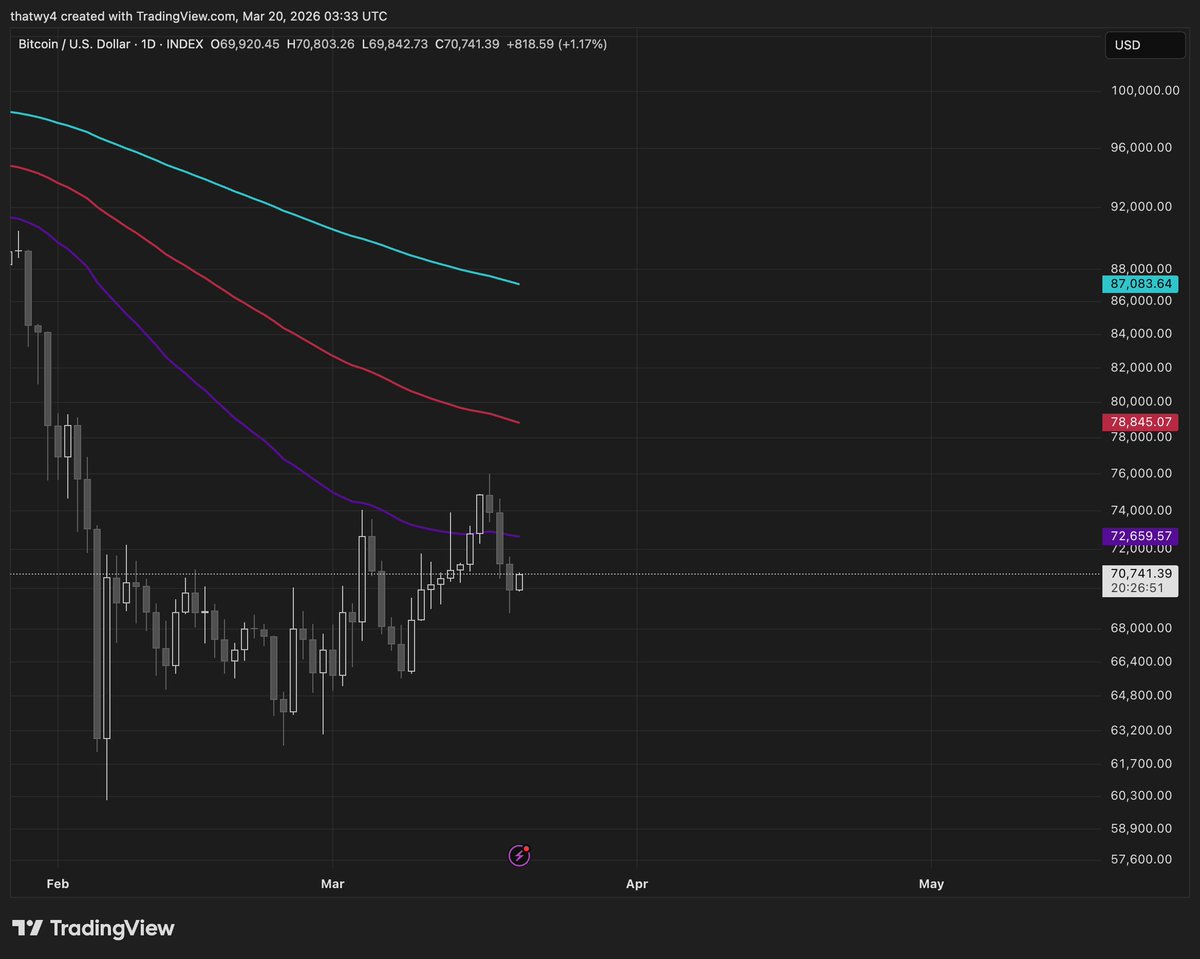
Solid weekly close for #BTC, printing just under $73K — marking the highest weekly level in five weeks and forming an equal high on the daily timeframe compared to last week.
On the daily chart, price closed marginally below the 50-day EMA while continuing to tighten in an upward-sloping compression zone between the EMA 50 and the upper daily EMA 12/21 Bands — classic consolidation with bullish bias building.
If broader risk markets stage a rally this week, Bitcoin has strong momentum to take out $75K with relative ease.
The real test comes post-breakout: will it hold and confirm, or see an initial rejection before continuation?
#Bitcoin #Crypto #BTCUSD