$SOFI Weekly Chart w/ Gann Square.
It continued correcting after hitting the arc. I don't think it's necessary to backtest the horizontal again as there's plenty of support before that.
The Gann arc breakout remains the main point to watch.
$CLSK Weekly Chart w/ Gann Square.
Formed an ugly candle after getting rejected at the horizontal. The angle is located right below and could provide support.
$MARA Weekly Chart w/ Gann Square.
Nothing changed in this week. Still hovering in the void between the arc and horizontal, which remains the main goal. Can't rule out another backtest of the arc, though.
$IREN Weekly Chart w/ Gann Square.
Price pushed above the horizontal and backtested it as support. In theory, the next goal would be the arc at around $12.
$HOOD Weekly Chart w/ Gann Square.
It continues to march towards the next arc at around $100, the magic number (and potential target). I wouldn't rule out a backtest of the arc or angle at around $52, which would not be an issue at all given it holds as support.
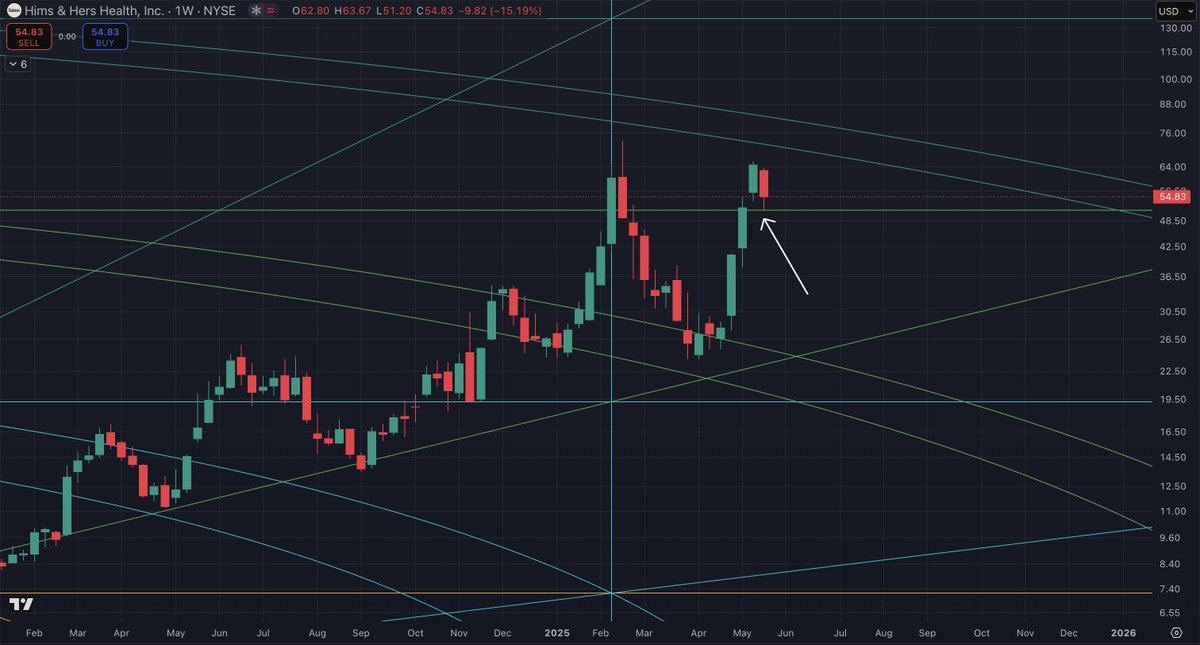
$HIMS Weekly Chart w/ Gann Square.
It backtested the horizontal as support almost to the cent. Beautiful confluence here. It's important to see how it behaves this week and if it manages to hold that support.
Crypto Fear & Greed Index on the verge of "Extreme Greed".
This is the territory to be careful. Don't let emotions affect your investment decisions.
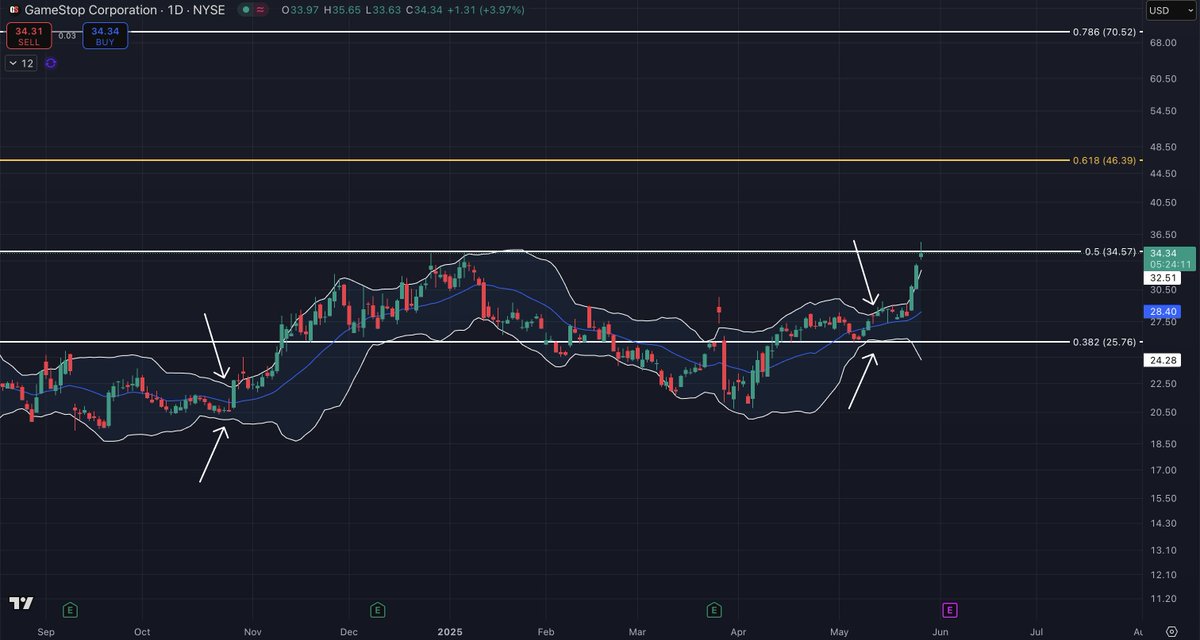
On April 18, I called $GME to move to the 0.5 log Fibonacci level if it breaks above the weekly 20SMA.
Now, it has proceeded to move towards the target and ultimately hit it today. It's a strong resistance level, which is why I don't expect a breakthrough this week.
$GME Daily Chart Update.
Did you pay attention? Because the move continued, both Bollinger Bands expanded further, and the 0.5 log Fibonacci has been hit.
I think it wants to cool down here now.