🚨 BLACKROCK’S $1B BITCOIN ETF OUTFLOW MAY BE A BIGGER WARNING SIGN THAN PEOPLE REALIZE
A new report highlights heavy weekly crypto ETF outflows, including roughly $1 billion exiting BlackRock’s Bitcoin ETF as capital rotation continues across the crypto market.
Why this matters:
The key issue is not just the outflows themselves.
It’s what’s happening underneath the surface:
spot demand is weakening
leveraged positioning remains elevated
and capital is rotating away from BTC/ETH dominance into higher-risk areas of the market
That creates a much more fragile liquidity setup.
Over the last few months, Bitcoin’s strength was heavily supported by institutional ETF inflows and spot accumulation.
If those flows begin slowing while derivatives exposure stays elevated, markets become increasingly vulnerable to:
volatility spikes
liquidation cascades
and sharper short-term corrections
The bigger picture:
This may be one of the first real signs that crypto liquidity conditions are starting to shift beneath the surface even while prices remain relatively elevated.
FINAL DRAFT OF U.S.–IRAN AGREEMENT REPORTEDLY REACHED🚨
Iranian State media says the final draft of a U.S.–Iran agreement has been finalized with mediation from Pakistan and could be officially announced within the next few hours.
Why this matters:
Markets have been heavily focused on:
Middle East escalation
oil supply risks
Strait of Hormuz stability
and inflation pressures tied to energy markets
A confirmed agreement could rapidly shift:
oil prices
bond yields
dollar strength
and broader global risk sentiment
The biggest thing markets will now watch:
Whether the final terms include long-term guarantees around:
Hormuz access
sanctions relief
and Iran’s nuclear program.
FOMC MINUTES JUST DROPPED 🚨
A CLEAR MESSAGE: THE FED IS NOW FAR MORE WORRIED ABOUT STICKY INFLATION THAN MARKETS MAY REALIZE
The April FOMC Minutes revealed a Federal Reserve that is becoming increasingly cautious about cutting rates too early as inflation pressures continue building across the economy.
The biggest concern throughout the minutes:
Energy-driven inflation from the Middle East conflict is beginning to spread deeper into the economy.
Officials specifically highlighted:
- rising shipping costs
- higher airfares
- supply chain disruptions
- fertilizer inflation
- and increasing technology-sector prices tied to the AI boom.
This is important because the Fed is no longer just talking about temporary oil inflation.
They are now openly discussing the risk that inflation could become embedded across wages, pricing behavior and broader business costs.
The Minutes also showed a significant shift in tone around rate cuts.
Markets had previously expected easier policy later this year, but the Fed now appears much more hesitant.
In fact:
- several officials suggested rates may need to stay higher for longer
- a majority warned inflation could remain above 2% for an extended period
- and many participants even discussed the possibility that additional tightening may eventually be needed if inflation stays elevated.
At the same time, the Fed acknowledged growing downside risks in the labor market.
Officials noted:
- slowing hiring
- weaker job availability
- rising business uncertainty
- and concerns that AI adoption could reduce future labor demand.
This is creating a difficult balancing act for the Fed:
▶️ Inflation remains too high
▶️ Energy prices are adding pressure
▶️ Growth is still holding up
▶️ But labor market risks are slowly rising underneath the surface
One of the most important parts of the Minutes was the discussion around liquidity and financial stability.
The Fed specifically highlighted:
- elevated asset valuations
- growing leverage in hedge funds
- private credit stress
- and risks tied to highly leveraged Treasury trades.
That matters because liquidity conditions across the financial system are becoming increasingly fragile beneath the surface even while equities remain near highs.
The broader message from these Minutes:
The Fed is not close to aggressively easing yet.
And unless inflation cools meaningfully or the labor market weakens sharply, markets may need to continue adjusting to a higher-for-longer liquidity environment.
WHAT HAPPENS NEXT IF THE CLARITY ACT PASSES SENATE BANKING TODAY?🚨👇
If the Senate Banking Committee approves the bill, it does NOT go straight to Trump’s desk yet.
Here’s the likely path from here:
1️⃣ The bill would move toward a full Senate vote, where lawmakers debate amendments and final language.
2️⃣ The House and Senate versions would then likely need reconciliation to align differences between both chambers.
3️⃣ Once both chambers pass the final unified version, it would head to the President for signature.
The timeline is the key thing markets are watching now.
If momentum stays strong and institutional support continues building, crypto markets could realistically see:
Senate floor movement in coming weeks
reconciliation over the summer
and potential final approval later this year
The bigger picture:
Today’s vote is important because it signals whether Washington is moving from “crypto debate” into actual market structure implementation.
That’s the phase institutions have been waiting for.
The Iranian demands have gone from reasonable, to almost impossible for Trump to accept
If the latest reports from Iran are true, Iran wants to:
- Not concede on their ballistic missile program and proxy network (fair, expected)
- Control the Strait of Hormuz and charge a fee, as well as ban some countries (maximalist, but workable)
- According to Bloomberg: Reparations (This is impossible for Trump to accept)
- Unfreezing of assets and lifting of sanctions BEFORE any negotiations on nuclear program (That's according to Iran's Fars. If true, that would be a deal breaker, as logically the lifting of sanctions was always a concession linked to the nuclear program, similar to the JCPOA)
If the above reports are true, then the likelihood of war is even higher than 50%. However it's impossible to know what Iran's actual stance is, and which "conditions" are throw away terms.
Either way, things are not looking good at all.
🚨 IRAN WANTS $100 BILLION RELEASED TO END THE WAR
Iran is reportedly demanding access to roughly $100 billion in frozen assets, an end to the US naval blockade, and a halt to fighting in Lebanon as part of a broader deal with Washington.
The US reportedly rejected the proposal outright, talks broke down, and oil markets reacted immediately.
What this tells you is Iran believes rising energy prices are increasing its leverage.
The longer negotiations fail, the more pressure builds on global oil markets, inflation expectations and risk assets.
GM☕️🌅
A Potentially Volatile Day Awaits In The Markets With US Nonfarm Payrolls Dropping Today (14h30 SAST)📊
Here's Your Numbers👇
▶️ Prev Exp: 65,000
▶️ Prev Actual: 178,000
▶️ Today Exp: 65,000
▶️ Today Actual: ...⏳
Prepare For Volatility🚨
🚨JUST IN: Bank of Canada says stablecoin regulations could launch by 2027.
This is another sign governments are no longer asking if stablecoins will become part of the financial system, but how they will regulate them.
The global race to integrate digital dollars into banking, payments, and capital markets is accelerating.
For years, Michael Saylor built his entire identity on one idea:
Never sell Bitcoin.
Last night, that narrative cracked.
On Strategy’s Q1 2026 earnings call, he admitted the company will likely have to start selling.
That’s a complete shift from what he’s been preaching since 2020.
Here’s the reality behind it:
Strategy now holds 818,334 BTC at an average price of $75,537
→ That’s $61.8 billion deployed over nearly 6 years
With Bitcoin sitting around $81K, the entire position is only up about 7%
That’s roughly ~1% per year
Meanwhile:
S&P 500 averages ~10% annually
Bitcoin itself is up 700%+ over the same timeframe
So what went wrong?
They bought aggressively at every level — no pacing, no cost control.
That pushes your average higher and higher… until there’s no margin of safety left.
Now layer in the real pressure:
Strategy issued a preferred stock (STRC) paying 11.5% annually
That’s $1.5 billion in dividends they must pay every single year — regardless of market conditions.
And when Bitcoin dropped from $87K → $68K in Q1:
→ Strategy posted a $12.5 billion loss
→ The biggest in company history
This is the trap:
When you mix conviction with leverage and fixed obligations, you lose flexibility.
And now Saylor is being forced to do the one thing he said he never would…
Sell Bitcoin to fund a structure his own company created.
ETF FLOWS TELL THE REAL STORY🚨
Last week wasn’t about money leaving crypto — it was about where it rotated. BTC ETFs saw +$153.87M in inflows while ETH, SOL and XRP all recorded outflows. That’s not bearish on crypto overall — it’s defensive positioning.
Institutions are still allocating capital, but instead of taking risk across alts, they’re concentrating into Bitcoin as the most liquid and safest exposure. This is classic risk-off behaviour during periods of macro uncertainty.
The result is liquidity compression — capital tightens around BTC, driving dominance higher while altcoins get starved of flow. And since alts rely on excess liquidity and risk appetite, they tend to underperform in this environment.
Bottom line: liquidity didn’t leave the market — it rotated, concentrated, and became defensive, favouring Bitcoin until conditions shift.
Coinbase just unlocked something big in Australia👇
Coinbase is now enabling crypto access for self-managed retirement funds (SMSFs).
That’s ~664,000 funds controlling over AU$1 TRILLION.
Let that sink in.
This isn’t retail punting memes.
This is long-term, sticky capital getting direct access to crypto inside retirement structures.
And here’s the shift most people are missing:
Retirement money doesn’t trade narratives…
It allocates.
Slowly. Systematically. Over time.
That’s the type of liquidity that builds markets, not just pumps them.
Zoom out:
OKX already moved into this space
Regulation in Australia is getting clearer
The U.S. is opening retirement systems to crypto as well
This is not a one-off headline.
It’s infrastructure being built for capital to flow in.
Everyone’s watching price…
But the real story is access.
And access is expanding fast.
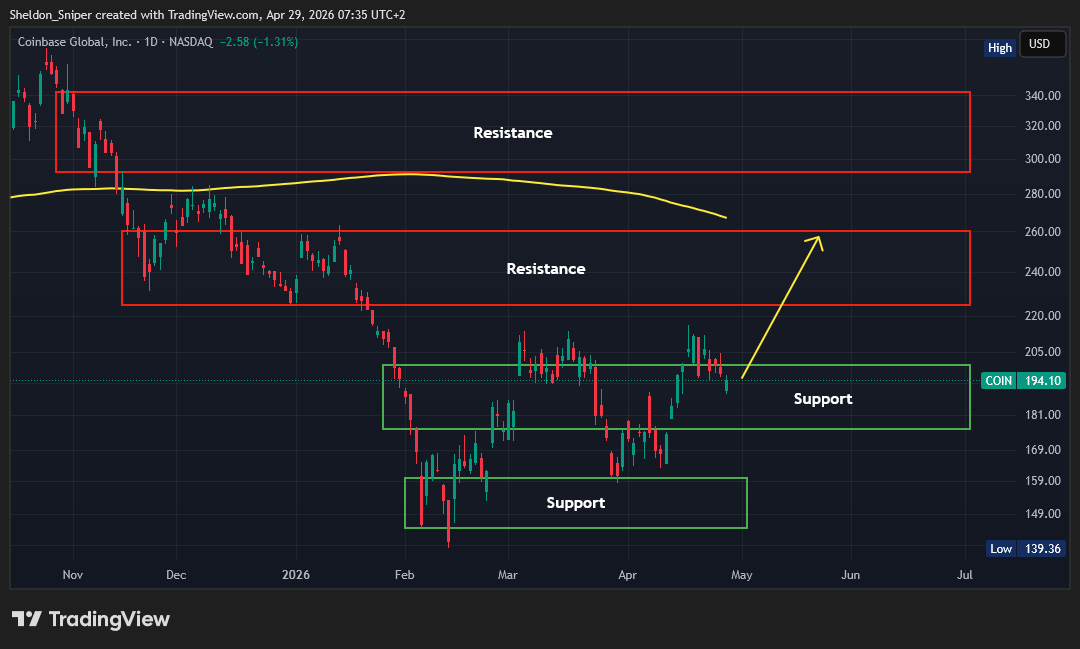
$COIN 1D Chart🚨
Coinbase is currently testing a key support level, and with potential upside in Bitcoin, this provides an opportunity to enter a long position for continuation higher.
▶️ Entry – Enter a long spot trade at around $192
▶️ 1st TP - $224 - $260 (17% - 35%)
▶️ 2nd TP - $290 - $340 (51% - 77%)
▶️ SL – Just below $175
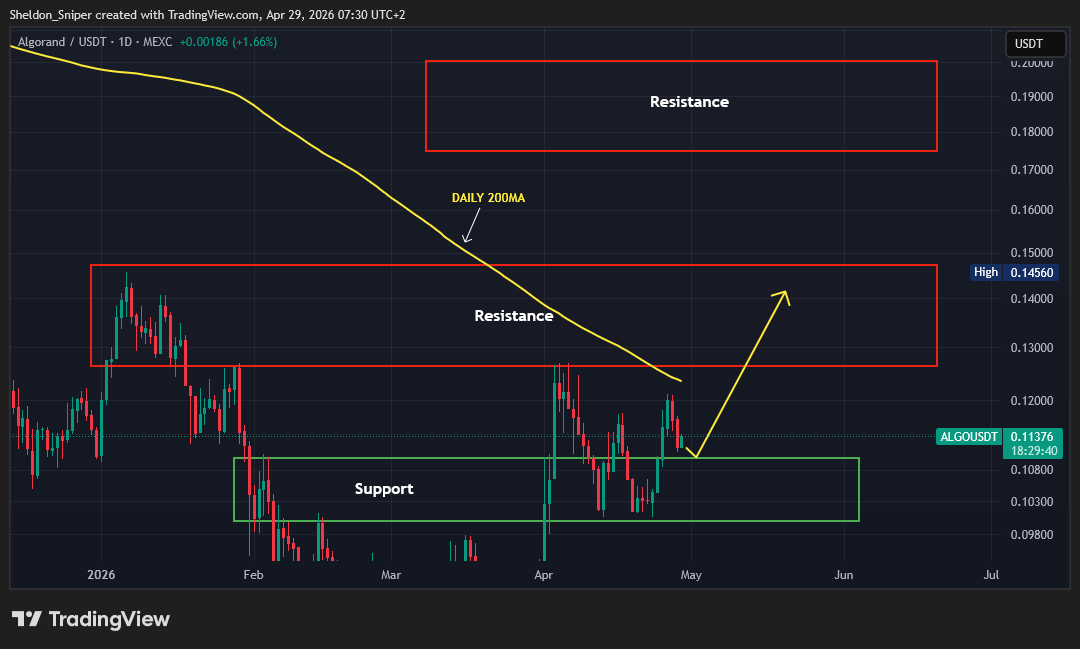
$ALGO 1D Chart🚨
ALGO has been retracing over the last few days and is now approaching a key support level, which provides an opportunity to enter for the next move higher.
▶️ Entry – Enter a long spot trade at around $0.11
▶️ 1st TP - $0.126 - $0.147 (15% - 34%)
▶️ 2nd TP - $0.175 - $0.20 (59% - 82%)
▶️ SL – Just below $0.103
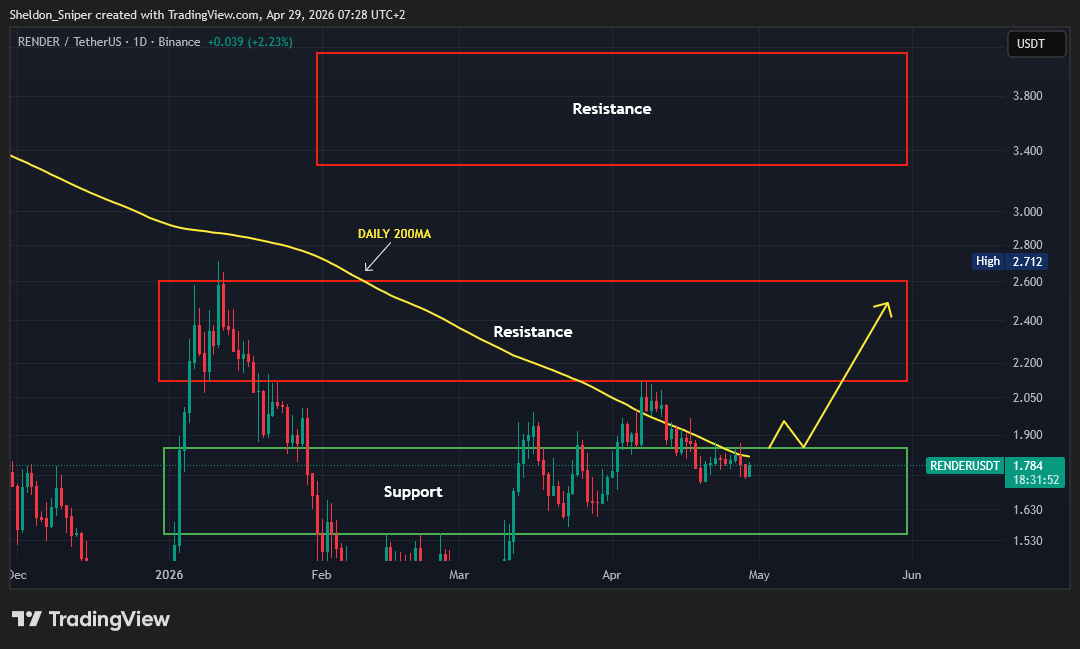
$RENDER 1D Chart🚨
RENDER is approaching a key resistance level, and we are looking for a break and positive retest to confirm support before entering a long swing position.
▶️ Entry – Enter a long swing trade at around $1.85
▶️ 1st TP - $2.12 - $2.60 (15% - 41%)
▶️ 2nd TP - $3.30 - $4.10 (78% - 122%)
▶️ SL – Just below $1.63
$DOGE 1D Chart🚨
DOGE has been showing strong bullish momentum and is approaching a key resistance level. A break and retest of this level would provide confirmation for continuation higher.
▶️ Entry – Enter a long spot trade on the break and retest of the $0.103 level
▶️ 1st TP - $0.12 - $0.125 (17% - 21%)
▶️ 2nd TP - $0.135 - $0.155 (31% - 50%)
▶️ SL – Just below $0.095
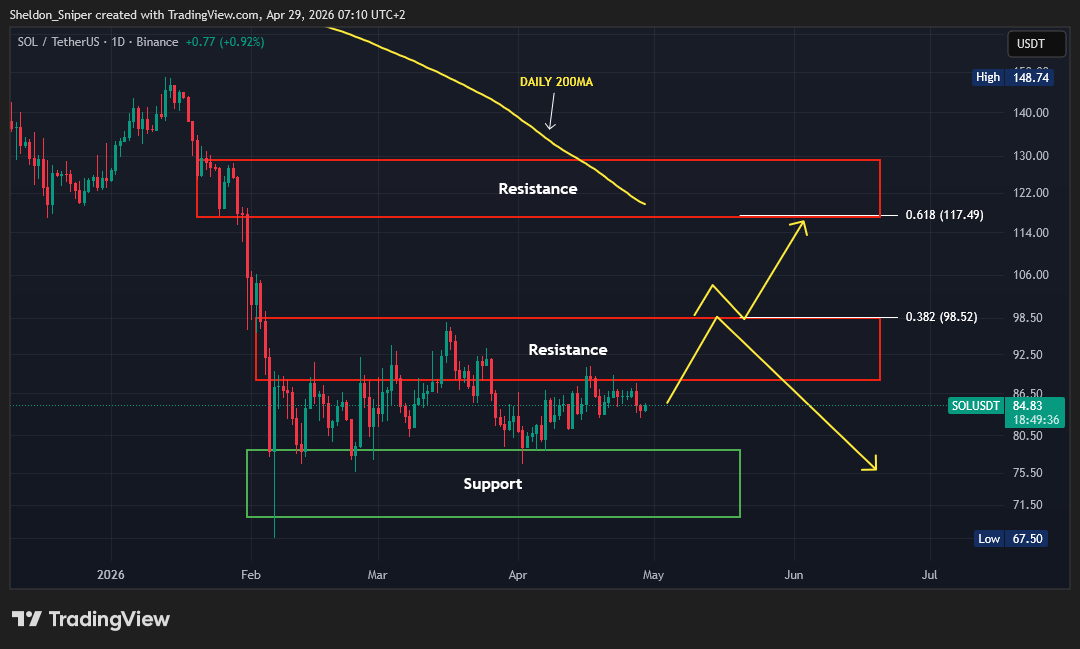
$SOL 1D Chart🚨
The price of SOL has stabilised and found support around the $83 - $84 level. This support zone provides an opportunity to accumulate for the next move higher, especially if market conditions remain favourable.
▶️ Entry – Add to a long spot trade between $83 - $84
▶️ 1st TP - $89 (7%)
▶️ 2nd TP - $98.50 (19%)
▶️ 3rd TP - $117.50 - $130.00 (42% - 57%)
▶️ SL – Just below $80.00
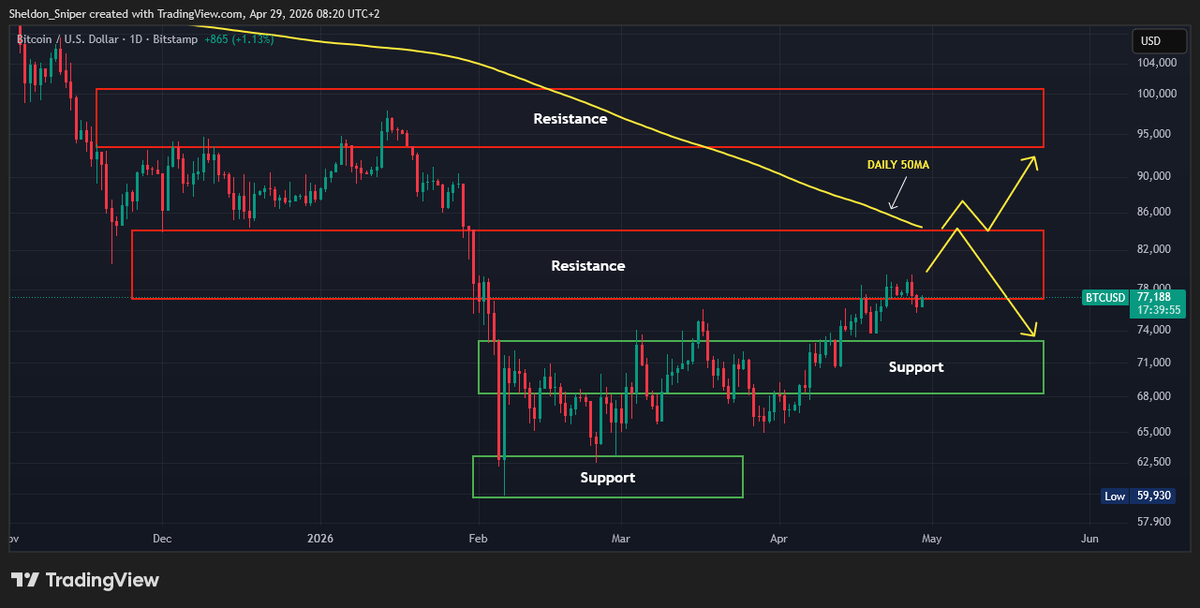
$BTC 1D Chart🚨
Going into tonight’s FOMC meeting, we are keeping a close eye on Bitcoin to see if it can break through the $78,000 – $80,000 resistance zone.
If price is able to push higher from here, the next major target comes in at around $84,000, where the Daily 200 Moving Average is positioned. This level also aligns with a CME gap from the end of January, making it a strong liquidity magnet for price.
There is a significant amount of institutional liquidity sitting at this level, which increases the probability of price being drawn toward it if momentum continues.
However, there is still considerable risk in the market due to ongoing geopolitical tensions and potential weakness in the US stock market. If Bitcoin fails to hold strength and breaks lower, the next key support level comes in at around $73,000.