This month's biggest split between the official numbers & the market: Used cars.
The government’s hedonics-adapted used-car index fell about 2% over the past year. The prices buyers actually met at auction rose about 3% — a swing of roughly 5 percentage points.
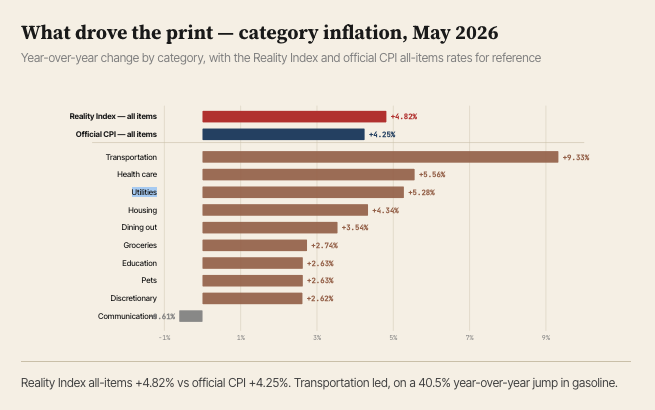
Communications declined 0.61%, the lone category below its level of a decade ago.
Groceries (+2.74%), dining out (+3.54%), discretionary spending (+2.62%), education (+2.63%), and pets (+2.63%) all printed in the mid-2% to mid-3% range.
Read more: https://t.co/Fy9fnzUa2Y
BREAKING: The Reality Index rose 4.82% year over year in May 2026, running 57 basis points hotter than the BLS headline CPI print of 4.25%.
What drove the print
Transportation rose 9.33%, as gasoline prices jumped 40.5% YoY & the broader BLS energy index climbed 23.5%.
This was the single largest contributor to both indices in May.
Health care held its +5.56% line from the KFF Employer Health Benefits Survey baseline.
Utilities rose 5.28%, & housing — the largest weight in the index — rose 4.34%, w/ the renter portion (Zillow ZORI) up 1.73%.
The Reality Index has run hotter than the BLS CPI-U in 110 of 131 months (84%) since January 2015. The mean gap is +122 basis points; the median is +144 bps.
Read more: https://t.co/1BDkxSFCet
The Reality Index — a fixed-weight measure of the prices American households actually pay across 10 categories of everyday spending — rose 4.21% in April 2026 compared with April 2025. The BLS Consumer Price Index (CPI-U), unadjusted, rose 3.81% over the same timeframe.
The Consumer Price Index gets the cheap stuff right and the expensive stuff wrong. The Reality Index measures the gap between what the government reports and what families actually pay. Follow us to get pricing data you can actually trust.