$BULL trade closed ✅
In at $5.80 yesterday, out at $6.39 today = +10.2% in a day.
With the House China report and a possible CFIUS review hanging over it, I’m not holding through the weekend. Taking the win.
@MMatters22596 I agree a drop is coming, just not that far. My chart has it flushing 19–25% and then reclaiming, so I’d be buying that dip rather than waiting for $500. However - anything can happen.
@KobeissiLetter Oil at $96 keeps headline inflation hot even if core cools, so the Fed has less room to wait. Rates are driving this market right now, not earnings.
@spotgamma The options market underpriced how hot core would come in. That's why I called for patience this morning and I'm just watching my support levels instead of chasing the move.
@TheProfInvestor Hot CPI plus failed breakouts is exactly why I'm not adding today, just letting my support levels on $SNDK, $MU and $AAOI tell me if this is a shakeout or a real breakdown.
@KobeissiLetter Cheaper tokens usually mean more usage, not less spending. Even if model margins get squeezed, the demand for chips, memory and networking keeps climbing, which is why I'm positioned in $MU, $SNDK and $AAOI instead of the model makers.
@CKCapitalxx The bottleneck trade is the best part of AI right now. Whoever unlocks power, cooling or bandwidth gets paid before the GPUs do, which is the same reason I'm in $AAOI on the optical side.
@amitisinvesting@gilluria@ProfGMarkets Borrowing at 9% to earn 5% only works if utilization stays near 100%, so the next few contract renewals are the real tell for $CRWV.
NEW POSITION SWING
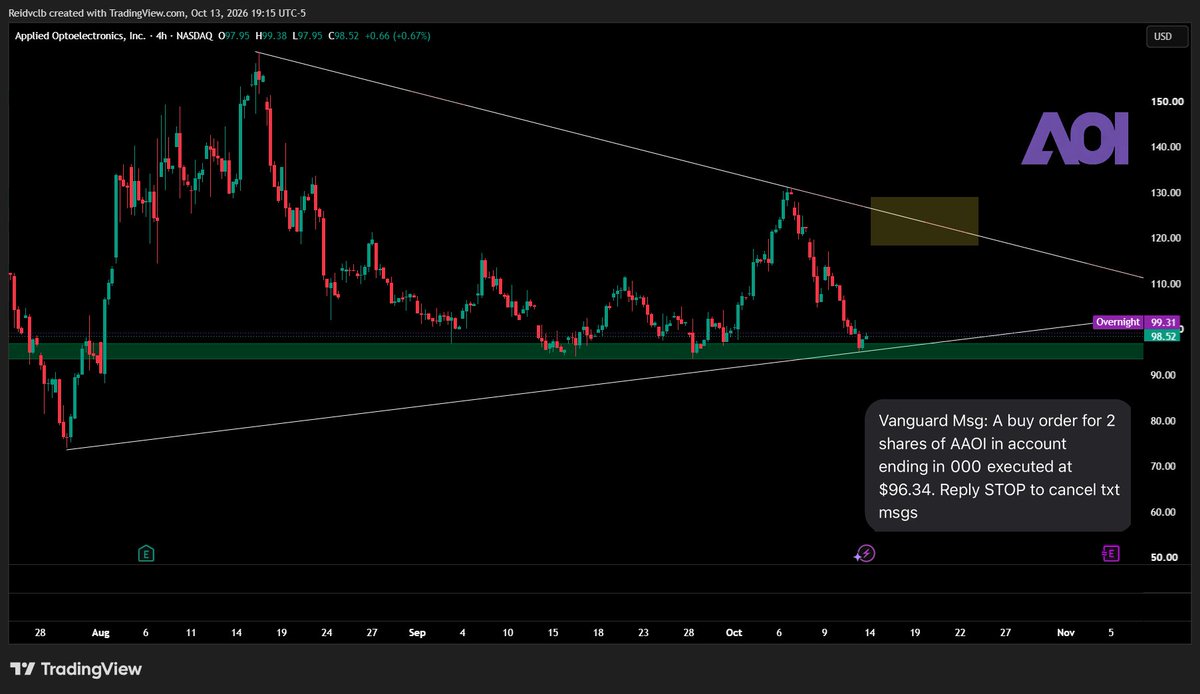
Opened a position in $AAOI, 2 shares at $96.34.
$AAOI is coiling inside a large symmetrical triangle, with lower highs from the $160 August top and higher lows from the $74 July low. Price is now back at the bottom of that range, where the rising trendline meets the $93–$97 support zone.
That zone has held three times since mid-September. The last bounce off it in early October ran all the way to $130, right into the upper trendline.
The highlighted box is the area I’m watching on the upside, around $118–$129, where price would run back into the descending trendline. A break above that line would mean the triangle resolves higher.
If $AAOI closes below the support zone and the rising trendline, the setup is invalid and I’ll reassess.
NFA. My plan for my own money, not a signal to copy.
NEW POSITION SWING
Opened my first $MU position at $948.31.
Same memory-sector dip I broke down in my $SNDK post, so I’m adding exposure to the theme through Micron too.
Price pulled back from the $1,100 highs right into the $927 support, which lines up with the bottom of the rising channel from the August low. The channel has held every pullback since August, with higher lows the whole way up.
As long as $927 and the channel hold, I’m treating this as a dip within an uptrend. A clean break below the channel and I’ll reassess.
NFA. My plan for my own money, not a signal to copy.
NEW POSITION SWING
$SNDK has a rhythm. Since June, almost every pullback has been a sharp 16–25% drop that got bought (highlighted on the chart).
I just opened my first position at $1,442.68. The current dip is about 19%, from $1,729 to $1,399, right in that normal range. It looks a lot like the mid-September pullback, which bottomed in this same area and then ran to a new swing high near $1,900.
Part of this dip is China competition fear after CXMT’s memory chip news. It’s worth noting CXMT is on the Pentagon’s Chinese military company list, and the US government is already banned from buying its chips. Western memory makers like $SNDK and $MU still have a big advantage in the US market. That makes this look like a headline-driven selloff, and those have been bought before.
The structure has also improved since August. The dips are making higher lows: $970 in August, about $1,500 in September, and about $1,400 now. As long as $1,400 holds, this looks like another buy-the-dip setup rather than a breakdown.
If $1,400 fails, I’m comfortable adding more at the daily 200 EMA, currently around $1,240 and rising. That’s the same moving average that caught the August low. Earnings are coming in early November too, so expect volatility.
Watching for a bounce off $1,400, with the $1,800–$1,900 resistance zone as the upside target if the pattern repeats.
NFA. This is my plan for my own money, not a signal to copy. Size your positions for your own risk.
$GRAB going for the gap fill. Price broke out of its $3.10–$3.20 range and is now inside the $2.92–$3.02 gap. A full fill takes it to $2.92, and if that doesn’t hold, the trendline near $2.75 comes into play. Once the gap is filled, it can become a solid base for a bounce back toward the $3.13 range.
Adding to $AMPX at support. Price is retesting $8.40, the exact level it bounced from in late July.
The recent red days look more like the market getting cautious ahead of tomorrow’s CPI report than anything company-specific. Small caps like $AMPX tend to get hit hardest when traders de-risk before big macro data.
Why I like it here: if this level holds, it sets up a potential double bottom. That’s two lows at the same price with a peak in between, which shows sellers failing to push lower twice. The first sign it’s working is a strong bounce off $8.40. The real confirmation comes on a move back above the ~$13.40 high from August.
There could also be a near-term catalyst. @AmpriusInc was named a finalist for the Battery Supply Chain Excellence Award at the 2026 @thebatteryshow Awards, and winners are being announced at the show in Detroit this week. A win would put more attention on the name right as it sits at support.
I’m DCAing in instead of going all in at once, since nothing is confirmed until price proves it. Next support below is $7.73 if $8.40 gives way.
Chart with both support levels and the double bottom setup below.