RISK ON / OFF ?
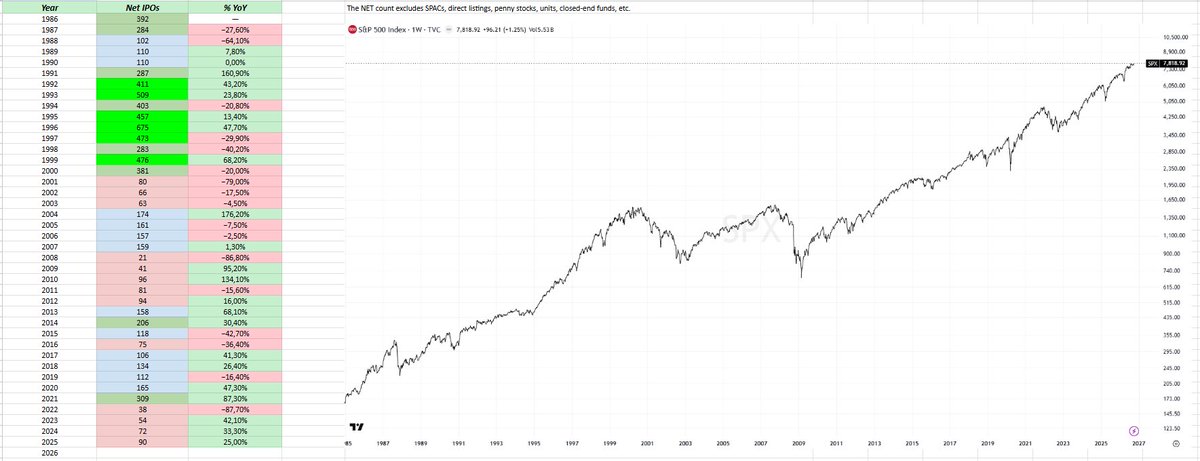
NET IPOs 1986 - 2026 and $SPX
Top 3: 1996,1993,1999
Botm 3: 2008,2022,2009
Avg IPOs per Y: 204
# Y above Avg: 14 / 40 (35%)
Top Net Month: Oct 1996 (90 Net IPOs)
Top Gross Month: March 2021 (151 IPOs, inc SPACs etc)
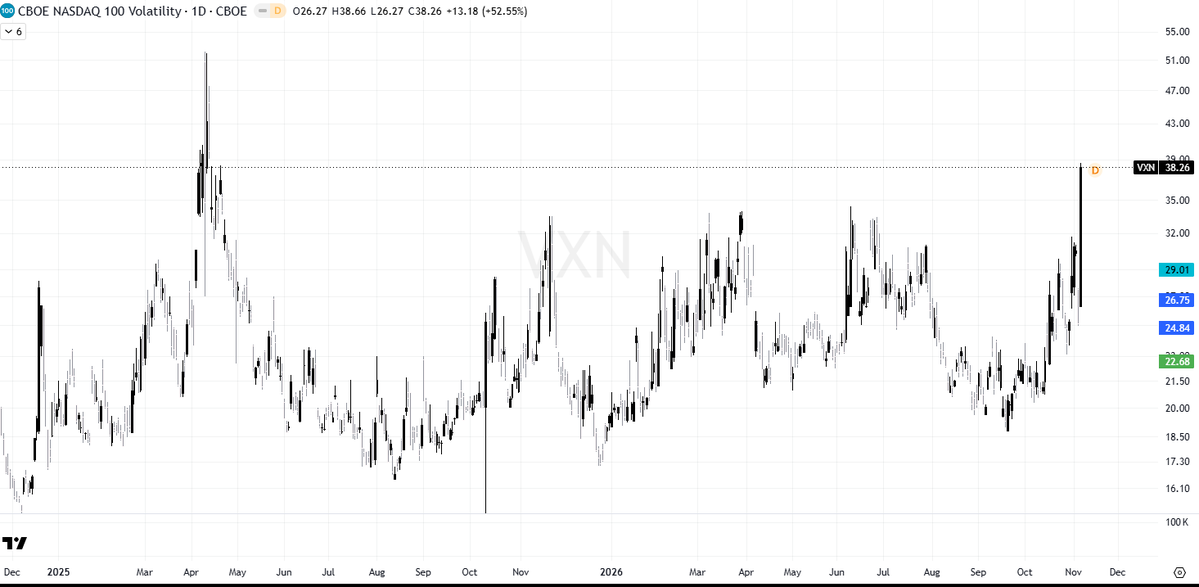
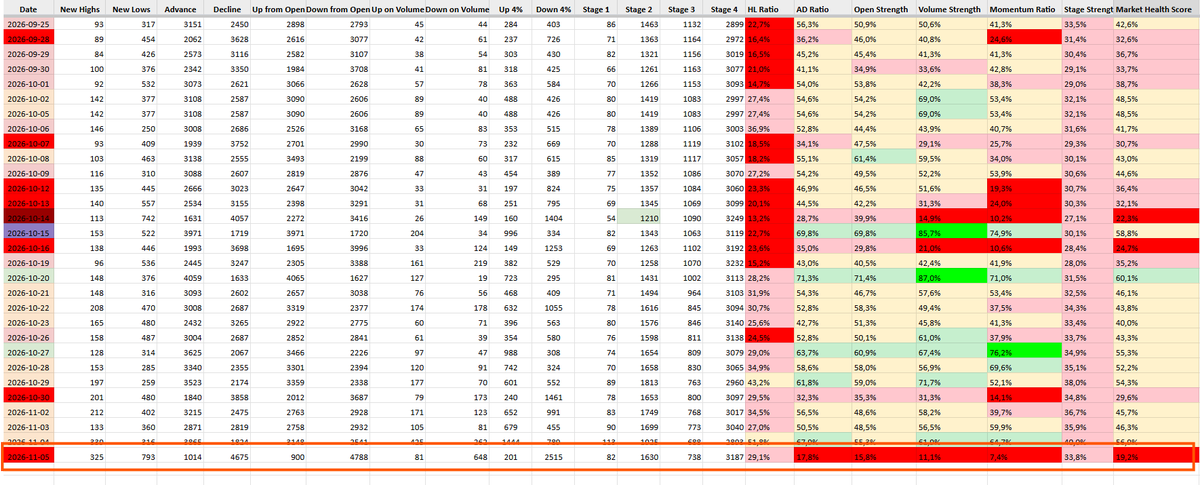
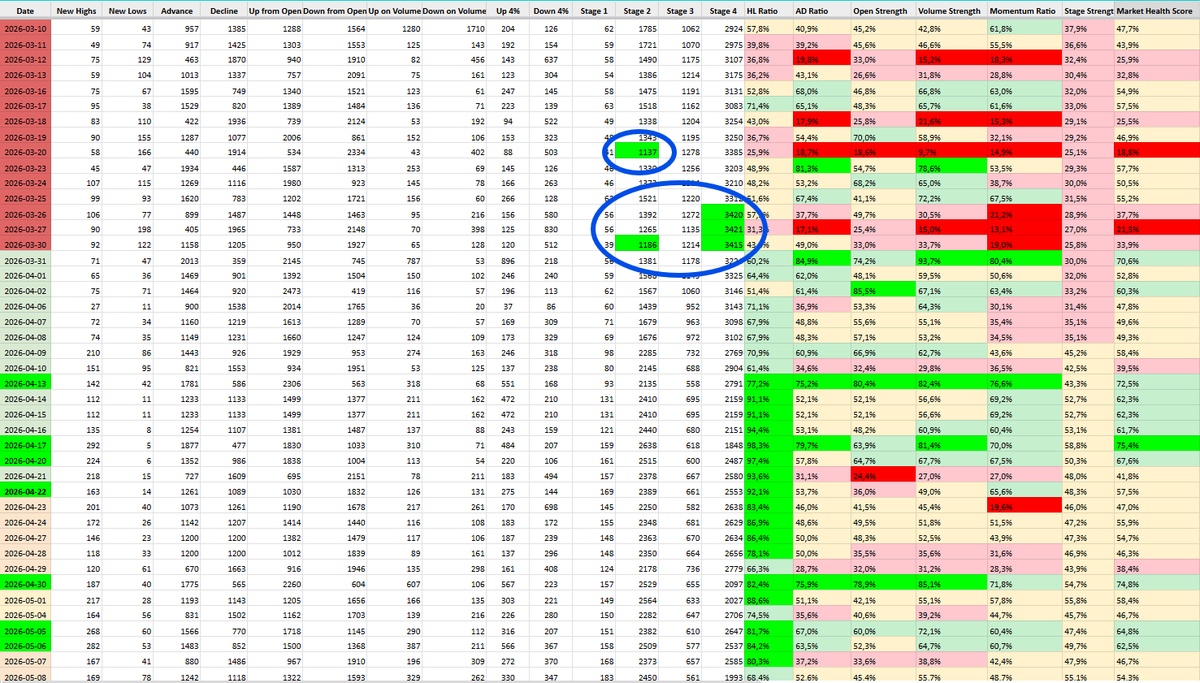
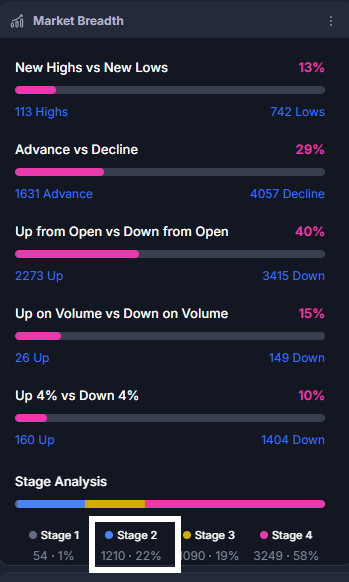
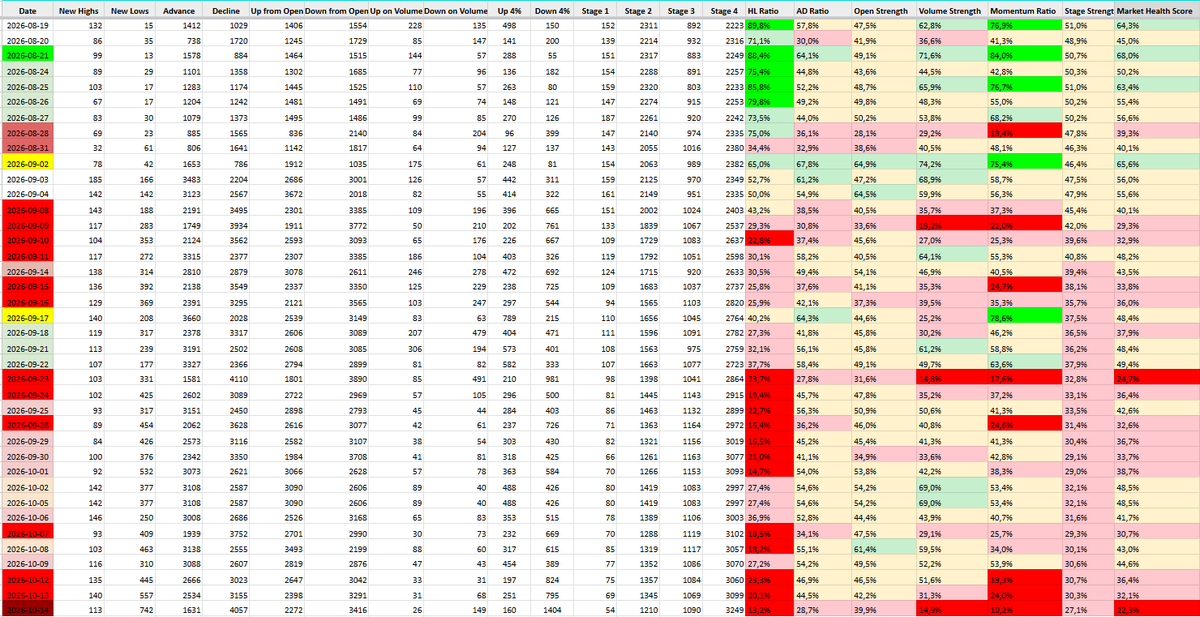
No surprise today was the worst day of 2026 for market breadth&momentum, with the weakest Market Health reading since March 20.
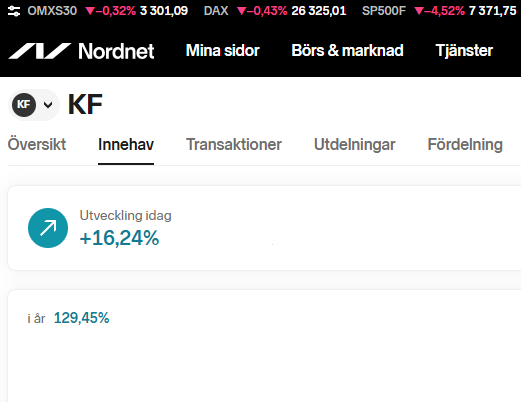
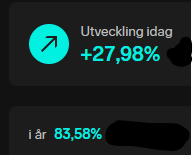
Meanwhile, my @NordnetSE account hit a new all-time high today🐻🎂
@lesse_jivermore I still think we'll see a repeat of the Roaring Twenties leading into 1929. Potentially another 2–3 years where everyone makes easy money and starts thinking they can trade full-time or retire early.
@lesse_jivermore Interesting post! I keep asking myself, was that really it? Names like OpenAI and Anthropic, " the AI" haven't even gone public yet. IPO activity is still historically low. Feels like there's more to come.
Studied some of @Qullamaggie trades from October 2019
Saw @LeifSoreide draw some parallels between the 2019 and 2026 markets.
Another interesting comparison is 1998 vs. 2026. Feels like @CFlanders7 already has a take on that one?
Love the deepdive @Muninn 🙏
Worked example:
Stock A: ATR $4, moved $1.20, relative volume 2.5. 70% of the range left, strong interest.
Stock B: ATR $4, moved $3.60, relative volume 0.6. 10% left, thin interest.
Same breakout on the chart. Very different trade.
1210 Stocks in Stage 2
Last time we saw Stage 2 <1200
-March 30 (1186)
-March 20 (1137)
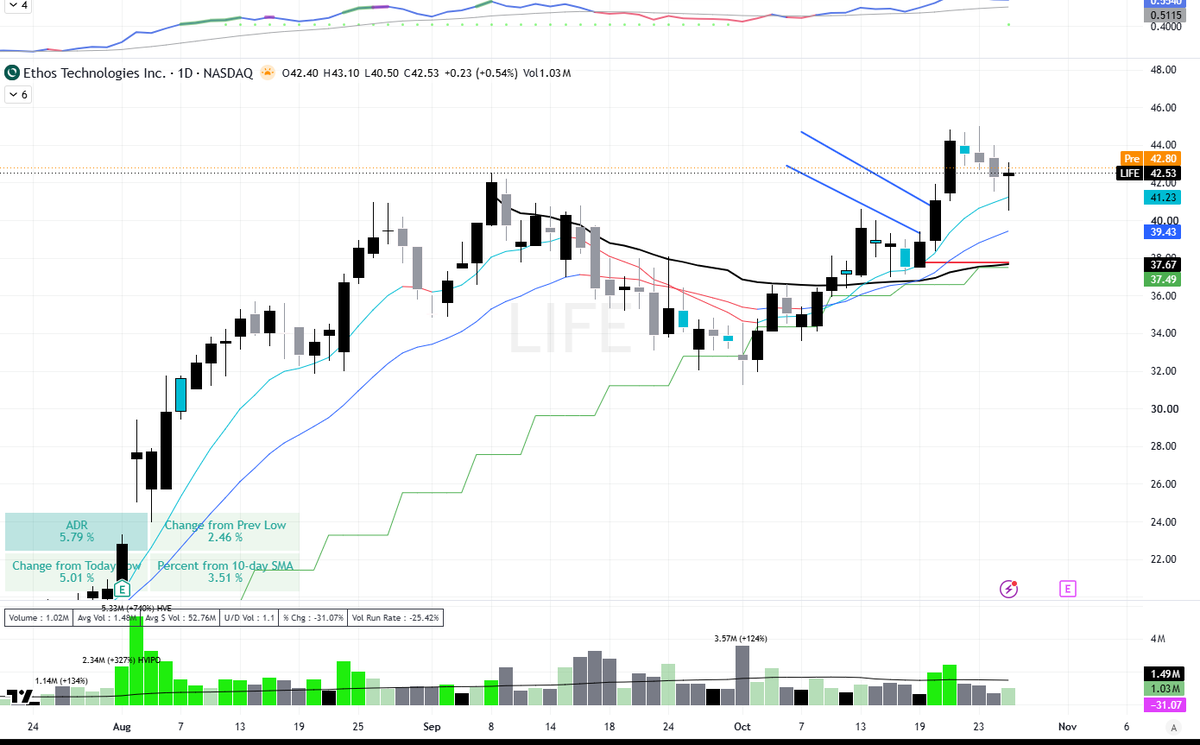
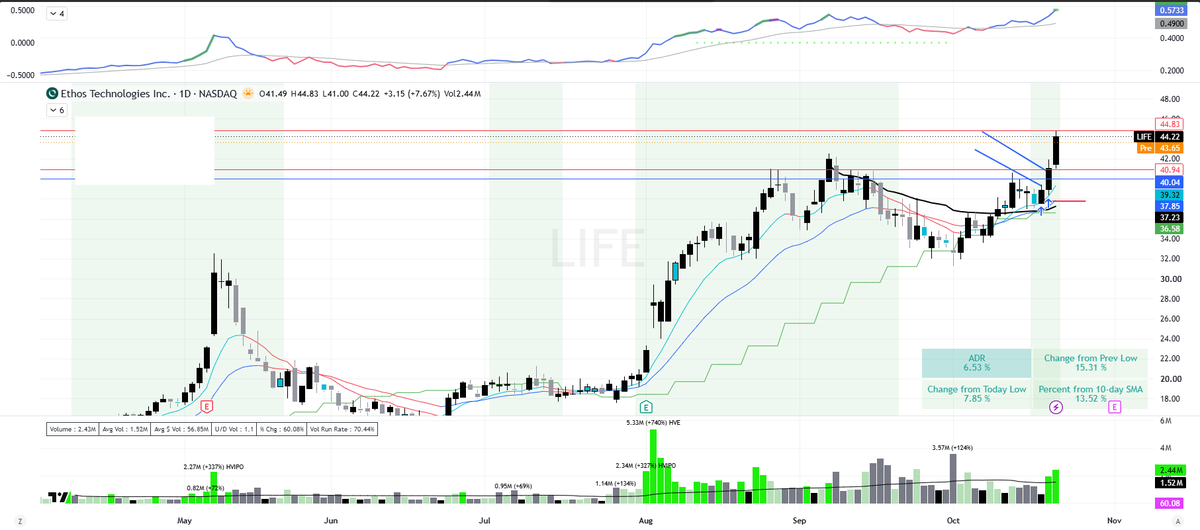
Pos: $LIFE
Trade what you see, not what they shout/you think.